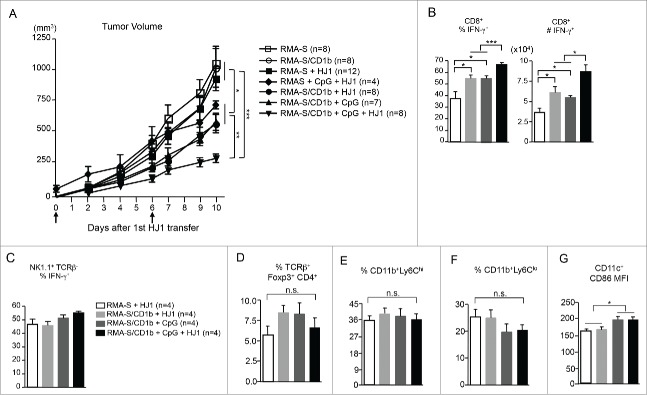
Figure 5.
HJ1 T cells exhibit in vivo antitumor immunity, which is enhanced in the presence of CpG. 5 × 10⁶ RMA-S or RMA-S/CD1b cells were injected (s.c.) in to hCD1Tg (CD45.1+) mice. Tumor size was measured on day 4 after tumor injection and every other day thereafter. HJ1 T cells were transferred with or without CpG ODN (40 μg in 100 μL of PBS) on days 4 and 10. Arrows represent days when HJ1 and or CpG ODN were injected in to tumors. (A) Tumor volumes are shown as mean ± SEM. Tumor size of mice injected with RMA-S cells is depicted by open square, mice injected with RMA-S/CD1b cells with open circle, mice injected with RMA-S cells + HJ1 T cells with black square, mice injected with RMA-S + HJ1 T cells + CpG ODN with black diamond, mice injected with RMA-S/CD1b + HJ1 T cells with black circle, mice injected with RMA-S/CD1b cells + CpG ODN with black triangle and mice injected with RMA-S/CD1b + CpG ODN + HJ1 T cells with black upside down triangle. Mice were killed at day 14 after tumor injection and tumor-infiltrating leukocytes were prepared and stained with mAbs to CD45.1, CD8α, TCRβ, NK1.1, and IFNγ to quantify the (B) percentage and number of CD8+ IFNγ+ T cells. (C) The percent of IFNγ+ NK cells was also quantified. Also, tumor infiltrating leukocytes were stained with mAbs to CD45.1, TCRβ, CD4+, Foxp3, CD11b, Ly6C, CD11c, and CD86 to quantify the percent of Treg (D), the percent of monocytic (E) and granulocytic (F) MDSCs, and CD86 expression on DCs (G). Bar graphs depict the mean ± SEM of the percentages and numbers. Open bars represent mice that received RMA-S tumor cells + HJ1 T cells, light gray bars represent mice with RMA-S/CD1b tumors + HJ1 T cells, dark gray bars depict mice with RMA-S/CD1b tumors + CpG ODN and black bars represent mice with RMA-S/CD1b tumors + CpG ODN + HJ1 T cells. ***p < 0.001; **p < 0.01; *p < 0.05.

