

Abstract
Scope
Diet‐induced obesity is associated with changes in the gut microbiota and low‐grade inflammation. Oligofructose was reported to ameliorate high fat diet‐induced metabolic disorders in mice by restoring the number of intestinal bifidobacteria. However, this has not been experimentally demonstrated.
Methods and results
We fed conventional mice, germfree mice, mice associated with a simplified human gut microbiota composed of eight bacterial species including Bifidobacterium longum (SIHUMI), and mice associated with SIHUMI without B. longum a low fat diet (LFD), a high fat diet (HFD), or a HFD containing 10% oligofructose (HFD + OFS) for five weeks. We assessed body composition, bacterial cell numbers and metabolites, markers of inflammation, and gut permeability. Conventional mice fed HFD or HFD + OFS did not differ in body weight gain and glucose tolerance. The gnotobiotic mouse groups fed LFD or HFD + OFS gained less body weight and body fat, and displayed an improved glucose tolerance compared with mice fed HFD. These differences were not affected by the presence of B. longum. Mice fed HFD showed no signs of inflammation or increased intestinal permeability.
Conclusion
The ability of oligofructose to reduce obesity and to improve glucose tolerance in gnotobiotic mice fed HFD was independent of the presence of B. longum.
Keywords: Bifidobacterium longum, Diet‐induced obesity, Glucose tolerance, Metabolic endotoxemia, Oligofructose
Abbreviations
- AUC
area under curve
- eWAT
epididymal white adipose tissue
- HFD
high fat diet
- HFD + OFS
high fat diet with oligofructose
- Il1b
interleukin‐1 beta
- LFD
low fat diet
- OCLN
occludin
- OFS
oligofructose
- SCFA
short‐chain fatty acids
- SIHUMI
simplified human gut microbiota
- SIHUMI‐Bif
simplified human gut microbiota without Bifidobacterium longum
- TLR4
Toll‐like receptor 4
- TNFa
tumor necrosis factor alpha
- ZO1
zonula occludens 1
1. Introduction
Obesity and metabolic disorders have become a major public health issue in affluent societies 1, 2, 3. Obesity results from complex interactions between genetic, environmental, and behavioral factors 2. The consumption of diets rich in energy and poor in dietary fiber and increasingly sedentary lifestyles have been identified as the main factors responsible for obesity development 4. The intestinal microbiota has been demonstrated to enhance energy extraction from diet and to thereby contribute to obesity 5, 6, 7, 8. However, dietary fiber may help in the management of metabolic disorders 9. Various dietary fibers including glucans, galactans, and fructans stimulate the growth of bifidobacteria and are therefore referred to as bifidogenic 10, 11, 12, 13, 14, 15, 16, 17. Several human studies reported an inverse relationship between the number of intestinal bifidobacteria and the development of obesity and/or diabetes 18, 19, 20. It has further been demonstrated in mice that feeding a high fat diet induces obesity and low‐grade inflammation 10, 21, accompanied by a decrease in cecal bifidobacteria and increased plasma concentrations of LPS. High LPS levels trigger the onset of metabolic disease 21. Oligofructose (OFS), an inulin‐type fructan, restores the number of intestinal bifidobacteria 10 and attenuates the development of metabolic disease when fed together with a high fat diet 22. The number of mucosal bifidobacteria was reported to correlate with reduced levels of endotoxins and an improved mucosal barrier 23. Similar improvements occurred in response to the oral application of bifidobacteria 24, 25. As yet unidentified metabolites produced by bifidobacteria increase tight junction integrity and protect Caco‐2 cells from damage caused by a pathogenic Escherichia coli strain 26. Bifidobacteria were therefore suggested to mediate the OFS‐induced amelioration of various symptoms of the metabolic syndrome. However, even though the improvement of disease symptoms and the increase in bifidobacterial numbers occurred simultaneously there is no direct experimental evidence that bifidobacteria mediate the observed beneficial effects of OFS. To clarify the role of bifidobacteria in OFS‐dependent amelioration of metabolic disease symptoms we compared gnotobiotic mice associated with a simplified human gut microbiota (SIHUMI) including Bifidobacterium longum 27, 28 and mice associated with the same community but without B. longum (SIHUMI‐Bif).
2. Materials and methods
2.1. Animals
To investigate the effect of oligofructose and bifidobacteria on the development of metabolic disease, four groups of C3H/HeOuJ mice differing in their microbial status were used: conventional mice, germfree mice, mice associated with a simplified human gut microbiota (SIHUMI; consisting of eight bacterial species: Bifidobacterium longum NCC 2705, Blautia producta DSM 2950, Bacteroides thetaiotaomicron DSM 2079, Clostridium ramosum DSM 1402, Clostridium butyricum DSM 10702, Escherichia coli K‐12 MG1655, Lactobacillus plantarum DSM 20174, and Anaerostipes caccae DSM 14662) 27, and mice associated with SIHUMI except B. longum (SIHUMI‐Bif).
Animal experiments were approved by the Office for Agriculture, Ecology, and Regional Planning of the State of Brandenburg (Germany) according to §8.1 Animal Welfare Act (approval number: 23‐2347‐6‐2009 and 23‐2347‐24‐2010). Conventional, germfree, and SIHUMI mice were obtained from the gnotobiotic animal facility of the German Institute of Human Nutrition, Potsdam‐Rehbruecke, Germany. Gnotobiotic mice were maintained in positive‐pressure isolators, conventional mice in individually ventilated cages. All mice were housed individually in polycarbonate cages on irradiated wood chips (25 kGy) at 22 ± 2°C and a relative humidity of 55 ± 5% on a 12 h light‐dark cycle. All mice had unrestricted access to irradiated (50 kGy) experimental diets and autoclaved water throughout the experiment. To generate the SIHUMI‐Bif mice, 8‐week‐old germfree mice were associated with the seven bacterial species (109/mL each) of the SIHUMI‐Bif consortium on three consecutive days. Successful association was controlled by fluorescence in situ hybridization and plating on Rogosa agar (Oxoid Limited, Hampshire, UK), as previously described for rats 27.
2.2. Experimental setup
Twelve‐week‐old mice differing in their bacterial status (conventional, germfree, SIHUMI, and SIHUMI‐Bif) were switched from a standard chow diet (Altromin fortified type 1310, Altromin, Lage, Germany) to either one of three semisynthetic diets: a low fat diet (LFD), a high fat diet (HFD), or a HFD containing oligofructose (HFD + OFS; at a 9:1 HFD/OFS ratio) (Supporting Information Table 1). Assignment of the mice to the three diets was based on their initial body weight so that at start of the intervention the mean body weights and the corresponding standard deviations were similar for all groups. Animals were fed one of the three diets ad libitum for five weeks (n = 7 per dietary group, except for conventional mice fed LFD n = 5). Body weight was measured twice a week. Energy intake and energy loss via the feces were determined after feeding the respective diet for one week as described previously 29. Gut permeability was determined in week four using 4 kDa FITC‐dextran (FD4, Sigma‐Aldrich, Munich, Germany) as described 30 and modified 28. Plasma FITC‐dextran concentrations were measured spectrophotometrically (Infinite M200 PRO, Tecan, Grödig, Austria) at 485 nm (excitation) and 535 nm (emission). High plasma concentrations of this molecule indicate increased intestinal permeability 30.
2.3. Oral glucose tolerance test
Oral glucose tolerance was determined in week five, one day prior to killing. Therefore mice were transferred from the isolator to a sterile workbench. Glucose was administered to mice fasted for 6 h (2 g/kg body weight, 20% glucose). Blood glucose was determined with a glucose meter (Bayer, Leverkusen; Germany) using blood collected from the tip of the tail vein at administration of glucose load (0 min) and 15, 30, 60, and 120 min thereafter. Microbial contamination of gnotobiotic mice during oral glucose tolerance testing was prevented by using autoclaved cages, cage lids, and water flasks.
2.4. Verification of gnotobiotic status
Microbial status was checked at the end of the experiment, i.e. after the oral glucose tolerance test had been performed. Gram staining of fecal material verified the germfree status of the mice, which was further confirmed by the absence of bacterial colonies after the incubation of PBS‐diluted feces (1:10, w/v) on Columbia blood agar (Biomérieux) under oxic and anoxic conditions. To test for common environmental contaminations in SIHUMI and SIHUMI‐Bif mice their diluted feces were incubated aerobically and/or anaerobically on Columbia blood agar (total bacteria), Mannitol salt agar (Oxoid Limited, Staphylococcus spp.), Kennel faecal Streptococcus agar (Oxoid Limited, Streptococcus spp.), and Ammonium sulfate‐L‐cysteine‐amino acid‐agar (Fluka, Propionibacterium acnes), respectively. Colonies and cell morphology after Gram staining were inspected.
2.5. Body composition measurement and killing
Body composition was determined at the end of dietary intervention using quantitative magnetic resonance (Bruker's Minispec MQ10, Bruker Minispec, Houston, TX, USA) as described previously 31. Afterwards, the mice were killed by cervical dislocation. Blood, liver, and jejunal mucosa were taken and stored at –80°C. Intestinal contents were collected and stored at –20°C for further analyses.
2.6. Bacterial cell numbers and metabolites
Fecal samples were collected at start and end of the intervention phase to quantify bacterial metabolites and enumerate bacterial cells. Fecal bifidobacteria in conventional mice were determined by quantitative real‐time PCR (qPCR) targeting the 16S rRNA gene 32. Community members in gnotobiotic mice were quantified by qPCR with groEL as the target gene 33, 34. qPCR measurements were done in triplicate with a 7500 Fast Real‐Time PCR System using 7500 software v2.0.5 (Life Technologies, Darmstadt, Germany). The PCR reaction mixture (20 μL) contained: 1 × Hot Start Buffer complete (Analytik Jena AG, Jena, Germany), 5.5 mM MgCl2, 0.25 mM dNTPs, 1.25 U innuTaq HOT‐A DNA Polymerase (Analytik Jena AG, Jena, Germany), 0.1 × Sybr Green I nucleic acid gel stain (Sigma‐Aldrich, Taufkirchen, Germany), 50 nM Rox (Affymetrix, Santa Clara, USA) as passive reference dye, 0.2 μM of each forward and reverse primer, and 1 μL of template DNA. Primers, temperature programs, and quantification times are listed in Supporting Information Table 2 32, 34. Postamplification melt‐curve analysis was performed as described 33. Generation of standards and extraction of bacterial DNA were performed as described previously 34. Bacterial cell numbers were calculated using a standard curve generated by plotting Ct values against tenfold serial dilutions of bacterial DNA containing a known number of groEL gene copies. Cell numbers of Lactobacillus plantarum were under the detection limit and therefore analyzed by plating on Rogosa Agar.
Short‐chain fatty acids (SCFA) were measured as described 29 with an HP 5890 series II gas chromatograph (Hewlett‐Packard, Waldbronn, Germany) equipped with an HP‐20 M column and a flame ionization detector. Helium was used as the carrier gas at a flow rate of 1 mL/min. Samples were analyzed in duplicates. SCFA concentrations were calculated using iso‐butyric acid (12 mM) as internal standard. Lactate concentrations in intestinal contents were determined enzymatically according to manufacturer's instructions (Boehringer Mannheim/R‐Biopharm, Darmstadt, Germany).
2.7. Liver triglycerides
Liver tissue was homogenized as described previously 29. Triglycerides (triglyceride reagent, Sigma, St. Louis, MO, USA) and protein contents (detergent compatible protein assay, Bio‐Rad, Hercules, CA, USA) were analyzed in triplicate according to the manufacturers’ instructions.
2.8. LPS analysis
Plasma LPS levels were determined by Charles River Laboratories (L'Arbresle Cedex, France) using the Limulus Amebocyte Lysate kinetic chromogenic methodology.
2.9. Gene expression analyses
RNA was isolated from jejunal scrapings and liver tissue using peqGOLD TriFast reagent (PEQLAB, Erlangen, Germany) as described 35. Residual genomic DNA was removed using the Turbo DNA‐free Kit (Ambion, Austin, TX, USA). Successful removal of genomic DNA was verified by the absence of 18S rRNA gene amplification. Integrity of RNA was inspected by running aliquots on agarose gels stained with ethidium bromide. Complementary DNA was synthesized from 1 μg of total RNA using the RevertAid H Minus First Strand complementary DNA Synthesis Kit (Thermo Scientific, Schwerte, Germany). qPCR was performed in triplicate using the Applied Biosystems 7900 HT Fast Real‐Time PCR System (Applied Biosystems). Each reaction mixture (5 μL) contained 2.5 μL Sybr Green Master Mix or TaqMan Universal PCR Master Mix, a cDNA amount corresponding to 5 ng of RNA and gene‐specific primer pairs (0.3 μM each, Supporting Information Table 3). An oligonucleotide probe (0.2 μM, Supporting Information Table 3) was added to the TaqMan reaction mixture. Gene expression was calculated as ΔCt using 18S rRNA or beta‐actin as a reference, and expressed relative to the LFD group, which was normalized to a value of 1 36.
2.10. Statistical analysis
Data are presented as means with their standard errors or as boxplots as specified in the figure legends. Data distribution was tested for normality with the Kolmogorov–Smirnov test (Prism 6.0 for Windows, GraphPad Software, Inc., San Diego, CA, USA). Normally distributed data were tested for statistical significance of difference using unpaired t‐test or one‐way analysis of variance followed by Tukey's post hoc test if more than two groups were compared. Data of mice fed standard chow diet and the experimental diets were compared with the Dunnett's post hoc test. Non‐normally distributed data were analyzed with the Mann–Whitney U test, whereas three or more unpaired groups were compared with the Kruskal–Wallis one‐way analysis of variance followed by Dunn's multiple comparison test. Differences were considered significant at p < 0.05.
3. Results
3.1. OFS supplementation of HFD does not protect conventional mice from diet‐induced obesity
To investigate the specific role of bifidobacteria in OFS‐dependent improvement of diet‐induced metabolic endotoxemia, we first aimed to corroborate the correlation between high bifidobacterial numbers and the improvement of the high fat diet‐induced endotoxemia and related metabolic parameters recently reported for C57BL/6J mice for another mouse strain 10. For that purpose, conventional C3H mice, previously kept on standard chow diet, were fed for five weeks either one of three semisynthetic diets: LFD, HFD, and HFD + OFS. The body weight gain of mice fed the LFD for five weeks was moderate, whereas that of mice fed the HFD or the HFD + OFS increased significantly (Fig. 1A). Mice fed HFD or HFD + OFS developed an impaired glucose tolerance compared with LFD‐fed mice (Fig. 1B, C). Body weight increase and glucose tolerance of conventional mice fed HFD + OFS were similar to those of conventional mice fed the HFD, indicating no protective effect of OFS supplementation against obesity or glucose intolerance in HFD‐fed C3H mice.
Figure 1.
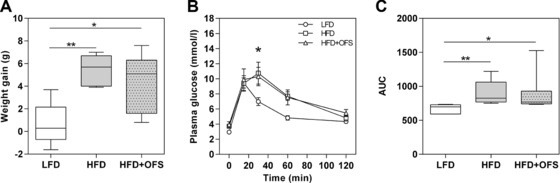
Weight gain and glucose tolerance of conventional mice. Weight gain (A), oral glucose tolerance (B), and total area under the curve (AUC) (C) of conventional C3H mice after five weeks on semisynthetic diets: low fat diet (○ LFD), high fat diet (□ HFD), and high fat diet supplemented with oligofructose (∆HFD + OFS). Data of weight gain and AUC during glucose tolerance test are expressed as medians. Boxes show the 25–75, whiskers the 5–95 percentile (*p < 0.05, **p < 0.01). Plasma glucose data are expressed as means with their standard errors (*p < 0.05, LFD versus HFD + OFS). n = 5–7 per dietary group.
In contrast to the HFD‐fed group, which showed little variance in weight gain and glucose tolerance between animals, the HFD + OFS‐fed mice varied considerably in their body weight gains, namely from 0.8 to 7.6 g, and in their total areas under the blood glucose curve (AUCs). This high interindividual variability in HFD + OFS‐fed mice indicates that some mice responded to OFS supplementation with improved metabolic parameters whereas others did not respond. These different responses might have been due to differences in gut microbiota composition.
Bifidobacterial cell numbers in our conventional mice were under the detection limit (105 cells/g intestinal content) even during OFS supplementation. To circumvent the variability in microbiota composition among individual conventional mice and to better control the size of the bifidobacterial population, we decided to use gnotobiotic mice. In contrast to conventional mice, in which the exact microbiota composition is unknown, gnotobiotic mice harbor a stable microbiota with known bacterial members.
3.2. Gnotobiotic mice fed HFD + OFS exhibit improved adiposity parameters and glucose tolerance
The simplified human gut microbiota (SIHUMI) used in this study harbors eight bacterial species representative of the human intestine. This microbial community was originally established in rats and demonstrated to respond to various types of dietary fiber 27. Recently, it has also been successfully used in mice 28. Germfree, SIHUMI, and SIHUMI‐Bif mice were fed LFD, HFD, and HFD + OFS for five weeks to find out whether OFS improved diet‐induced obesity, metabolic endotoxemia, and related disorders in these gnotobiotic mice and, if yes, whether this is mediated by a Bifidobacterium species, namely B. longum. All mice fed HFD gained more body weight, total body fat, and epididymal white adipose tissue (eWAT) weight than animals fed LFD, independently of their bacterial status (p < 0.05, Table 1, Fig. 2). In contrast, mice of all groups fed HFD + OFS showed less weight gain (p < 0.01, Fig. 2) and body fat percentage (p < 0.05, Table 1) compared with mice fed the unsupplemented HFD. Weight gain and body fat of the SIHUMI and the SIHUMI‐Bif mice fed HFD + OFS were similar to those of SIHUMI and SIHUMI‐Bif mice fed LFD (Table 1, Fig. 2). Germfree mice even lost weight (–1.5 ± 0.8 g) when fed HFD + OFS. The eWAT weights were also lower in the groups fed HFD + OFS than in the groups fed HFD, however, statistical significance was only reached in germfree mice (Fig. 2). It may be concluded that the supplementation of HFD with OFS per se reduced body weight gain and body fat in the gnotobiotic mice in comparison with the mice fed the unsupplemented HFD, regardless of the presence or absence of B. longum or of any microbiota. Liver triglyceride contents tended to be lower in gnotobiotic mice fed LFD or HFD + OFS than in HFD‐fed mice (Table 1). Again, this effect was independent of the presence or absence of B. longum in the animals.
Table 1.
Biometric parameters of germfree, SIHUMI, and SIHUMI‐Bif mice fed a low fat diet (LFD), a high fat diet (HFD), or a high fat diet with oligofructose (HFD + OFS) for five weeks
| Status | Germfree | SIHUMI | SIHUMI‐Bif | ||||||
|---|---|---|---|---|---|---|---|---|---|
| Diet | LFD | HFD | HFD + OFS | LFD | HFD | HFD + OFS | LFD | HFD | HFD + OFS |
| Biometric parametera | Mean ± SEM | Mean ± SEM | Mean ± SEM | Mean ± SEM | Mean ± SEM | Mean ± SEM | Mean ± SEM | Mean ± SEM | Mean ± SEM |
| Body fat (week 5; g) | 8.5±0.3 | 10.1±0.5* | 7.5±0.6++ | 7.6±0.3 | 10.5±0.9** | 7.9±0.3+ | 9.5±0.5‡‡ | 11.9±0.6* | 9.4±0.5+ |
| Lean mass (week 5; g) | 17.4±0.6 | 17.8±0.5 | 14.4±1.1*+ | 19.6±0.2† | 19.5±0.4† | 19.0±0.3†† | 20.3±0.6†† | 20.9±0.4††† | 21.1±0.9††† |
| Energy intake (week 2; kJ/d) | 55.1±1.8 | 60.1±3.5 | 47.0±3.0+ | 51.9±8.0 | 63.9±6.4 | 53.0±5.6 | 58.7±6.0 | 64.1±8.6 | 73.0±6.9††‡ |
| Digestibility (%) | 77.4±0.8 | 85.9±0.8*** | 82.8±1.2** | 81.4±3.4 | 90.1±1.2† | 75.0±4.9+ | 78.9±1.5 | 88.4±0.5 | 75.5±5.2+ |
| Digestible energy (week 2; kJ/d) | 43.3±1.6 | 51.7±3.4 | 39.9±2.7+ | 47.4±3.8 | 57.8±6.3 | 41.2±6.5 | 46.5±5.2 | 63.7±3.6 | 56.4±6.7 |
| Liver triglycerides (mg/g tissue) | 7.4±1.5 | 10.9±0.7 | 7.7±2.9 | 6.5±0.9 | 12.1±1.2** | 7.4 ±1.2+ | 10.0±1.5 | 12.2±1.5 | 7.5±1.1 |
Data are presented as means with their standard errors (n = 6–7 per dietary group, except for body fat of germfree mice fed HFD + OFS n = 3). SIHUMI = simplified human microbiota, SIHUMI‐Bif = SIHUMI without Bifidobacterium longum. Mean values were significantly different compared with LFD (*) and HFD (+) fed mice with the same bacterial status (*+ p < 0.05, **++ p < 0.01, ***+++ p < 0.001). Mean values were significantly different compared with germfree (†) and SIHUMI (‡) mice on the same diet (†‡ p < 0.05, ††‡‡ p < 0.01, †††‡‡‡ p < 0.001).
Figure 2.
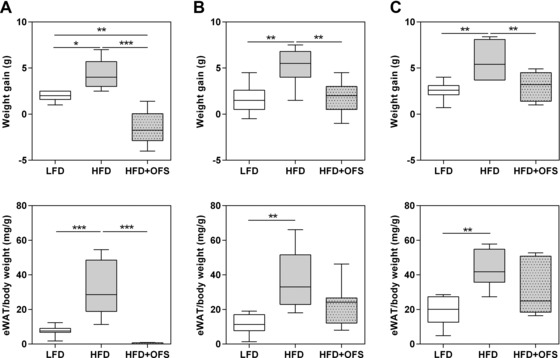
Body weight gain and weight of epididymal white adipose tissue (eWAT). (A) Germfree, (B) SIHUMI, and (C) SIHUMI‐Bif mice either fed a semisynthetic low fat diet (LFD), high fat diet (HFD), or high fat diet supplemented with oligofructose (HFD + OFS). Data are expressed as medians. Boxes show the 25–75, whiskers the 5–95 percentile (*p < 0.05, **p < 0.01, ***p < 0.001). n = 5–7 per dietary group.
During the second week of the 5‐week intervention period we also measured diet digestibility and total digestible energy. The colonization status of the mice did not affect diet digestibility, except for germfree mice, which displayed a lower HFD digestibility than SIHUMI mice (p < 0.05, Table 1). In SIHUMI and SIHUMI‐Bif mice OFS supplementation reduced the digestibility, which was lower for HFD + OFS compared with the unsupplemented HFD. However, total digestible energy did not differ between animals fed HFD or HFD + OFS, neither in SIHUMI nor SIHUMI‐Bif mice. Only germfree mice fed the HFD + OFS showed a lower digestible energy compared with mice that were also germfree but fed the HFD; mainly due to a lower feed intake (p < 0.05, Table 1).
Independent of the bacterial status, mice fed HFD exhibited an impaired glucose tolerance compared with mice fed LFD (Fig. 3). In contrast, OFS‐treated gnotobiotic mice on HFD revealed an improved glucose tolerance compared with HFD‐fed mice as evident from the plasma glucose levels 30 min after the glucose challenge (p < 0.05, Fig. 3). However, differences between the AUCs of HFD‐fed and HFD + OFS‐fed mice are only significant in the germfree mice. Once again, the bacterial status of the animals did not account for these differences.
Figure 3.
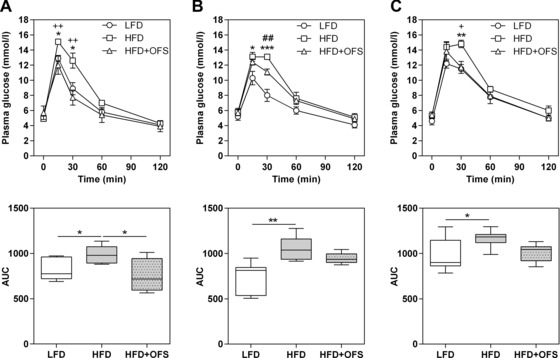
Glucose tolerance test in gnotobiotic mice. Plasma glucose (mmol/L) following an oral glucose load (2 g/kg body weight, 200 g/L glucose) in germfree (A), SIHUMI (B), and SIHUMI‐Bif mice (C) fed one of these semisynthetic diets: low fat diet (○ LFD), high fat diet (□ HFD), and high fat diet supplemented with oligofructose (∆ HFD + OFS). Plasma glucose data are expressed as means with their standard errors (*p < 0.05, **p < 0.01, ***p < 0.001, LFD versus HFD; ## p < 0.01, LFD versus HFD + OFS; + p < 0.05, ++ p < 0.01, HFD versus HFD + OFS). Box plots represent the total area under the curve (AUC) for each dataset. Data are expressed as medians. Boxes show the 25–75, whiskers the 5–95 percentile (**p < 0.01, ***p < 0.001). n = 5–7 per dietary group, except for germfree mice fed OFS (n = 4).
3.3. Colonization status and diet influence the proportion of community members in gnotobiotic mice
To assess the impact of the three experimental diets on microbial community composition in SIHUMI and SIHUMI‐Bif mice, we enumerated all members of the two microbial consortia in feces of the mice using qPCR. Before dietary intervention cell numbers of total bacteria, A. caccae, B. thetaiotaomicron, and C. butyricum were higher in feces of SIHUMI‐Bif compared with SIHUMI mice (p < 0.05, Table 2), but the observed differences in cell numbers were below 0.5 Log10 cells/g dry matter. The high cell counts in SIHUMI‐Bif mice were not accompanied by increased fecal SCFA or lactate concentrations (Table 3). Taken together, these observations suggest that at least on a standard chow diet, which is high in dietary fiber, these small differences in cell numbers are probably of little biological relevance.
Table 2.
Microbial cell numbers in feces (Log10 cells/g dry mattera)) of SIHUMI and SIHUMI‐Bif mice at baseline (standard chow diet, SD) or after five week intervention period with either one of the following semisynthetic diets: low fat diet (LFD), high fat diet (HFD), high fat diet supplemented with oligofructose (HFD + OFS)
| Status | SIHUMI | SIHUMI‐Bif | ||||||
|---|---|---|---|---|---|---|---|---|
| Diet | SD | LFD | HFD | HFD + OFS | SD | LFD | HFD | HFD + OFS |
| Organism | Mean ± SEM | Mean ± SEM | Mean ± SEM | Mean ± SEM | Mean ± SEM | Mean ± SEM | Mean ± SEM | Mean ± SEM |
| A. caccae | 9.79±0.07 | 9.45±0.15 | 8.84±0.23***# | 9.58±0.14 | 10.23±0.12++ | 9.33±0.18***††† | 8.48±0.06***# | 9.22±0.11*** |
| B. thetaiotaomicron | 10.55±0.10 | 9.47±0.37* | 9.79±0.43 | 10.61±0.19 | 10.87± 0.10+ | 8.30±0.38***‡‡‡+ | 9.36±0.25**# | 11.16±0.09+ |
| B. longum | 9.08±0.09 | 7.46±0.13***†††‡‡‡ | 8.78±0.13 | 9.91±0.19* | ||||
| B. producta | 10.56±0.05 | 9.92±0.07***‡‡ | 10.13±0.11*** | 10.43±0.09 | 10.63±0.04 | 9.74±0.09***‡‡‡ | 9.89±0.07***## | 10.53±0.15 |
| C. butyricum | 8.78±0.08 | 7.43±0.17**‡ | 7.43 ±0.20*** | 6.84±0.16*** | 9.02±0.05+ | 6.61±0.28***†‡‡‡ | 7.49±0.12*** | 7.84±0.14***+++ |
| C. ramosum | 9.84±0.07 | 9.07±0.08***††‡‡‡ | 9.60±0.13 | 9.81±0.09 | 9.77±0.05 | 8.99±0.12***‡‡‡ | 9.23±0.07***##+ | 9.73±0.07 |
| E. coli | 9.34±0.05 | 9.61±0.12 | 9.59±0.21 | 9.51±0.22 | 9.42±0.05 | 9.43±0.11† | 9.00±0.07***##+ | 9.47±0.10 |
| L. plantarum b) | 7.14±0.10 | 5.16±0.29***‡‡ | 5.65±0.27***# | 6.89±0.29 | 6.96±0.07 | 4.85±0.13***††‡‡‡ | 5.63±0.18***### | 6.85±0.11 |
| total | 10.55±0.09 | 9.53±0.43** | 9.73±0.22* | 10.08±0.21 | 10.96±0.05+++ | 9.35 ±0.10***‡‡‡ | 9.61±0.20***### | 10.67±0.15+ |
Values are means with their standard errors (n = 21 per SD, n = 7 per semisynthetic diet).b) Cell numbers of L. plantarum were determined by plating on Rogosa Agar. SIHUMI, simplified human microbiota; SIHUMI‐Bif, SIHUMI without Bifidobacterium longum. Mean values were significantly different between baseline (SD) and dietary intervention (LFD, HFD, HFD + OFS) for a given group of animals with the same bacterial status (*p < 0.05, **p < 0.01, ***p < 0.001). Mean values were significantly different between dietary groups during intervention (LFD, HFD, HFD + OFS) in animals with the same bacterial status (†LFD:HFD; ‡LFD:HFD + OFS; #HFD:HFD + OFS; †/‡/# p < 0.05, ††/‡‡/## p < 0.01, †††/‡‡‡/### p < 0.001). Mean values were significantly different compared with SIHUMI mice on the same diet (+ p < 0.05, ++ p < 0.01, +++ p < 0.001).
Table 3.
Fecal short chain fatty acid (SCFA) and lactate concentrations (μmol/g dry matter) of SIHUMI and SIHUMI‐Bif mice before dietary intervention at standard chow diet (SD) and at the end of dietary intervention: low fat diet (LFD), high fat diet (HFD), and high fat diet supplemented with oligofructose (HFD + OFS)
| Status | SIHUMI | SIHUMI‐Bif | ||||||
|---|---|---|---|---|---|---|---|---|
| Diet | SD | LFD | HFD | HFD + OFS | SD | LFD | HFD | HFD + OFS |
| Substancea) | Mean ± SEM | Mean ± SEM | Mean ± SEM | Mean ± SEM | Mean ± SEM | Mean ± SEM | Mean ± SEM | Mean ± SEM |
| Acetate | 103.7±5.0 | 47.4±5.5*** | 28.9±2.4***## | 70.0±10.6** | 99.9±4.1 | 54.1±5.6***‡ ‡ | 38.2±9.0***### | 104.4±12.3 |
| Propionate | 10.7±0.6 | 4.0±0.9*** | 2.3±0.7*** | 2.1±0.4*** | 9.5±0.6 | 3.6±0.4* | 4.6±1.9* | 9.2±2.4+ |
| Butyrate | 4.6±0.4 | 1.6±0.2***‡ | traces | 3.8±1.0 | 3.7±0.3 | 3.4±0.4+++ | traces | 4.8±0.7 |
| Lactate | 16.3±2.3 | 7.2±2.2 | 8.2±3.5 | 8.3±4.9 | 10.6±1.2+ | 1.7±0.5‡+ | traces | 23.4±6.7** |
a) Values are means with their standard errors (n = 21 per SD, n = 7 per semisynthetic diet). Valerate was not detected, iso‐valerate was detected in traces (detection limit for all SCFA 1 ng/μL). SIHUMI, simplified human microbiota; SIHUMI‐Bif, SIHUMI without Bifidobacterium longum. Mean values were significantly different between baseline (SD) and dietary intervention (LFD, HFD, HFD + OFS) for a given group of animals with the same bacterial status (*p < 0.05, **p < 0.01, ***p < 0.001). Mean values were significantly different between dietary groups during intervention (LFD, HFD, HFD + OFS) in animals with the same bacterial status (†LFD:HFD; ‡LFD:HFD + OFS; #HFD:HFD + OFS; †/‡/# p < 0.05, ††/‡‡/## p < 0.01,†††/‡‡‡/### p < 0.001). Mean values were significantly different compared with SIHUMI mice on the same diet (+ p < 0.05, ++ p < 0.01, +++ p < 0.001).
Feeding semisynthetic LFD or HFD for five weeks led to decreased cell numbers of almost all members of the SIHUMI in comparison with the complex standard diet fed before intervention (Table 2). In contrast, cell numbers of almost all bacterial species in HFD + OFS‐fed SIHUMI mice were unaffected by the switch from the fiber‐rich standard chow to this semisynthetic experimental diet, except for B. longum, which increased, and C. butyricum, which decreased. In SIHUMI‐Bif mice, the bacterial cell numbers also decreased in response to LFD and HFD feeding. In contrast, SIHUMI‐Bif mice fed HFD + OFS maintained high cell numbers of all community members except A. caccae and C. butyricum, which decreased. Interestingly, during HFD + OFS feeding cell numbers of B. thetaiotaomicron and C. butyricum were higher in SIHUMI‐Bif mice than in SIHUMI mice (Table 2).
In accordance with decreased bacterial cell numbers, fecal acetate, propionate, butyrate, and lactate also declined in animals fed LFD or HFD compared with standard chow diet. This was independent of the colonization status of the animals (Table 3). However, SIHUMI and SIHUMI‐Bif mice fed HFD + OFS displayed higher fecal concentrations of acetate than mice fed LFD or HFD. Unexpectedly, SIHUMI mice fed HFD + OFS contained approximately 30% less SCFA and even 60% less lactate in their feces than SIHUMI‐Bif mice fed the same diet (Table 3).
3.4. HFD feeding influences neither the intestinal barrier nor the LPS levels in gnotobiotic C3H mice
To analyze the intestinal barrier function we used 4 kDa FITC‐dextran as an indicator of small intestinal permeability. We did not observe any differences in plasma FITC‐dextran levels, neither in dependence of diet nor of microbial status (Fig. 4). In accordance with the results of the in vivo assessment of intestinal permeability, serum LPS levels did not differ significantly between SIHUMI and SIHUMI‐Bif mice, irrespective of the diet (LFD: 0.07 ± 0.07 versus 0.17 ± 0.08 IU/mL, HFD: 0.10 ± 0.06 versus 0.48 ± 0.41 IU/mL, HFD + OFS: 0.21 ± 0.17 versus 1.09 ± 0.99 IU/mL). LPS levels in germfree animals were under the detection limit (0.05 IU/mL). As gut permeability is controlled by tight‐junction proteins, we also analyzed jejunal mRNA expression levels of the two tight‐junction proteins zonula occludens 1 (Zo1) and occludin (Ocln), which are pivotal for tight‐junction integrity 37. Germfree mice showed no diet‐dependent differences in the expression of Zo1 (Fig. 4). SIHUMI mice fed HFD exhibited higher expression levels of Zo1 compared with SIHUMI mice fed LFD (p < 0.05) or HFD + OFS (p < 0.01). In contrast, Zo1 expression in SIHUMI‐Bif mice was only increased when HFD + OFS was fed. Relative mRNA expression of Ocln was lower in germfree mice fed HFD or HFD + OFS than in germfree mice fed LFD, while there were no diet‐dependent differences in SIHUMI and SIHUMI‐Bif mice (Fig. 4).
Figure 4.
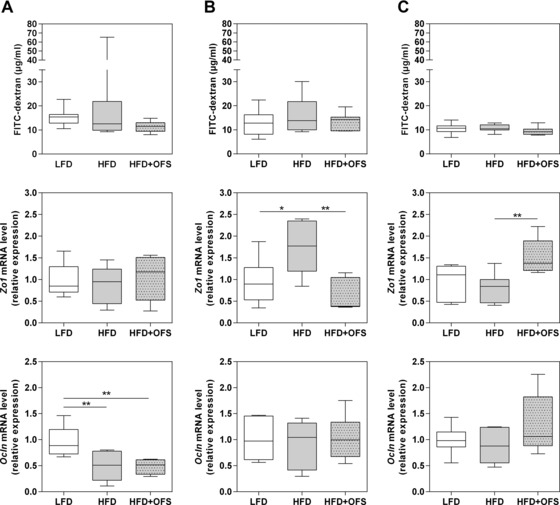
Systemic FITC‐dextran concentration and relative mRNA expression of jejuna epithelial tight‐junction proteins zonula occludens 1 (Zo1) and occludin (Ocln). (A) Germfree, (B) SIHUMI, and (C) SIHUMI‐Bif mice either fed a semisynthetic low fat diet (LFD), high fat diet (HFD), or high fat diet supplemented with oligofructose (HFD + OFS). Data are expressed as medians. Boxes show the 25–75, whiskers the 5–95 percentile (*p < 0.05, **p < 0.01) n = 6–7 per dietary group.
Toll‐like receptor 4 (TLR4), activated by LPS, mediates obesity‐related low‐grade inflammation, which becomes detectable in the liver after two weeks of HFD feeding 21. Only germfree animals fed HFD or HFD + OFS exhibited increased hepatic Tlr4 mRNA expression levels relative to the LFD group, whereas SIHUMI and SIHUMI‐Bif mice did not show any diet‐dependent differences. Hepatic tumor necrosis factor alpha (Tnfa) and interleukin‐1 beta (Il1b) mRNA expression was also measured, but neither germfree and SIHUMI mice nor SIHUMI‐Bif mice displayed diet‐dependent differences (Fig. 5).
Figure 5.
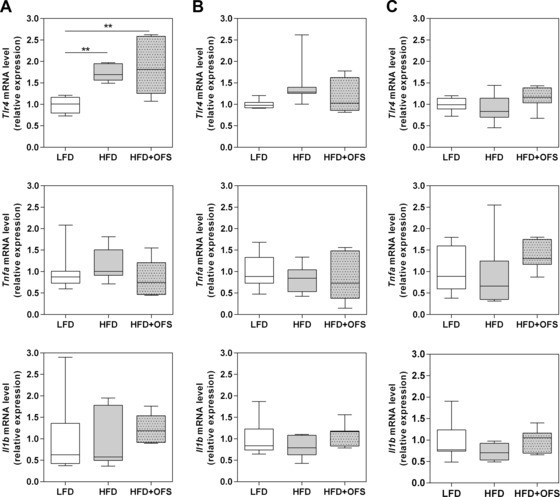
Relative mRNA expression of Toll‐like receptor 4 (Tlr4) and proinflammatory cytokines tumor necrosis factor alpha (Tnfa) and interleukin‐1 beta (Il1b) in liver. (A) Germfree, (B) SIHUMI, and (C) SIHUMI‐Bif. Mice were either fed a semisynthetic low fat diet (LFD), high fat diet (HFD), or high fat diet supplemented with oligofructose (HFD + OFS). Data are expressed as medians. Boxes show the 25–75, whiskers the 5–95 percentile (*p < 0.05, **p < 0.01). n = 6–7 per dietary group.
4. Discussion
Our main finding in gnotobiotic mice is that the beneficial effects of OFS on body weight gain, body composition, and glucose tolerance were independent of the colonization status. Germfree mice as well as SIHUMI and SIHUMI‐Bif mice displayed essentially the same response to HFD + OFS feeding indicating that B. longum did not mediate the observed effects. In their pioneering studies, Cani and colleagues reported that conventional C57BL/6J mice fed a HFD supplemented with OFS had less severe symptoms of metabolic endotoxemia compared with mice fed only HFD. This improvement was accompanied by increased numbers of intestinal bifidobacteria 10, 22. The latter were therefore held responsible for the beneficial effects. In contrast to this study, we observed similar effects of OFS in some of our conventional mice, but not in others. These differences between animals of the same group may be due to differences in microbiota composition although the mice were raised and kept under the same conditions. In fact, the intestinal microbiota shows a considerable degree of individuality and variability in humans and mice 38, 39, 40, 41. Which factors control the development, maintenance, and stability of the microbiota is not completely understood. However, various environmental factors are major determinants 42, 43. Friswell et al. observed that even animals of the same mouse strain (in this case C3H) developed different bacterial composition patterns, when housed at different geographical locations (Manchester, UK or Stanford, USA) 42. A major impact of environmental factors may also be deduced from the observation that C3H, BALB/c, and C57BL/10 mice harbored a cage‐specific microbiota 43. We previously made similar observations: Intestinal microbiota profiles of mice originating from different suppliers clustered by location (N.P., unpublished).
The use of C3H/HeOuJ mice in this study instead of C57BL/6J mice used by Cani et al. may also account for the observed discrepancies: 1. Cani et al. reported symptoms of metabolic disease (reduced glucose tolerance, increased body weight gain and fat mass development, increased intestinal permeability, and elevated inflammatory tone) in response to HFD feeding 21, 30. Even though our mice received a similar high fat diet for one additional week they displayed less severe symptoms. 2. In contrast to Cani et al., who reported a general improvement of these symptoms in C57BL/6J mice in response to OFS, four of our conventional C3H mice responded to OFS supplementation with reduced body weight gain, while three mice did not respond. Susceptibility to diet‐induced obesity depends on the mouse strain so that the diet‐induced pathology may be milder in some strains than in others 44, 45, 46. Which of these factors account for the inconsistent responses of conventional C3H mice to HFD + OFS remains unclear and deserves further investigation.
The lower body weight gain and body fat content observed in HFD + OFS‐fed SIHUMI and SIHUMI‐Bif mice compared with HFD‐fed SIHUMI and SIHUMI‐Bif mice were not due to smaller amounts of digested energy. The lower energy intake of germfree mice fed HFD + OFS was probably due to an increased osmotic pressure exerted by OFS, as germfree mice in contrast to SIHUMI and SIHUMI‐Bif mice are not able to degrade OFS. We assume that the reduced feed intake observed for germfree mice fed OFS was due to the satiety effect brought about by the enlarged cecum typical of germfree mice. It is caused by OFS and mucus, which in the absence of a microbiota are not degraded and therefore accumulate in the cecum resulting in water influx and swelling. This is reflected by a high water content of cecal matter (see Supporting Information Table 4).
Feeding SIHUMI mice or SIHUMI‐Bif mice for five weeks with semisynthetic diets (LFD and HFD) decreased the cell counts of almost all community members and fecal SCFA concentrations compared with the time before dietary intervention. These changes were probably due to switching the mice from standard chow, which is rich in fermentable dietary fiber, to the semisynthetic diets during intervention. The latter are poor in fermentable fiber. Higher cell numbers of B. thetaiotaomicron and C. butyricum in SIHUMI‐Bif mice fed HFD + OFS were accompanied by 1.6‐fold and threefold, respectively, higher fecal SCFA and lactate concentrations in SIHUMI‐Bif mice compared with SIHUMI mice. All SIHUMI members, except B. producta were able to grow on OFS, as deduced from in vitro fermentation experiments (N.P., unpublished). When B. thetaiotaomicron and B. longum are cocultured on OFS the latter organism dominates 47. B. longum is highly competitive when cocultured with other bacterial species on OFS 48, 49. Little knowledge exists about the fermentation of OFS by defined bacterial communities composed of more than two bacterial strains. Hence, the efficient degradation of OFS in SIHUMI‐Bif mice as deduced from the comparatively high fecal SCFA concentrations indicates that other community members benefit from the degradation of OFS when B. longum is absent.
Mice fed HFD display an increased gut permeability accompanied by metabolic endotoxemia 21. The latter has been proposed to emerge from the disruption of tight‐junction proteins, such as occludin and ZO1 11, 37. Independent of their colonization status obese C3H mice of the HFD‐group showed neither an altered gut barrier nor differences in the mRNA expression levels of Ocln, even though the supplementation of the HFD with OFS changed the composition of the SIHUMI consortium in favor of B. longum. Furthermore, excessive cytokine production has been proposed to disrupt tight‐junction proteins 50. In our experiments mRNA levels of the pro‐inflammatory cytokines Tnfa and Il1b or the LPS receptor Tlr4 were not affected by colonization status and/or diet in SIHUMI and SIHUMI‐Bif mice. The leakage of bacterial LPS from the gut lumen into the blood is a well‐established mechanism of metabolic endotoxemia 11, 37. However, our mice showed no signs of metabolic endotoxemia. This may be a consequence of the bacterial strains used in our gnotobiotic mouse model. Since a conventional intestinal microbiota is much more diverse, it is conceivable, that the presence of only two LPS‐containing Gram‐negative bacteria in the SIHUMI consortium, B. thetaiotaomicron and E. coli, was insufficient to induce metabolic endotoxemia. It may as well be possible, that specific bacteria are required for the induction of metabolic endotoxemia 51. Mono‐association of germfree mice with the gram negative Enterobacter cloacae, which was isolated from an obese human individual, induced obesity and elevated the systemic endotoxin concentration and inflammatory markers 51. However, diet‐induced obesity is not necessarily associated with impaired gut barrier integrity as recently demonstrated in three inbred mouse strains 52. C57BL/6J mice were fed the same lard‐based HFD used by Cani et al. 21, but did not reveal any gut‐barrier dysfunction. Hence, it may be speculated that the observed differences between the two studies are due to differences in microbiota composition between the animal facilities of the two laboratories 52. Interestingly, in humans, obesity, and the obesity‐associated microbiota are not associated with an increased gut permeability 53 suggesting a minor contribution of gut permeability to metabolic disease and endotoxemia.
Regardless of the limitations of the SIHUMI model, it allowed us to investigate the role of a representative bifidobacterial species in the attenuation of the development of diet‐induced obesity. By feeding LFD, HFD, and HFD + OFS to germfree mice and to mice associated with a defined bacterial consortium that included or excluded B. longum we were able to demonstrate that OFS leads to a reduction in weight gain and body fat content, and to an improved glucose tolerance and that these effects were independent of the presence of this Bifidobacterium. However, recent studies demonstrated that prebiotics counteract HFD‐induced disorders and increase the abundance of species such as Akkermansia muciniphila and Faecalibacterium prausnitzii 12, 54, 55, 56. These species were not investigated in our study, but it is conceivable that they mediate the beneficial effects of oligofructose in conventional C57BL/6J mice or in human subjects. Future gnotobiotic animal experiments could address this hypothesis. Nevertheless, OFS protected our germfree mice from HFD‐induced obesity and impaired glucose tolerance, leading to the assumption that OFS exerts beneficial effects independent from any species of the gut microbiota.
Diet plays an important role in the pathogenesis of the metabolic syndrome. Several human studies showed impressively that OFS improves various symptoms of the metabolic syndrome 55, 57, 58. Inulin and OFS enhance the formation of SCFA accompanied by reduced plasma lipid levels in both animals and humans 10, 17, 59, 60. The primary mechanism underlying the serum triglyceride‐lowering action of inulin‐type fructans involves a decreased expression and activity of hepatic lipogenic enzymes 61, 62. The authors speculate that fermentation of OFS to SCFA, in particular propionate, inhibits hepatic lipid synthesis. In agreement with these studies, we observed higher intestinal SCFA levels and lower hepatic triglyceride concentrations in SIHUMI and SIHUMI‐Bif mice fed HFD + OFS compared with mice fed HFD (Tables 1, 3). Even though statistical significance for the reduced liver fat was only reached for SIHUMI mice, the same tendency was observed in SIHUMI‐Bif mice suggesting that fructans exert a beneficial effect on lipid metabolism and that this effect is independent of the microbial status. However, propionate levels in SIHUMI mice fed HFD + OFS were not increased compared with SIHUMI mice fed HFD, indicating that at least in SIHUMI mice propionate was not responsible for the inhibition of hepatic lipid synthesis.
In conclusion, here we demonstrate in gnotobiotic C3H mice that OFS attenuates weight gain and body fat accumulation, and improves glucose tolerance, irrespective of the microbial status. Our results imply that the beneficial effects of OFS do not depend on the presence of a Bifidobacterium. Furthermore, neither the presence of B. longum nor the dietary supplementation with OFS affected gut permeability or metabolic endotoxemia in a gnotobiotic mouse model harboring a defined microbiota.
M.B., N.P., and S.K. designed the research; N.P., A.W., L.H., and G.L. conducted the research; A.W. and N.P. analyzed the data and drafted the manuscript. M.B., A.W., and N.P. had primary responsibility for the final content. All authors read and approved the final manuscript.
The authors have no conflicts of interest to disclose.
Supporting information
As a service to our authors and readers, this journal provides supporting information supplied by the authors. Such materials are peer reviewed and may be re‐organized for online delivery, but are not copy‐edited or typeset. Technical support issues arising from supporting information (other than missing files) should be addressed to the authors.
Supporting Inaformation
Acknowledgement
The authors thank Ines Grüner and Ute Lehmann for help with mouse husbandry and mating; Sabine Schmidt, Diana Schulze, Bärbel Gruhl, Sarah Schaan, Marion Urbich, and Antje Sylvester for excellent technical assistance. O.F.S. (P95) was kindly provided by Beneo Orafti; Mannheim, Germany. This work was supported by the German Institute of Human Nutrition, a member of the Leibniz Association.
5 References
- 1. World Health Organization . Obesity and overweight. Fact Sheet N°311 [updated August 2014; cited 8‐10‐14]. Available from: http://www.who.int/mediacentre/factsheets/fs311/en/.
- 2. Bleich, S. , Cutler, D. , Murray, C. , Adams, A. et al., Why is the developed world obese? Ann.Rev. Public Health 2008, 29, 273–295. [DOI] [PubMed] [Google Scholar]
- 3. Peeters, A. , Backholer, K. , Is the health burden associated with obesity changing? Am. J. Epidemiol. 2012, 176, 840–845. [DOI] [PubMed] [Google Scholar]
- 4. Wells, J. C. , The evolution of human adiposity and obesity: where did it all go wrong? Dis. Models Mech. 2012, 5, 595–607. [DOI] [PMC free article] [PubMed] [Google Scholar]
- 5. Ley, R. E. , Backhed, F. , Turnbaugh, P. , Lozupone, C. A. et al., Obesity alters gut microbial ecology. Proc. Natl. Acad. Sci. USA 2005, 102, 11070–11075. [DOI] [PMC free article] [PubMed] [Google Scholar]
- 6. Backhed, F. , Crawford, P. A. , O'Donnell, D. , Gordon, J. I. , et al., Postnatal lymphatic partitioning from the blood vasculature in the small intestine requires fasting‐induced adipose factor. Proc. Natl. Acad. Sci. USA 2007, 104, 606–611. [DOI] [PMC free article] [PubMed] [Google Scholar]
- 7. Backhed, F. , Ding, H. , Wang, T. , Hooper, L. V. et al., The gut microbiota as an environmental factor that regulates fat storage. Proc. Natl. Acad. Sci. USA 2004, 101, 15718–15723. [DOI] [PMC free article] [PubMed] [Google Scholar]
- 8. Munukka, E. , Wiklund, P. , Pekkala, S. , Volgyi, E. et al., Women with and without metabolic disorder differ in their gut microbiota composition. Obesity 2012, 20, 1082–1087. [DOI] [PubMed] [Google Scholar]
- 9. InterAct, C. , Dietary fibre and incidence of type 2 diabetes in eight European countries: the EPIC‐InterAct Study and a meta‐analysis of prospective studies. Diabetologia 2015, 58, 1394–1408. [DOI] [PMC free article] [PubMed] [Google Scholar]
- 10. Cani, P. D. , Neyrinck, A. M. , Fava, F. , Knauf, C. et al., Selective increases of bifidobacteria in gut microflora improve high‐fat‐diet‐induced diabetes in mice through a mechanism associated with endotoxaemia. Diabetologia 2007, 50, 2374–2383. [DOI] [PubMed] [Google Scholar]
- 11. Cani, P. D. , Possemiers, S. , Van de Wiele, T. , Guiot, Y. et al., Changes in gut microbiota control inflammation in obese mice through a mechanism involving GLP‐2‐driven improvement of gut permeability. Gut 2009, 58, 1091–1103. [DOI] [PMC free article] [PubMed] [Google Scholar]
- 12. Everard, A. , Lazarevic, V. , Derrien, M. , Girard, M. et al., Responses of gut microbiota and glucose and lipid metabolism to prebiotics in genetic obese and diet‐induced leptin‐resistant mice. Diabetes 2011, 60, 2775–2786. [DOI] [PMC free article] [PubMed] [Google Scholar]
- 13. Neyrinck, A. M. , Possemiers, S. , Druart, C. , Van de Wiele, T. et al., Prebiotic effects of wheat arabinoxylan related to the increase in bifidobacteria, Roseburia and Bacteroides/Prevotella in diet‐induced obese mice. PLoS One 2011, 6, e20944. [DOI] [PMC free article] [PubMed] [Google Scholar]
- 14. Neyrinck, A. M. , Van Hee, V. F. , Piront, N. , De Backer, F. et al., Wheat‐derived arabinoxylan oligosaccharides with prebiotic effect increase satietogenic gut peptides and reduce metabolic endotoxemia in diet‐induced obese mice. Nutr.Diabetes 2012, 2, e28. [DOI] [PMC free article] [PubMed] [Google Scholar]
- 15. Parnell, J. A. , Reimer, R. A. , Prebiotic fiber modulation of the gut microbiota improves risk factors for obesity and the metabolic syndrome. Gut Microbes 2012, 3, 29–34. [DOI] [PMC free article] [PubMed] [Google Scholar]
- 16. Parnell, J. A. , Reimer, R. A. , Prebiotic fibres dose‐dependently increase satiety hormones and alter Bacteroidetes and Firmicutes in lean and obese JCR:LA‐cp rats. Br. J. Nutr. 2012, 107, 601–613. [DOI] [PMC free article] [PubMed] [Google Scholar]
- 17. Anastasovska, J. , Arora, T. , Sanchez Canon, G. J. , Parkinson, J. R. et al., Fermentable carbohydrate alters hypothalamic neuronal activity and protects against the obesogenic environment. Obesity 2012, 20, 1016–1023. [DOI] [PubMed] [Google Scholar]
- 18. Collado, M. C. , Isolauri, E. , Laitinen, K. , Salminen, S. , Distinct composition of gut microbiota during pregnancy in overweight and normal‐weight women. Am. J. Clin. Nutr. 2008, 88, 894–899. [DOI] [PubMed] [Google Scholar]
- 19. Kalliomaki, M. , Collado, M. C. , Salminen, S. , Isolauri, E. , Early differences in fecal microbiota composition in children may predict overweight. Am. J. Clin. Nutr. 2008, 87, 534–538. [DOI] [PubMed] [Google Scholar]
- 20. Wu, X. , Ma, C. , Han, L. , Nawaz, M. et al., Molecular characterisation of the faecal microbiota in patients with type II diabetes. Curr. Microbiol. 2010, 61, 69–78. [DOI] [PubMed] [Google Scholar]
- 21. Cani, P. D. , Amar, J. , Iglesias, M. A. , Poggi, M. et al., Metabolic endotoxemia initiates obesity and insulin resistance. Diabetes 2007, 56, 1761–1772. [DOI] [PubMed] [Google Scholar]
- 22. Cani, P. D. , Knauf, C. , Iglesias, M. A. , Drucker, D. J. et al., Improvement of glucose tolerance and hepatic insulin sensitivity by oligofructose requires a functional glucagon‐like peptide 1 receptor. Diabetes 2006, 55, 1484–1490. [DOI] [PubMed] [Google Scholar]
- 23. Wang, Z. T. , Yao, Y. M. , Xiao, G. X. , Sheng, Z. Y. et al., Risk factors of development of gut‐derived bacterial translocation in thermally injured rats. World J. Gastroenterol. 2004, 10, 1619–1624. [DOI] [PMC free article] [PubMed] [Google Scholar]
- 24. Griffiths, E. A. , Duffy, L. C. , Schanbacher, F. L. , Qiao, H. et al., In vivo effects of bifidobacteria and lactoferrin on gut endotoxin concentration and mucosal immunity in Balb/c mice. Dig. Dis. Sci. 2004, 49, 579–589. [DOI] [PubMed] [Google Scholar]
- 25. Wang, Z. , Xiao, G. , Yao, Y. , Guo, S. et al., The role of bifidobacteria in gut barrier function after thermal injury in rats. J. Trauma 2006, 61, 650–657. [DOI] [PubMed] [Google Scholar]
- 26. Putaala, H. , Salusjarvi, T. , Nordstrom, M. , Saarinen, M. et al., Effect of four probiotic strains and Escherichia coli O157:H7 on tight junction integrity and cyclo‐oxygenase expression. Res. Microbiol. 2008, 159, 692–698. [DOI] [PubMed] [Google Scholar]
- 27. Becker, N. , Kunath, J. , Loh, G. , Blaut, M. et al., Human intestinal microbiota: characterization of a simplified and stable gnotobiotic rat model. Gut Microbes 2011, 2, 25–33. [DOI] [PubMed] [Google Scholar]
- 28. Woting, A. , Pfeiffer, N. , Loh, G. , Klaus, S. et al., Clostridium ramosum promotes high‐fat diet‐induced obesity in gnotobiotic mouse models. mBio 2014, 5, e01530–e01514. [DOI] [PMC free article] [PubMed] [Google Scholar]
- 29. Fleissner, C. K. , Huebel, N. , Abd El‐Bary, M. M. , Loh, G. et al., Absence of intestinal microbiota does not protect mice from diet‐induced obesity. Br. J. Nutr. 2010, 104, 919–929. [DOI] [PubMed] [Google Scholar]
- 30. Cani, P. D. , Bibiloni, R. , Knauf, C. , Waget, A. et al., Changes in gut microbiota control metabolic endotoxemia‐induced inflammation in high‐fat diet‐induced obesity and diabetes in mice. Diabetes 2008, 57, 1470–1481. [DOI] [PubMed] [Google Scholar]
- 31. Klaus, S. , Rudolph, B. , Dohrmann, C. , Wehr, R. et al., Expression of uncoupling protein 1 in skeletal muscle decreases muscle energy efficiency and affects thermoregulation and substrate oxidation. Physiol. Genomics 2005, 21, 193–200. [DOI] [PubMed] [Google Scholar]
- 32. Matsuki, T. , Watanabe, K. , Fujimoto, J. , Kado, Y. et al., Quantitative PCR with 16S rRNA‐gene‐targeted species‐specific primers for analysis of human intestinal bifidobacteria. Appl. Environ. Microbiol. 2004, 70, 167–173. [DOI] [PMC free article] [PubMed] [Google Scholar]
- 33. Junick, J. , Blaut, M. , Quantification of human fecal bifidobacterium species by use of quantitative real‐time PCR analysis targeting the groEL gene. Appl. Environ. Microbiol. 2012, 78, 2613–2622. [DOI] [PMC free article] [PubMed] [Google Scholar]
- 34. Slezak, K. , Hanske, L. , Loh, G. , Blaut, M. , Increased bacterial putrescine has no impact on gut morphology and physiology in gnotobiotic adolescent mice. Beneficial Microbes 2013, 4, 253–266. [DOI] [PubMed] [Google Scholar]
- 35. Weber, K. , Bolander, M. E. , Sarkar, G. , PIG‐B: a homemade monophasic cocktail for the extraction of RNA. Mol. Biotechnol. 1998, 9, 73–77. [DOI] [PubMed] [Google Scholar]
- 36. Pfaffl, M. W. , A new mathematical model for relative quantification in real‐time RT‐PCR. Nucleic Acids Res. 2001, 29, e45. [DOI] [PMC free article] [PubMed] [Google Scholar]
- 37. Brun, P. , Castagliuolo, I. , Di Leo, V. , Buda, A. et al., Increased intestinal permeability in obese mice: new evidence in the pathogenesis of nonalcoholic steatohepatitis. Am. J. Physiol. Gastrointest. Liver Physiol. 2007, 292, G518–G525. [DOI] [PubMed] [Google Scholar]
- 38. Maukonen, J. , Matto, J. , Suihko, M. L. , Saarela, M. et al., Intra‐individual diversity and similarity of salivary and faecal microbiota. J. Med. Microbiol. 2008, 57, 1560–1568. [DOI] [PubMed] [Google Scholar]
- 39. Zoetendal, E. G. , von Wright, A. , Vilpponen‐Salmela, T. , Ben‐Amor, K. et al., Mucosa‐associated bacteria in the human gastrointestinal tract are uniformly distributed along the colon and differ from the community recovered from feces. Appl. Environ. Microbiol. 2002, 68, 3401–3407. [DOI] [PMC free article] [PubMed] [Google Scholar]
- 40. McCracken, V. J. , Simpson, J. M. , Mackie, R. I. , Gaskins, H. R. et al., Molecular ecological analysis of dietary and antibiotic‐induced alterations of the mouse intestinal microbiota. J. Nutr. 2001, 131, 1862–1870. [DOI] [PubMed] [Google Scholar]
- 41. Fushuku, S. , Fukuda, K. , Gender difference in the composition of fecal flora in laboratory mice, as detected by denaturing gradient gel electrophoresis (DGGE). Exp. Anim. 2008, 57, 489–493. [DOI] [PubMed] [Google Scholar]
- 42. Friswell, M. K. , Gika, H. , Stratford, I. J. , Theodoridis, G. et al., Site and strain‐specific variation in gut microbiota profiles and metabolism in experimental mice. PLoS One 2010, 5, e8584. [DOI] [PMC free article] [PubMed] [Google Scholar]
- 43. Loh, G. , Brodziak, F. , Blaut, M. , The Toll‐like receptors TLR2 and TLR4 do not affect the intestinal microbiota composition in mice. Environ. Microbiol. 2008, 10, 709–715. [DOI] [PubMed] [Google Scholar]
- 44. Nishikawa, S. , Yasoshima, A. , Doi, K. , Nakayama, H. et al., Involvement of sex, strain and age factors in high fat diet‐induced obesity in C57BL/6J and BALB/cA mice. Exp. Anim. 2007, 56, 263–272. [DOI] [PubMed] [Google Scholar]
- 45. Montgomery, M. K. , Hallahan, N. L. , Brown, S. H. , Liu, M. et al., Mouse strain‐dependent variation in obesity and glucose homeostasis in response to high‐fat feeding. Diabetologia 2013, 56, 1129–1139. [DOI] [PubMed] [Google Scholar]
- 46. Parks, B. W. , Nam, E. , Org, E. , Kostem, E. et al., Genetic control of obesity and gut microbiota composition in response to high‐fat, high‐sucrose diet in mice. Cell Metab. 2013, 17, 141–152. [DOI] [PMC free article] [PubMed] [Google Scholar]
- 47. Falony, G. , Calmeyn, T. , Leroy, F. , De Vuyst, L. et al., Coculture fermentations of Bifidobacterium species and Bacteroides thetaiotaomicron reveal a mechanistic insight into the prebiotic effect of inulin‐type fructans. Appl. Environ. Microbiol. 2009, 75, 2312–2319. [DOI] [PMC free article] [PubMed] [Google Scholar]
- 48. Falony, G. , Verschaeren, A. , De Bruycker, F. , De Preter, V. et al., In vitro kinetics of prebiotic inulin‐type fructan fermentation by butyrate‐producing colon bacteria: implementation of online gas chromatography for quantitative analysis of carbon dioxide and hydrogen gas production. Appl. Environ. Microbiol. 2009, 75, 5884–5892. [DOI] [PMC free article] [PubMed] [Google Scholar]
- 49. Falony, G. , Vlachou, A. , Verbrugghe, K. , De Vuyst, L. , et al., Cross‐feeding between Bifidobacterium longum BB536 and acetate‐converting, butyrate‐producing colon bacteria during growth on oligofructose. Appl. Environ. Microbiol. 2006, 72, 7835–7841. [DOI] [PMC free article] [PubMed] [Google Scholar]
- 50. Mazzon, E. , Cuzzocrea, S. , Role of TNF‐alpha in ileum tight junction alteration in mouse model of restraint stress. Am. J. Physiol. Gastrointest. Liver. Physiol. 2008, 294, G1268–G1280. [DOI] [PubMed] [Google Scholar]
- 51. Fei, N. , Zhao, L. , An opportunistic pathogen isolated from the gut of an obese human causes obesity in germfree mice. ISME J. 2013, 7, 880–884. [DOI] [PMC free article] [PubMed] [Google Scholar]
- 52. Kless, C. , Muller, V. M. , Schuppel, V. L. , Lichtenegger, M. et al., Diet‐induced obesity causes metabolic impairment independent of alterations in gut barrier integrity. Mol. Nutr. Food Res. 2015, 59, 968–978. [DOI] [PubMed] [Google Scholar]
- 53. Verdam, F. J. , Fuentes, S. , de Jonge, C. , Zoetendal, E. G. et al., Human intestinal microbiota composition is associated with local and systemic inflammation in obesity. Obesity 2013, 21, E607–E615. [DOI] [PubMed] [Google Scholar]
- 54. Everard, A. , Lazarevic, V. , Gaia, N. , Johansson, M. et al., Microbiome of prebiotic‐treated mice reveals novel targets involved in host response during obesity. ISME J. 2014, 8, 2116–2130. [DOI] [PMC free article] [PubMed] [Google Scholar]
- 55. Dewulf, E. M. , Cani, P. D. , Claus, S. P. , Fuentes, S. et al., Insight into the prebiotic concept: lessons from an exploratory, double blind intervention study with inulin‐type fructans in obese women. Gut 2013, 62, 1112–1121. [DOI] [PMC free article] [PubMed] [Google Scholar]
- 56. Ramirez‐Farias, C. , Slezak, K. , Fuller, Z. , Duncan, A. et al., Effect of inulin on the human gut microbiota: stimulation of Bifidobacterium adolescentis and Faecalibacterium prausnitzii . Br. J. Nutr. 2009, 101, 541–550. [DOI] [PubMed] [Google Scholar]
- 57. Antal, M. , Regoly‐Merei, A. , Biro, L. , Arato, G. et al., Effects of oligofructose containing diet in obese persons. Orvosi. Hetilap. 2008, 149, 1989–1995. [DOI] [PubMed] [Google Scholar]
- 58. Parnell, J. A. , Reimer, R. A. , Weight loss during oligofructose supplementation is associated with decreased ghrelin and increased peptide YY in overweight and obese adults. Am. J. Clin. Nutr. 2009, 89, 1751–1759. [DOI] [PMC free article] [PubMed] [Google Scholar]
- 59. Jackson, K. G. , Taylor, G. R. , Clohessy, A. M. , Williams, C. M. et al., The effect of the daily intake of inulin on fasting lipid, insulin and glucose concentrations in middle‐aged men and women. Br. J. Nutr. 1999, 82, 23–30. [DOI] [PubMed] [Google Scholar]
- 60. Balcazar‐Munoz, B. R. , Martinez‐Abundis, E. , Gonzalez‐Ortiz, M. , Effect of oral inulin administration on lipid profile and insulin sensitivity in subjects with obesity and dyslipidemia. Revista Med. de Chile 2003, 131, 597–604. [PubMed] [Google Scholar]
- 61. Delzenne, N. M. , Kok, N. , Effects of fructans‐type prebiotics on lipid metabolism. Am. J. Clin. Nutr. 2001, 73, 456S–458S. [DOI] [PubMed] [Google Scholar]
- 62. Kok, N. , Roberfroid, M. , Robert, A. , Delzenne, N. et al., Involvement of lipogenesis in the lower VLDL secretion induced by oligofructose in rats. Br. J. Nutr. 1996, 76, 881–890. [DOI] [PubMed] [Google Scholar]
Associated Data
This section collects any data citations, data availability statements, or supplementary materials included in this article.
Supplementary Materials
As a service to our authors and readers, this journal provides supporting information supplied by the authors. Such materials are peer reviewed and may be re‐organized for online delivery, but are not copy‐edited or typeset. Technical support issues arising from supporting information (other than missing files) should be addressed to the authors.
Supporting Inaformation