Abstract
Ceftolozane/tazobactam is an antipseudomonal antibacterial approved for the treatment of complicated urinary tract infections (cUTIs) and complicated intra‐abdominal infections (cIAIs) and in phase 3 clinical development for treatment of nosocomial pneumonia. A population pharmacokinetic (PK) model with the plasma‐to‐epithelial lining fluid (ELF) kinetics of ceftolozane/tazobactam was used to justify dosing regimens for patients with nosocomial pneumonia in phase 3 studies. Monte Carlo simulations were performed to determine ceftolozane/tazobactam dosing regimens with a >90% probability of target attainment (PTA) for a range of pharmacokinetic/pharmacodynamic targets at relevant minimum inhibitory concentrations (MICs) for key pathogens in nosocomial pneumonia. With a plasma‐to‐ELF penetration ratio of approximately 50%, as observed from an ELF PK study, a doubling of the current dose regimens for different renal functions that are approved for cUTIs and cIAIs is needed to achieve >90% PTA for nosocomial pneumonia. For example, a 3‐g dose of ceftolozane/tazobactam for nosocomial pneumonia patients with normal renal function is needed to achieve a >90% PTA (actual 98%) for the 1‐log kill target against pathogens with an MIC of ≤8 mg/L in ELF, compared with the 1.5‐g dose approved for cIAIs and cUTIs.
Keywords: ceftolozane/tazobactam, epithelial lining fluid, nosocomial pneumonia, Pseudomonas aeruginosa, probability of target attainment, dose justification
Nosocomial pneumonia is one of the most common hospital‐acquired infections, can be life‐threatening, and often occurs in critically ill mechanically ventilated patients.1 Gram‐negative bacteria commonly implicated in cases of nosocomial pneumonia, most notably Pseudomonas aeruginosa, Enterobacteriaceae, and Acinetobacter baumannii,2 are often resistant to antibacterials, and empirical therapy for these infections is becoming increasingly difficult. The choice of appropriate empiric antibiotic therapy for nosocomial pneumonia is typically based on local resistance epidemiology data and the presence of risk factors for infection with a drug‐resistant pathogen.1 The dose used is often based on the pharmacokinetics (PK) and pharmacodynamics (PD) of the antibiotic therapy, including concentrations at the site of infection.1, 3
Ceftolozane/tazobactam has been approved for the treatment of complicated urinary tract infections (cUTIs) and complicated intra‐abdominal infections (cIAIs)4 and is being developed for the treatment of nosocomial pneumonia. Ceftolozane/tazobactam is a novel antibacterial with potent bactericidal activity against clinically relevant gram‐negative pathogens, including most extended‐spectrum β‐lactamase (ESBL)–producing Enterobacteriaceae as well as multidrug‐resistant strains of P. aeruginosa. In large‐scale surveillance studies in the US and European medical centers, ceftolozane/tazobactam has shown potent in vitro activity against gram‐negative pathogens, including isolates from patients with pneumonia and P. aeruginosa strains resistant to currently available cephalosporins, carbapenems, and piperacillin/tazobactam.5 In common with other β‐lactams, the PK/PD index of ceftolozane that best correlates with in vivo efficacy is the percentage of the dosing interval that the free concentration of ceftolozane in plasma exceeds the minimum inhibitory concentration (%fT>MIC); and the median %fT>MIC required for ceftolozane to achieve bacteriostasis and 1‐log kill against gram‐negative bacilli in the mouse thigh model is 24.8% and 32.2%, respectively, comparable to carbapenems.6, 7 An alternative target of about 40% fT>MIC was also reported for 1‐ and 2‐log kill against drug‐resistant P. aeruginosa.8 In a study in healthy volunteers, ceftolozane/tazobactam (1.5 g administered as 1000 mg ceftolozane and 500 mg tazobactam intravenously every 8 hours) was shown to penetrate into lung epithelial lining fluid (ELF, considered the site of infection in patients with nosocomial pneumonia), and ELF concentrations over the dosing interval exceeded the MICs of the majority of common gram‐negative pathogens.9
Monte Carlo simulations are often used to determine appropriate dosing regimens for clinical studies of new antibiotic therapies.10 By incorporating known PK data, the distribution of MICs against target pathogens, and the PK/PD target for the antibiotic therapy, these simulations can provide a robust dosing strategy for the antibiotic therapy. The approved clinical dose of ceftolozane/tazobactam in patients with cUTIs and cIAIs with normal renal function is 1.5 g as a 60‐minute intravenous infusion every 8 hours, which achieves high probability of target attainment (PTA) against pathogens with an MIC of up to 8 mg/L in plasma.4, 11 This dose was confirmed to be efficacious and well tolerated in clinical trials of ceftolozane/tazobactam in patients with cUTIs and cIAIs.12, 13, 14 Although no exposure–response analyses correlating clinical outcome and concentration at the site of infection (ie, the ELF) in patients with nosocomial pneumonia are currently available, achieving sufficiently high concentrations in ELF is considered a prerequisite for dose selection in patients with nosocomial pneumonia.15
This analysis aimed to first characterize the PK of ceftolozane and tazobactam in both the ELF and plasma, including the kinetics of the plasma‐to‐ELF penetration and its variability, using a population modeling approach based on an ELF PK study in 25 healthy volunteers. The obtained ceftolozane and tazobactam penetration kinetics were then combined with a population PK model for patients with cIAIs to enable Monte Carlo simulations to predict the PTA in both ELF and plasma in patients with different scenarios. The objective of these analyses was to determine a dose of ceftolozane/tazobactam to support a phase 3 study in patients with nosocomial pneumonia (NCT02070757).
Methods
Plasma‐to‐ELF Penetration Kinetics
Details of the clinical study conducted to evaluate the penetration of ceftolozane/tazobactam from plasma to the ELF in healthy subjects have been published previously.9 An institutional review board approved the study protocol, and all subjects provided written informed consent. In brief, ceftolozane and tazobactam concentrations in plasma and bronchoalveolar lavage samples were measured at different times from 0 to 8 hours in 25 healthy subjects (14 men and 11 women; median [min, max] age, 31 [21, 47] years; body weight, 78 [56.5, 94.5] kg; and creatinine clearance [CrCL], 119 [77.7, 155.2] mL/min).
Ceftolozane and tazobactam concentration–time data in both plasma and ELF from this study were integrated to develop a population PK model for each drug, using a nonlinear mixed‐effects model (NONMEM) approach (NONMEM software package, version 7.2; Icon Development Solutions, Ellicott City, Maryland). The PK model for ceftolozane and tazobactam in plasma alone has been described previously,16 and the model structure was used here for plasma but added a new compartment for ELF. Different 2‐ compartment and 3‐compartment model structures were also tested to ascertain the best fit with both the plasma and ELF data. Models were selected based on the quality of fit, as well as the stability, reliability, and interpretability of the models. The plasma‐to‐ELF penetration ratio (PR) was defined by the parameters of the PK model (Qce/Qec, see below) for ceftolozane and tazobactam, respectively. Model‐estimated PRs for ceftolozane and tazobactam were compared with observed PR values (AUCELF/AUCplasma) that were calculated from the observed AUC values using the composite ELF concentration–time profiles via noncompartmental methods (Phoenix WinNonlin v 6.1; Pharsight Corp, Mountain View, California), as described previously.9
Monte Carlo Simulations
The PK model used for Monte Carlo simulation included 2 parts, one for plasma PK and the other for plasma‐to‐ELF penetration kinetics (or ELF PK). The plasma PK was developed with the plasma data from 8 phase 1 studies and 2 phase 2 studies in cUTI and cIAI patients.16 However, the PK parameter values describing patients with cIAIs were used for simulation of plasma concentrations in this analysis because of the observed larger interindividual variability and higher clearance and volume of distribution in patients with cIAIs,16 representing a conservative approach in simulations for exposure projection to achieve the target attainment in patients with nosocomial pneumonia. The plasma‐to‐ELF penetration kinetics, as described above, were developed from healthy subjects and assumed to be independent of the plasma PK. Thus, the PK model used for simulation is a mixed PK model that is a combination of the plasma PK for cIAI patients and the plasma‐to‐ELF penetration kinetics for healthy subjects. The individual ceftolozane or tazobactam concentration–time profiles in both plasma and ELF were simulated for different dosing regimens, including the 1.5‐ and 3‐g ceftolozane/tazobactam doses through a 60‐ minute intravenous infusion every 8 hours for patients with normal renal function. The scenario for patients with normal renal function (CrCL uniformly distributed within the range of 90 to 150 mL/min) is reported in detail as a representative example. Body weight was sampled from a normal distribution with a mean (standard error) of 74 (0.205) kg, which was representative of patients included in the phase 1 and 2 clinical trials. In a sensitivity analysis, the interindividual variability for the PK parameters was further increased up to 50% coefficient of variation (CV) to account for additional variability that might be seen in patients with nosocomial pneumonia and/or in a larger population size than that included for development of the PK models. SAS software version 9.3 (SAS Institute Inc., Cary, North Carolina) plus the finite element method for mass balance differential equations at a time step of 0.001 hours were used to simulate the concentration–time profiles in 1000 patients for each case.
Target Attainment in Nosocomial Pneumonia
Based on the simulated concentration–time profiles of ceftolozane and tazobactam in plasma and ELF as described above, the PTA values were calculated separately for ceftolozane and tazobactam in both plasma and ELF for different dosing regimens (eg, 1.5 and 3 g ceftolozane/tazobactam, both as a 60‐minute intravenous infusion every 8 hours) for a range of MICs and PK/PD targets. The type and MIC distributions of pathogens were based on the data in patients hospitalized with pneumonia from the Program to Assess Ceftolozane/Tazobactam Susceptibility (PACTS) carried out in 2012 in the United States and the European Union.5 An unbound fraction of 0.79 was used for ceftolozane to calculate the %fT>MIC (Merck and Co.; data on file). The MICs of ceftolozane/tazobactam were determined in the presence of 4 mg/L of tazobactam, as recommended by the Clinical and Laboratory Standards Institute,17 with target attainment determined for the ceftolozane component alone. The in vivo animal‐derived targets for bacteriostasis and 1‐log kill of 24.8% and 32.2% fT>MIC, respectively, were used.6 Targets of 40% and 50% fT>MIC associated with greater killing effect were also examined.8 The goal was to determine the dosing regimen that achieved a PTA ≥ 90% for the 1‐log kill target. Target attainment for tazobactam was based on the minimum efficacious concentration (MEC), which is the threshold drug concentration needed to effectively neutralize the β‐lactamase enzymes produced by bacteria. The percentage of the dosing interval that the tazobactam concentration remains above a threshold (%fT>MEC) has been previously identified as the PK/PD exposure index that is most closely associated with efficacy in combination with ceftolozane.18, 19 In the simulation for tazobactam, an unbound fraction of 0.70 was used to calculate %fT>MEC.
Results
Plasma‐to‐ELF Kinetics
Ceftolozane and tazobactam concentration–time data from 150 plasma and 25 ELF samples obtained from 25 healthy subjects were included in the plasma‐ELF PK model. The observed concentration–time profiles following 3 doses (8 hours apart) of 1.5 g ceftolozane/tazobactam as a 60‐minute intravenous infusion are illustrated in Figure 1. The peak concentrations (at the end of the 60‐minute infusion) in ELF were approximately half those in plasma, whereas the trough concentrations (8 hours after the last dose) in ELF were similar to those in plasma. The apparent terminal half‐life for tazobactam was consistently shorter in both plasma and ELF compared with the apparent terminal half‐life of ceftolozane.
Figure 1.
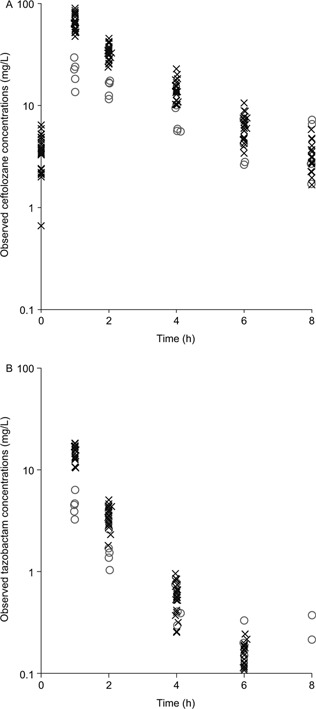
Observed individual ceftolozane (A) and tazobactam (B) concentrations in plasma (×) and ELF (о) in 25 healthy subjects following the third dose of 1.5 g ceftolozane/tazobactam administered as a 60‐minute intravenous infusion every 8 hours.
The same 3‐compartment disposition model structure was the best for both ceftolozane and tazobactam to fit the concentration data in both plasma and ELF, as illustrated in Figure 2, which can be described with the following mass balance differential equations:
where Xc, X2, and Xe represent the amount of the drug at time t in the central compartment, peripheral compartment, and ELF compartment, respectively; Rt represents the infusion rate at time t; CL, Q2, Qce, and Qec represent the terminal clearance, clearance between the central and peripheral compartments, clearance from the central compartment to ELF, and clearance from ELF to the central compartment, respectively; and Vc, V2, and Ve (fixed as 1) represent the volume of distribution for the central, peripheral, and ELF compartments, respectively. Based on this model structure, the parametric plasma‐to‐ELF penetration ratio is defined as PR = Qce/Qec. The model fit the concentration data very well, as illustrated in Figure 3. The parameter estimates were reliable, as demonstrated by the relatively small standard errors (CV of less than 50%) for the models for both ceftolozane and tazobactam, as listed in Table 1. In addition, in the model for tazobactam, CrCL and body weight were identified as significant covariates of clearance and volume of distribution, respectively, based on a P value of .001 and the improvement in the quality of fit. However, no significant covariate effect was identified for ceftolozane PK in this small population size.
Figure 2.
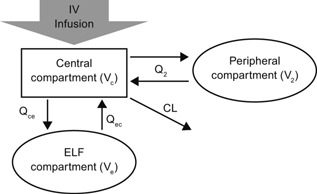
Ceftolozane/tazobactam plasma‐ELF PK model structure.
Figure 3.
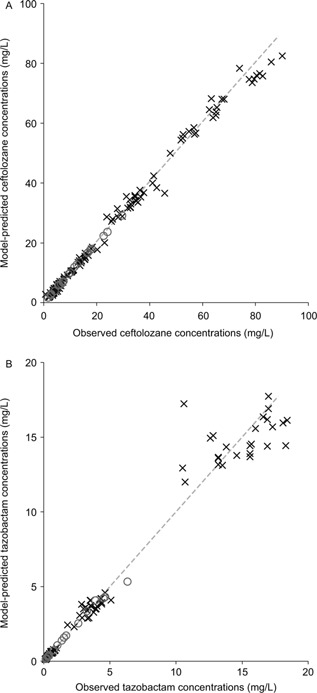
Fit of the PK model to the observed concentrations in both plasma (×) and ELF (о) for ceftolozane (A) and tazobactam (B); the dashed line represents unity.
Table 1.
Parameter Estimates for the Plasma‐ELF PK Population Model for Ceftolozane and Tazobactam in Healthy Volunteers
| Parameters for Ceftolozane | Mean | SE | 95%CI |
|---|---|---|---|
| CL, L/h | 6.3 | 0.187 | 5.93–6.66 |
| Vc, L | 10.3 | 0.57 | 9.21–11.4 |
| Qce, L/h | 0.85 | 0.362 | 0.141–1.56 |
| Qec, L/h | 1.66 | 0.677 | 0.335–2.99 |
| Q2, L/h | 3.39 | 0.711 | 1.99–4.78 |
| V2, L | 3.76 | 0.392 | 2.99–4.53 |
| Variance of RVP | 0.00603 | 0.00238 | 0.00136–0.0107 |
| Variance of RVA | 0.297 | 0.139 | 0.0246–0.570 |
| Variance of IIV on CL | 0.0179 | 0.00529 | 0.00750–0.0282 |
| Variance of IIV on Vc | 0.0498 | 0.0174 | 0.0156–0.0840 |
| Variance of IIV on Qce | 0.174 | 0.0454 | 0.0849–0.263 |
| Parameters for Tazobactam | Mean | SE | 95%CI |
|---|---|---|---|
| CL, L/h | 24.5 | 0.578 | 23.4–25.6 |
| Vc, L, at 70‐kg body weight | 15.0 | 0.557 | 13.9–16.1 |
| Qce, L/h | 0.792 | 0.14 | 0.518–1.07 |
| Qec, L/h | 1.72 | 0.339 | 1.06–2.38 |
| Q2, L/h | 3.91 | 0.823 | 2.3–5.52 |
| V2, L | 4.42 | 0.483 | 3.47–5.37 |
| Exponent of (CrCL/119) on CL | 0.438 | 0.112 | 0.218–0.658 |
| Variance of IIV on CL | 0.00412 | 0.00228 | 0–0.00859 |
| Variance of IIV on Qec | 0.229 | 0.0689 | 0.094–0.364 |
| Variance of RVP | 0.0233 | 0.00404 | 0.0154–0.0312 |
CI, confidence interval; IIV, interindividual variability; RVA, additive residual variability; RVP, proportional residual variability; SE, standard error.
The model‐estimated typical parametric PR for ceftolozane was 0.51, with a potential interindividual variability of 42% CV. The 5th, 25th, 75th, and 95th percentiles of the estimated PR distribution were 0.26, 0.39, 0.69, and 1.02, respectively. This was consistent with the observed values calculated from the AUCELF/AUCplasma based on the Bayesian estimates for the 25 subjects for whom the geometric mean (95% confidence interval [CI]) of the individual plasma‐to‐ELF PRs was 0.52 (0.44–0.60), with a median (min, max) of 0.53 (0.26, 1.30). Similarly, the model‐estimated typical parametric PR for tazobactam was 0.46, with a potential interindividual variability of 48% CV. The 5th, 25th, 75th, and 95th percentiles of the estimated PR distribution were 0.21, 0.33, 0.64, and 1.02, respectively. This was also consistent with the observed values calculated from the AUCELF/AUCplasma based on the Bayesian estimates for the 25 subjects for whom the geometric mean (95%CI) of the individual plasma‐to‐ELF PRs was 0.50 (0.41–0.59), with a median (min, max) of 0.42 (0.22, 1.22). Furthermore, the model‐ estimated parametric PR values were also consistent with the observed PR values calculated from the AUCELF/AUCplasma based on the composite mean measurements, approximately 48% and 44% for ceftolozane and tazobactam, respectively.9
The final PK model used in the Monte Carlo simulation was combined from the above plasma‐ELF penetration kinetics (Qec and Qce) and the population plasma PK for cIAI patients and can be described as follows for ceftolozane:
where CrCL represents renal clearance in millimeters per minute, WT represents body weight in kilograms, exp[] is an exponential function, and N(0, var) represents an interindividual variability of a normal distribution centering at 0 with a variance of var.
Target Attainment
Figure 4 illustrates the Monte Carlo–simulated ceftolozane and tazobactam concentration–time profiles in plasma and ELF at steady state following administration of the 3‐g ceftolozane/tazobactam dose as a 60‐minute intravenous infusion every 8 hours. As illustrated in Figures 5 and 6, the PTA for ceftolozane was consistently higher for all the %fT>MIC targets with the 3‐g dose relative to the 1.5‐g dose at the targeted MIC of 8 mg/L in ELF for nosocomial pneumonia. Of note, the PTA for ceftolozane was 98.4% against pathogens with an MIC up to 8 mg/L in ELF and 97.1% against pathogens with an MIC up to 16 mg/L in plasma for the 1‐log kill target with the 3‐g ceftolozane/tazobactam dose (Figure 5), and the PTA was 95.6% for the 40% fT>MIC target up to 8 mg/L in ELF. Comparatively, at the 1.5‐g dose, the PTA for 1‐log kill was approximately 85% and 74% for pathogens with an MIC up to 8 mg/L in ELF or 16 mg/L in plasma, respectively (Figure 6), whereas the PTA was approximately 75% for the 40% fT>MIC target up to 8 mg/L in ELF. Even when using the target of 50% fT>MIC for the 3‐g ceftolozane/tazobactam dose, the PTA reached 87.7% against pathogens with an MIC up to 8 mg/L in ELF. The 1.5‐g dose of ceftolozane/tazobactam, however, achieved only 59% PTA for pathogens with an MIC up to 8 mg/L in ELF for nosocomial pneumonia. In contrast, the PTA for tazobactam was comparable for all targets in plasma and ELF at the same dose level of 3 g ceftolozane/tazobactam, as illustrated in Figure 7.
Figure 4.
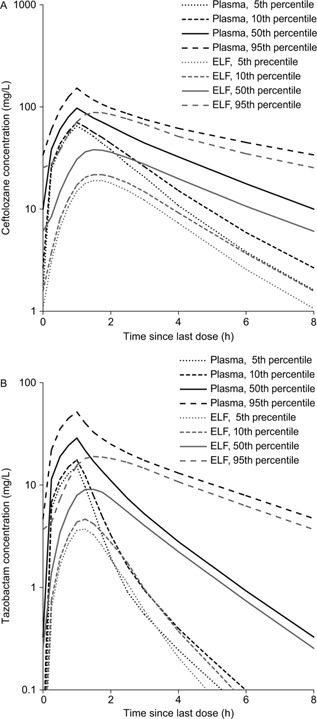
Simulated ceftolozane (A) and tazobactam (B) steady‐state concentration–time profiles in plasma and ELF in nosocomial pneumonia patients with normal renal function following 3 g ceftolozane/tazobactam administered as a 60‐minute intravenous infusion every 8 hours.
Figure 5.
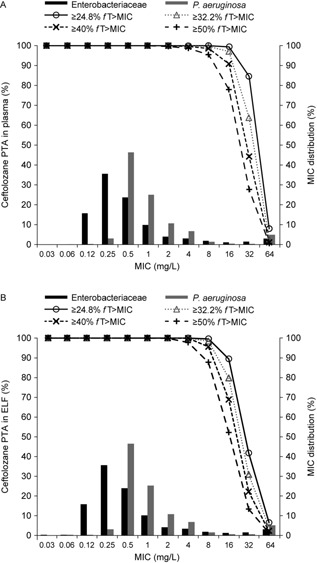
MIC distribution of Enterobacteriaceae and P. aeruginosa isolates from hospitalized patients with pneumonia from 2012 US/European Union surveillance data7 and simulated PTA of ceftolozane in plasma (A) and ELF (B) in patients with normal renal function following 3 g ceftolozane/tazobactam administered as a 60‐minute intravenous infusion every 8 hours.
Figure 6.
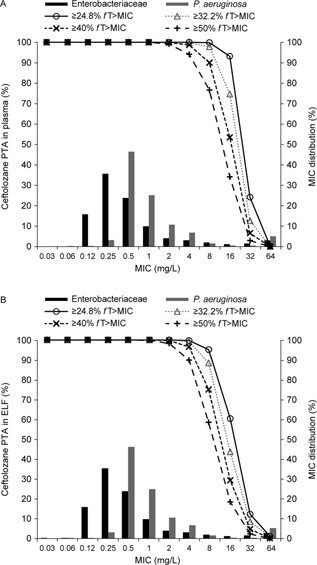
MIC distribution of Enterobacteriaceae and P. aeruginosa isolates from hospitalized patients with pneumonia from 2012 US/European Union surveillance data7 and simulated PTA of ceftolozane in plasma (A) and ELF (B) in patients with normal renal function following 1.5 g ceftolozane/tazobactam administered as a 60‐minute intravenous infusion every 8 hours.
Figure 7.
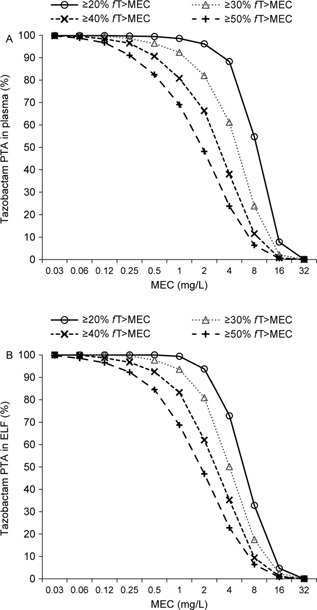
Simulated PTA of tazobactam in plasma (A) and ELF (B) in patients with normal renal function following 3 g ceftolozane/tazobactam administered as a 60‐minute intravenous infusion every 8 hours.
The sensitivity analysis, with an inflated interindividual variability up to 50% CV for the parameters of the plasma‐ELF PK model, also suggested ≥90% PTA for ceftolozane for the same targets with the 3‐g ceftolozane/tazobactam dose. Conversely, a larger decrease in PTA for ceftolozane was seen in the ELF for the same 1‐log kill target at the 1.5‐g ceftolozane/tazobactam dose (72% against pathogens with an MIC up to 8 mg/L in ELF), although the PTA was still ≥90% in plasma against pathogens with an MIC up to 8 mg/L.
On the basis of the 2012 US/European Union PACTS surveillance data5 selected from hospitalized patients with pneumonia, the most commonly isolated pathogens of interest were Enterobacteriaceae (n = 1530; 51.5%) and P. aeruginosa (n = 1019; 34.3%). The MIC distributions for these pathogens are illustrated in Figures 5 and 6. The ceftolozane/tazobactam MIC50 and MIC90 against Enterobacteriaceae were 0.25 and 4 mg/L, respectively, and against P. aeruginosa were 0.5 and 4 mg/L, respectively. The estimated cumulative fraction of response for 1‐log kill for the 3 g dose in ELF was approximately 96% and 95% against Enterobacteriaceae and P. aeruginosa, respectively, and in plasma was approximately 97% and 95%, respectively.
Similar to patients with normal renal function (CrCL in 90–150 mL/min), a doubling of the approved dose for cIAIs in the patients with renal impairment is also needed for nosocomial pneumonia to achieve a high (>90%) PTA for the 1‐log kill target for MIC values up to 8 mg/L in ELF. For example, for the same target of 1‐log kill at an MIC up to 8 mg/L in ELF, the simulated PTA was 98.8% at the 1.5‐g ceftolozane/tazobactam dose in patients with moderate renal impairment (CrCL of 30–50 mL/min) or 94.4% at the 750‐mg ceftolozane/tazobactam dose in patients with severe renal impairment (CrCL of 15–30 mL/min). For the 40% fT>MIC target at an MIC of up to 8 mg/L, the corresponding PTA values were 97.5% and 92.6%, respectively.
Discussion
In severe infections, such as nosocomial pneumonia, the selection of appropriate empiric antibiotic therapy is associated with improved clinical outcomes20, 21, 22, 23 and comprises 2 main components. First, the empiric therapy chosen must provide microbiological activity against the most commonly encountered pathogens that are typically associated with poor outcomes, which often includes P. aeruginosa. Second, PK/PD principles should be used to choose an antibiotic regimen that has the greatest chance of achieving the PD target associated with antibacterial activity at the most likely site of the infection (ie, the ELF, in the case of nosocomial pneumonia).9 Appropriate antibiotic therapy should involve optimizing the dosing regimen to provide the highest chance of clinical success in treating patients with nosocomial pneumonia.1, 3
In addition to the likely pathogen and its susceptibility profile, PK parameters such as lung penetration, protein binding, and changes in drug volume of distribution and clearance can significantly influence the antibiotic concentrations achieved at the site of infection and therefore the probability of microbiological success.3 In healthy volunteers, ceftolozane/tazobactam exposure increases in proportion to dose, with an apparent terminal elimination half‐life of approximately 2.5 hours for ceftolozane and 1 hour for tazobactam and no meaningful accumulation following multiple intravenous infusions of up to 3.0 g administered every 8 hours for up to 10 days.24 Both ceftolozane and tazobactam exhibit low protein binding (approximately 16% to 21% for ceftolozane and 30% for tazobactam; data on file, Merck and Co.), which is a potential advantage in the treatment of nosocomial pneumonia, as it is the free (or non‐protein‐bound) fraction of the drug that is able to distribute into tissues,3 as demonstrated by the good penetration ratios of 51% for ceftolozane and 46% for tazobactam.
Traditionally, relating plasma concentrations to the MIC value has been used to predict efficacy and guide dosing selection.25 In nosocomial pneumonia, dosing regimens may need to be modified to achieve reliable clinical success because some β‐lactams, including ceftolozane/tazobactam, have lower concentrations at the site of infection (ie, the ELF) than in plasma.9, 26 For this simulation, the PK/PD target of interest for ceftolozane/tazobactam was the 1‐log kill target of 32.2% fT>MIC. In addition, higher targets of 40% and 50% fT>MIC associated with greater killing were evaluated, as some studies suggested higher %fT>MIC may be needed for clinical success in patients with pneumonia relative to what was seen in mouse models of infection.10, 27 Our results showed that for the 1‐log kill target, a 3‐g dose of ceftolozane/tazobactam infused over 60 minutes every 8 hours achieved >98% PTA for ceftolozane in ELF against pathogens with an MIC up to 8 mg/L and >97% in plasma against pathogens with an MIC up to 16 mg/L. Even for the target of 50% fT>MIC, the PTA at an MIC of 8 mg/L remained approximately 88% in ELF and >95% in plasma. Furthermore, despite artificially increasing interindividual variability up to 50% CV for all PK parameters as a sensitivity analysis, the 3‐g dose of ceftolozane/tazobactam still maintained high PTA for ceftolozane. In comparison, the PTA for ceftolozane in the ELF was slightly less than optimal (88%) with the 1.5‐g dose of ceftolozane/tazobactam for the 1‐log kill target, and even greater declines were seen when either the target was increased to 50% fT>MIC (59%) or the interindividual variability was increased up to 50% CV for all PK parameters (79%) in nosocomial pneumonia. Therefore, the 3‐g dose of ceftolozane/tazobactam was considered the appropriate dose to be evaluated in patients with nosocomial pneumonia and normal renal function, which is double the dose that is approved for use in patients with cUTIs and cIAIs.4
To ascertain the PTA for tazobactam, the MEC, rather than the MIC, was used. As tazobactam lacks intrinsic antibacterial activity on its own, it is not possible to calculate the MIC; instead, as with other β‐lactamase inhibitors, a threshold concentration is needed to effectively neutralize the β‐lactamase enzyme produced by bacteria and to recover the antibacterial activity of the partner drug (ie, the β‐lactam).18, 19 The MEC coverage achieved in plasma with the current dose of 1.5 g for treatment of cUTIs and cIAIs was confirmed to be sufficient against ESBL‐producing pathogens in the ceftolozane/tazobactam clinical trial programs.12, 13, 14 Thus, the objective of this analysis on tazobactam was to demonstrate that the target attainment in ELF of the 3‐g dose of ceftolozane/tazobactam in nosocomial pneumonia patients with normal renal function would not be lower than that of the 1.5‐g dose of ceftolozane/tazobactam in plasma for cUTI and cIAI patients. Indeed, as demonstrated above by simulations, at a 3‐g dose of ceftolozane/tazobactam, the PTA for tazobactam in ELF is comparable to that in plasma, which is much higher than the PTA in plasma when the 1.5‐g dose is used.
Therefore, the 3‐g dose of ceftolozane/tazobactam should have sufficient exposure in ELF for both ceftolozane and tazobactam to be efficacious and was selected for testing in the ongoing phase 3 clinical trial for treatment of nosocomial pneumonia in patients with normal renal function (NCT02070757). Likewise, Monte Carlo simulations predict high PTA (≥90%) in ELF for 1.5‐g and 750‐mg ceftolozane/tazobactam doses for nosocomial pneumonia patients with moderate renal impairment (CrCL of 30−50 mL/min) and severe renal impairment (CrCL of 15−30 mL/min), respectively. All these doses used for nosocomial pneumonia are double those used for cIAIs and cUTIs, primarily determined by the plasma‐to‐ELF penetration ratio of about 50%, which is independent of renal function.
It is well known that β‐lactams have varying ELF PRs, without a predictable pattern.3 A similar modeling and simulation approach documented the variability in the PR of meropenem.28 The model‐estimated typical meropenem plasma‐to‐ELF PR in patients with nosocomial pneumonia was 0.25, with the 10th, 25th, 75th, and 90th percentiles of the PR distribution of 0.037, 0.09, 0.70, and 1.78, respectively. Thus, at least 25% of patients may have a PR of <0.1. Although head‐to‐head comparisons are not available, ceftolozane appears to have a higher and less variable PR than meropenem. In addition, direct comparison between ceftolozane and piperacillin in healthy subjects showed the ELF‐to‐plasma AUC ratio for piperacillin to be about 0.26, roughly half that for ceftolozane.9 In summary, plasma‐to‐ELF PRs show variations among drugs and also between healthy subjects and patients, which potentially impact dose optimization. To better characterize the potential variation of PR across different types of patients for a better prediction of the site exposure, another plasma/ELF PK study for ceftolozane/tazobactam is ongoing in critically ill patients (NCT02387372).
There are certain limitations of this study. First, the simulations aimed to justify the doses used for the current phase 3 nosocomial pneumonia study so that the dose regimen was limited to the 1‐hour infusion every 8 hours scenario. Alternative regimens might be needed for different scenarios in clinical practice. Second, the PK/PD target for bacteriostatic and 1‐log kill was based on the relationship between the plasma concentrations and antibacterial effect.10 Although it may be logical to expect that achieving the same %fT>MIC at the site of infection (ie, the ELF) will correlate to similar effects seen in the plasma, confirmatory clinical studies in nosocomial pneumonia are required. In the absence of plasma and ELF PK data for ceftolozane/tazobactam in patients with nosocomial pneumonia, the plasma PK parameters for the patients with cIAIs and the plasma‐to‐ELF penetration kinetics for healthy subjects were assumed to be representative for patients with nosocomial pneumonia. The plasma‐to‐ELF PR estimated from the ceftolozane/tazobactam PK parameters in healthy subjects is likely to be conservative, as studies of piperacillin/tazobactam suggested that higher PRs are achieved in patients with infections and/or inflammatory conditions.9, 29, 30 Although the applicability of target attainment in healthy subjects to patients with nosocomial pneumonia remains controversial,31, 32 the PK of other β‐lactams, such as ceftazidime and meropenem, has historically been similar in patients with cIAIs, the critically ill, and in patients with ventilator‐associated pneumonia.33, 34, 35, 36, 37 To further support our findings, a sensitivity analysis with all PK parameters inflated to 50% CV, typically used to cover the potentially large variability in patients in the worst scenario, demonstrated excellent PTA with the 3‐g dose of ceftolozane/tazobactam for patients with normal renal function. After the PK and clinical outcomes data from the ongoing phase 3 nosocomial pneumonia study are available, population PK models will be updated, and additional simulations will be conducted.
Although MICs of ceftolozane/tazobactam were determined in the presence of 4 mg/L of tazobactam, as recommended by the Clinical and Laboratory Standards Institute,17 PTA estimates for ceftolozane were based solely on ceftolozane, which is valid for the majority (>90%) of nosocomial pneumonia infections caused by non‐ESBL‐producing pathogens in hospitalized patients in US and European medical centers.5 For ESBL‐producing pathogens, published data support tazobactam as an inhibitor of β‐lactamase activity and that the PD driver for tazobactam is the percentage of time above a threshold concentration (%fT>threshold).18, 19 However, the methodology on the best approach to model 2 components (ie, a cephalosporin and a β‐ lactamase inhibitor) simultaneously is investigational and different approaches have been proposed.38, 39, 40 Nevertheless, the individual exposure of both ceftolozane (%fT>MIC) and tazobactam (%fT>MEC) in ELF in patients with normal function at the 3‐g dose of ceftolozane/tazobactam is predicted to be higher than that in plasma at the 1.5‐g dose, which was confirmed to be efficacious in clinical trials for cUTIs and cIAIs against both non‐ESBL‐producing and ESBL‐producing pathogens.12, 13, 14 This is also true for the patients with different degrees of renal impairment when a double of the current approved dose for cIAIs is used for nosocomial pneumonia.
Conclusions
Because of the difference in sites of infection and an approximately 50% plasma‐to‐ELF penetration ratio to achieve a similar or better antibacterial effect (≥90% PTA) against pathogens with an MIC up to 8 mg/L, a double of the current approved dose of ceftolozane/tazobactam for cUTI and cIAI is needed for the treatment of nosocomial pneumonia—that is, 3 g, 1.5 g, and 750 mg for nosocomial pneumonia versus 1.5 g, 750 mg, and 375 mg for cUTI and cIAI, in patients with normal renal function/mild renal impairment, moderate renal impairment, and severe renal impairment, respectively. A confirmatory clinical study assessing the safety and efficacy of the above ceftolozane/tazobactam doses given as 60‐minute intravenous infusions every 8 hours in patients with nosocomial pneumonia is ongoing (ClinicalTrials.gov, number NCT02387372).
Authors' Contributions
A.J.X. was responsible for running the analyses. B.W.M. and E.H. conducted the ELF PK study. All authors contributed to data analysis, interpretation of the results, and preparation of the report, and approved the final version.
Declaration of Conflicting Interests
A. Xiao, B. Miller, and J. Huntington are employees of Merck and Co., Inc., Kenilworth, New Jersey. D. Nicolau is on the speakers' bureau and has received grant support from Merck and Co., Inc., for other research studies; however, no support has been provided by this sponsor for the purpose of review and consultation of this current study.
Funding
This study was funded by Merck and Co., Inc., Kenilworth, New Jerse.
Acknowledgments
Medical writing support was provided by Jean Turner of PAREXEL and funded by Merck and Co., Inc., Kenilworth, New Jersey. Part of this analysis was presented as a poster at the 54th Interscience Conference on Antimicrobial Agents and Chemotherapy (ICAAC), Washington, DC, September 5–9, 2014. Poster #A‐1346.
References
- 1.American Thoracic Society, Infectious Diseases Society of America. Guidelines for the management of adults with hospital‐acquired, ventilator‐associated, and healthcare‐associated pneumonia. Am J Respir Crit Care Med 2005;171(4):388–416. [DOI] [PubMed]
- 2. Jones RN. Microbial etiologies of hospital‐acquired bacterial pneumonia and ventilator‐associated bacterial pneumonia. Clin Infect Dis. 2010; 51(suppl 1):S81–S87. [DOI] [PubMed] [Google Scholar]
- 3. Udy AA, Roberts JA, Lipman J. How should we dose antibiotics for pneumonia in the ICU? Curr Opin Infect Dis. 2013; 26(2):189–195. [DOI] [PubMed] [Google Scholar]
- 4.Zerbaxa [prescribing information]. Lexington, MA: Cubist Pharmaceuticals Inc. 2014. http://www.zerbaxa.com/pdf/PrescribingInformation.pdf
- 5. Farrell DJ, Sader HS, Flamm RK, Jones RN. Ceftolozane/tazobactam activity tested against Gram‐negative bacterial isolates from hospitalised patients with pneumonia in US and European medical centres (2012). Int J Antimicrob Agents. 2014; 43(6):533–539. [DOI] [PubMed] [Google Scholar]
- 6. Craig WA, Andes DR. In vivo activities of ceftolozane, a new cephalosporin, with and without tazobactam against Pseudomonas aeruginosa and Enterobacteriaceae, including strains with extended‐spectrum beta‐lactamases, in the thighs of neutropenic mice. Antimicrob Agents Chemother. 2013; 57(4):1577–1582. [DOI] [PMC free article] [PubMed] [Google Scholar]
- 7. Drusano GL. Antimicrobial pharmacodynamics: critical interactions of “bug and drug” Nat Rev Microbiol. 2004; 2(4):289–300. [DOI] [PubMed] [Google Scholar]
- 8. Lepak AJ, Reda A, Marchillo K, Van HJ, Craig WA, Andes D. Impact of MIC range for Pseudomonas aeruginosa and Streptococcus pneumoniae on the ceftolozane in vivo pharmacokinetic/pharmacodynamic target. Antimicrob Agents Chemother. 2014; 58(10):6311–6314. [DOI] [PMC free article] [PubMed] [Google Scholar]
- 9. Chandorkar G, Huntington JA, Gotfried MH, Rodvold KA, Umeh O. Intrapulmonary penetration of ceftolozane/tazobactam and piperacillin/tazobactam in healthy adult subjects. J Antimicrob Chemother. 2012; 67(10):2463–2469. [DOI] [PubMed] [Google Scholar]
- 10. Roberts JA, Paul SK, Akova M, et al. DALI: defining antibiotic levels in intensive care unit patients: are current beta‐lactam antibiotic doses sufficient for critically ill patients? Clin Infect Dis. 2014; 58(8):1072–1083. [DOI] [PubMed] [Google Scholar]
- 11. Melhem M, Forrest A, Rubino C. Pharmacokinetic‐pharmacodynamic (PK‐PD) target attainment (TA) analyses supporting the selection of in vitro susceptibility test interpretive criteria for ceftolozane/tazobactam (TOL/TAZ) against Pseudomonas aeruginosa Presented at: European Congress of Clinical Microbiology and Infectious Diseases (ECCMID); May 10‐13, 2014; Barcelona, Spain. Poster 1743.
- 12. Solomkin J, Hershberger E, Miller B, et al. Ceftolozane/tazobactam plus metronidazole for complicated intra‐abdominal infections in an era of multidrug resistance: results from a randomized, double‐blind, phase 3 trial (ASPECT‐cIAI). Clin Infect Dis. 2015; 60(10):1462–1471. [DOI] [PMC free article] [PubMed] [Google Scholar]
- 13. Lucasti C, Hershberger E, Miller B, et al. Multicenter, double‐ blind, randomized, phase II trial to assess the safety and efficacy of ceftolozane‐tazobactam plus metronidazole compared with meropenem in adult patients with complicated intra‐abdominal infections. Antimicrob Agents Chemother. 2014; 58(9):5350–5357. [DOI] [PMC free article] [PubMed] [Google Scholar]
- 14. Wagenlehner FM, Umeh O, Steenbergen J, Yuan G, Darouiche RO. Ceftolozane‐tazobactam compared with levofloxacin in the treatment of complicated urinary‐tract infections, including pyelonephritis: a randomised, double‐blind, phase 3 trial (ASPECT‐cUTI). Lancet. 2015; 385(9981):1940–1956. [DOI] [PubMed] [Google Scholar]
- 15. Ambrose PG, Bhavnani SM, Ellis‐Grosse EJ, Drusano GL. Pharmacokinetic‐pharmacodynamic considerations in the design of hospital‐acquired or ventilator‐associated bacterial pneumonia studies: look before you leap! Clin Infect Dis 2010;51(suppl 1):S103–S110. [DOI] [PubMed]
- 16. Chandorkar G, Xiao A, Mouksassi S, Hershberger E, Krishna G. Population pharmacokinetics of ceftolozane/tazobactam in healthy volunteers, subjects with varying degrees of renal function and patients with bacterial infections. J Clin Pharmacol. 2015; 55(2):230–239. [DOI] [PMC free article] [PubMed] [Google Scholar]
- 17.Clinical and Laboratory Standards Institute. Methods for dilution antimicrobial susceptibility tests for bacteria that grow aerobically. Approved standard, 9th ed. CLSI document M07‐A9. Clinical and Laboratory Standards Institute, Wayne, PA: 2012.
- 18. Vanscoy B, Mendes RE, Nicasio AM, et al. Pharmacokinetics‐pharmacodynamics of tazobactam in combination with ceftolozane in an in vitro infection model. Antimicrob Agents Chemother. 2013; 57(6):2809–2814. [DOI] [PMC free article] [PubMed] [Google Scholar]
- 19. Vanscoy B, Mendes RE, McCauley J, et al. Pharmacological basis of beta‐lactamase inhibitor therapeutics: tazobactam in combination with ceftolozane. Antimicrob Agents Chemother. 2013; 57(12):5924–5930. [DOI] [PMC free article] [PubMed] [Google Scholar]
- 20. Pea F, Viale P. The antimicrobial therapy puzzle: could pharmacokinetic‐pharmacodynamic relationships be helpful in addressing the issue of appropriate pneumonia treatment in critically ill patients? Clin Infect Dis. 2006; 42(12):1764–1771. [DOI] [PubMed] [Google Scholar]
- 21. Rello J, Ulldemolins M, Lisboa T, et al. Determinants of prescription and choice of empirical therapy for hospital‐acquired and ventilator‐associated pneumonia. Eur Respir J. 2011; 37(6):1332–1339. [DOI] [PubMed] [Google Scholar]
- 22. Kollef MH, Morrow LE, Niederman MS, et al. Clinical characteristics and treatment patterns among patients with ventilator‐associated pneumonia. Chest. 2006; 129(5):1210–1218. [DOI] [PubMed] [Google Scholar]
- 23. Tumbarello M, De Pascale G, Trecarichi EM, et al. Clinical outcomes of Pseudomonas aeruginosa pneumonia in intensive care unit patients. Intensive Care Med. 2013; 39(4):682–692. [DOI] [PubMed] [Google Scholar]
- 24. Miller B, Hershberger E, Benziger D, Trinh M, Friedland I. Pharmacokinetics and safety of intravenous ceftolozane‐tazobactam in healthy adult subjects following single and multiple ascending doses. Antimicrob Agents Chemother. 2012; 56(6):3086–3091. [DOI] [PMC free article] [PubMed] [Google Scholar]
- 25. Siegel RE. The significance of serum vs tissue levels of antibiotics in the treatment of penicillin‐resistant Streptococcus pneumoniae and community‐acquired pneumonia: are we looking in the wrong place? Chest. 1999; 116(2):535–538. [DOI] [PubMed] [Google Scholar]
- 26. Rodvold KA, George JM, Yoo L. Penetration of anti‐infective agents into pulmonary epithelial lining fluid: focus on antibacterial agents. Clin Pharmacokinet. 2011; 50(10):637–664. [DOI] [PubMed] [Google Scholar]
- 27. Li C, Du X, Kuti JL, Nicolau DP. Clinical pharmacodynamics of meropenem in patients with lower respiratory tract infections. Antimicrob Agents Chemother. 2007; 51(5):1725–1730. [DOI] [PMC free article] [PubMed] [Google Scholar]
- 28. Lodise TP, Sorgel F, Melnick D, Mason B, Kinzig M, Drusano GL. Penetration of meropenem into epithelial lining fluid of patients with ventilator‐associated pneumonia. Antimicrob Agents Chemother. 2011; 55(4):1606–1610. [DOI] [PMC free article] [PubMed] [Google Scholar]
- 29. Felton TW, McCalman K, Malagon I, et al. Pulmonary penetration of piperacillin and tazobactam in critically ill patients. Clin Pharmacol Ther. 2014; 96(4):438–448. [DOI] [PMC free article] [PubMed] [Google Scholar]
- 30. Boselli E, Breilh D, Rimmele T, et al. Alveolar concentrations of piperacillin/tazobactam administered in continuous infusion to patients with ventilator‐associated pneumonia. Crit Care Med. 2008; 36(5):1500–1506. [DOI] [PubMed] [Google Scholar]
- 31. Muller AE, Schmitt‐Hoffmann AH, Punt N, Mouton JW. Monte Carlo simulations based on phase I studies predict target attainment of ceftobiprole in nosocomial pneumonia patients: a validation study. Antimicrob Agents Chemother. 2013; 57(5):2047–2053. [DOI] [PMC free article] [PubMed] [Google Scholar]
- 32. Roberts JA, Lipman J. Optimal doripenem dosing simulations in critically ill nosocomial pneumonia patients with obesity, augmented renal clearance, and decreased bacterial susceptibility. Crit Care Med. 2013; 41(2):489–495. [DOI] [PubMed] [Google Scholar]
- 33. Young RJ, Lipman J, Gin T, Gomersall CD, Joynt GM, Oh TE. Intermittent bolus dosing of ceftazidime in critically ill patients. J Antimicrob Chemother. 1997; 40(2):269–273. [DOI] [PubMed] [Google Scholar]
- 34. Heim‐Duthoy KL, Bubrick MP, Cocchetto DM, Matzke GR. Disposition of ceftazidime in surgical patients with intra‐abdominal infection. Antimicrob Agents Chemother. 1988; 32(12):1845–1847. [DOI] [PMC free article] [PubMed] [Google Scholar]
- 35. de Stoppelaar F, Stolk L, van Tiel F, Beysens A, van der Geest S, de Leeuw P. Meropenem pharmacokinetics and pharmacodynamics in patients with ventilator‐associated pneumonia. J Antimicrob Chemother. 2000; 46(1):150–151. [DOI] [PubMed] [Google Scholar]
- 36. Binder L, Schworer H, Hoppe S, et al. Pharmacokinetics of meropenem in critically ill patients with severe infections. Ther Drug Monit. 2013; 35(1):63–70. [DOI] [PubMed] [Google Scholar]
- 37. Bedikian A, Okamoto MP, Nakahiro RK, et al. Pharmacokinetics of meropenem in patients with intra‐abdominal infections. Antimicrob Agents Chemother. 1994; 38(1):151–154. [DOI] [PMC free article] [PubMed] [Google Scholar]
- 38. Bhagunde P, Chang KT, Hirsch EB, Ledesma KR, Nikolaou M, Tam VH. Novel modeling framework to guide design of optimal dosing strategies for beta‐lactamase inhibitors. Antimicrob Agents Chemother. 2012; 56(5):2237–2240. [DOI] [PMC free article] [PubMed] [Google Scholar]
- 39. Rubino C, Bhavnani SM, Steenbergen JN, Krishna G, Ambrose PG. Pharmacokinetic‐ pharmacodynamic (PK‐PD) target attainment analyses supporting the selection of in vitro susceptibility test interpretive criteria for ceftolozane/tazobactam (TOL/TAZ) against Enterobacteriaceae. Presented at: 54th Annual Interscience Conference on Antimicrobial Agents and Chemotherapy; September 5‐9, 2014; Washington, DC. Poster A‐1347.
- 40. Melchers MJ, Mavridou E, Seyedmousavi S, van Mil AC, Lagarde C, Mouton JW. Plasma and ELF pharmacokinetics of ceftolozane and tazobactam alone and in combination in mice. Antimicrob Agents Chemother. 2015; 59(6):3373–3376. [DOI] [PMC free article] [PubMed] [Google Scholar]


