

Abstract
Rationale
Surface‐Activated Chemical Ionization/Electrospray Ionization mass spectrometry (SACI/ESI‐MS) is a technique with high sensitivity and low noise that allows accurate biomarker discovery studies. We developed a dedicated SACI/ESI software, named SANIST, for both biomarker fingerprint data acquisition and as a diagnostic tool, using prostate cancer (PCa) as the disease of interest.
Methods
Liquid chromatography (LC)/SACI/ESI‐MS technology was employed to detect a potential biomarker panel for PCa disease prediction. Serum from patients with histologically confirmed or negative prostate biopsies for PCa was employed. The biomarker data (m/z or Thompson value, retention time and extraction mass chromatogram peak area) were stored in an ascii database. SANIST software allowed identification of potential biomarkers. A Bayesian scoring algorithm developed in house allowed sample separation based on comparison with samples in the database.
Results
Biomarker candidates from the carnitine family were detected at significantly lower levels in patients showing histologically confirmed PCa. Using these biomarkers, the SANIST scoring algorithm allowed separation of patients with PCa from biopsy negative subjects with high accuracy and sensitivity.
Conclusions
SANIST was able to rapidly identify and perform a preliminary evaluation of the potential diagnostic efficiency of potential biomarkers for PCa. © 2015 The Authors. Rapid Communications in Mass Spectrometry published by John Wiley & Sons Ltd.
Interest is rapidly rising in the Surface‐Activated Chemical Ionization/Electrospray Ionization (SACI‐ESI) technology due to its application for highly sensitive detection of low molecular weight compounds, in particular when applied for biomarker discovery.1 SACI/ESI makes it possible to efficiently detect potential disease‐related biomarker candidate metabolite signals1, 2, 3 and represents a new frontier in the medical diagnostic field, providing relevant information beyond conventional analysis of blood and urine. Among the different approaches developed for mass spectrometry (MS) biomarker discovery over the last few years,4, 5, 6, 7, 8, 9 SACI/ESI has been shown to be more sensitive and accurate with respect to classic mass spectrometric technologies based on electrospray ionization (ESI) alone and Atmospheric Pressure Chemical Ionization.1, 2, 3 A strong reduction in matrix effect together with improved quantification performance was obtained with SACI when matched with ESI.1, 2, 3
Here we developed a bioinformatic tool, termed SANIST, that combines single ion monitoring LC/SACI/ESI‐MS data acquisition of the m/z (Thompson units) signal related to potential biomarker candidates1, 2, 3 with a sample classification based on an innovative and modified Baysian mathematical model. This novel algorithm is based on the comparison of a selected biomarker fingerprint with those stored in a database using an improved Bayesian mathematical model. Prostate cancer (PCa) was used as the disease model in order to test the SANIST platform. PCa is a leading cause of mortality and morbidity in males worldwide. New effective diagnostic approaches are urgently needed as prostate‐specific antigen (PSA), the best‐known prostate cancer biomarker candidate, is prostate but not cancer specific, thus resulting in false positives.10, 11, 12 Sarcosine, recently identified in a metabolomic study,13 has come under scrutiny as a PCa marker.14, 15 We first performed an initial SANIST biomarker discovery on a training set of sera from 15 patients with histologically confirmed prostate cancer and 13 subjects whose biopsies showed benign prostate hyperplasia (BPH). The SANIST approach was used to validate the potential differentially expressed biomarker candidates on a second training set. In particular, three carnitines (decanoyl‐l‐, octanoyl‐l‐ and 5‐cis‐tetradecenoyl carnitine) were detected at lower levels in individuals whose biopsies were positive for prostate cancer. Carnitine is essential for lipid energy metabolism within the mitochondria and in particular fatty acid metabolism.16 Differentially expressed plasma carnitine levels have been found in cancer patients, often ascribed to malnutrition.17 Clinically, L‐carnitine and its derivatives (acetyl‐L‐carnitine; propionyl‐L‐carnitine) are under study to combat wasting and chemotherapy‐induced peripheral neuropathy.18, 19, 20 Carnitine supplementation in several experimental models has been shown to slow down tumor growth.21, 22, 23, 24, 25 Molecular mechanisms suggested include increased generation of reactive oxygen species (ROS), induction of apoptosis and histone deacetylase (HDAC) inhibition. The biomarker panel identified in the training set was then applied to a second set of sera from 15 prostate cancer positive and 15 BPH subjects, showing a high sensitivity and specificity in separation of individuals with prostate cancer from those with benign conditions.
Experimental
Chemicals
Methanol (CH3OH), acetonitrile (CH3CN), bi‐distilled water, acetone (C3H6O), reserpine and formic acid (HCOOH) were purchased from Sigma Aldrich (Milan, Italy). The Ultramark mix was bought from ThermoFisher (San Jose, CA, USA).
Patient selection, sample preparation and collection
Patients were male individuals, aged 50 or more, undergoing a prostate biopsy for PCa diagnosis at the Urology Unit of the MultiMedica Castellanza. Controls, here referred to as benign prostate hyperplasia (BPH), were selected among individuals that had been diagnosed as prostate cancer negative at the time of their biopsy. Patients affected by autoimmune diseases, allergies and other immune‐mediated conditions were excluded. The institutional review board ethics committee approved the study. Blood samples were collected in siliconized tubes, left to coagulate for 30 min and then centrifuged for 30 min at 3000 rpm at 4°C to minimize variability during sample collection.26 Sera obtained were collected in 1.8‐mL cryotube vials (Thermo Fisher Scientific, Rodano, Milan, Italy) and stored at –80°C until the time of analysis. Patients were classified according to clinical parameters, including total and free PSA at the time of sampling, Gleason level to identify the tumor aggressiveness and histological evaluation of the biopsy. Patients were not undergoing any therapy for PCa at the time of sampling.
For LC/MS analysis, 290 μL of serum were spiked with 10 μL of internal standard (reserpine) at known concentration (10 ng/mL) to obtain both a reference for the reproducibility of sample preparation and instrument performance (the stability and performance of commercial instruments are usually checked using this compound). Then 600 μL of CH3CN were added to the spiked serum to precipitate proteins, and the sample was centrifuged. A volume of 600 μL of supernatant was collected and spiked with 100 μL of Ultramark polymer solution (10 ng/mL) to check the LC/MS signal stability during the analysis. Sample was dried using a SpeedVac (ThermoFisher, San Jose, CA, USA). H2O/CH3OH (1:1) solution (100 μL) was used to re‐suspend the analyte sample mixture.27, 28
Chromatography
An Ultimate 3000 UPLC (Thermofisher, San Jose, CA, USA) liquid chromatography apparatus was employed to obtain analyte separation before mass spectrometric analysis. A PFP chromatographic column (50 × 2.1 mm, 1.9 µm; Thermofisher, San Jose, CA, USA) was used for separation. The mobile phases were: (A) H2O + 0.2% HCOOH and (B) CH3OH. A binary gradient was used: 2% of B was maintained for 5 min, in 10 min B% was raised to 30, in a further 20 min B% was brought to 80% and this was maintained for 5 min; 2% of B was reached in 1 min and the column was re‐equilibrated at the starting conditions for 9 min. The chromatographic flow was 0.55 mL/min. The injection volume was 10 μL.
Mass spectrometry
Instrument analysis was performed using an Orbitrap mass spectrometer (ThermoFisher, San Jose, USA) coupled to a SACI/ESI source (described previously1) and operated in positive ion mode. Because carnitines exist as zwitterions (positive and negative charges within the molecule) in solution, their analysis in positive ESI mode is more sensitive if a small amount of acid (0.2% HCOOH in our case) is added to the spray eluent. Full‐scan spectra were acquired in the wide range of 40–3500 m/z for non‐targeted metabolomics analysis to detect all analyte and calibration m/z signals. The same m/z range was maintained for both discovery and selective biomarker studies in order to standardize the instrument response across the SANIST study mainly in terms of scan velocity. Ion source parameters used were as follows: ESI capillary voltage 1500 V, SACI surface voltage 47 V, drying gas: 2 L/min, nebulizer gas: 80 psi and temperature: 40°C. Tandem mass spectrometry experiments were performed under collision‐induced dissociation (CID) conditions using He as the collision gas on a serum sample. An ion trap was employed to isolate and fragment the precursor ions (isolation windows ±0.3 m/z, collision energy 30% of its maximum value (5 V peak to peak)) and the Orbitrap mass analyzer was used to obtain the fragments high accurate m/z ratio (resolution 15,000, m/z error <10 ppm).
Bioinformatics and data analysis
Discovery
The data were converted into the mzXML format29 before data elaboration analysis using Bruker Daltonics Data Analysis software. A XCMS algorithm30 was employed in conjunction with an R statistical elaboration package,31 in order to obtain both m/z discriminant p values (t test). Compound identifications were obtained on the basis of a Metlin database search32 using the high m/z accurate ions. Commercial standards were employed to confirm the identification match. We also employed tandem mass (MS/MS) spectra to support compound identification on a serum sample. The analyte identities were confirmed on the basis of the fragmentation pathway and also using different database elaboration tools (Metlin,32 mzCloud33).
Analysis
SANIST data analysis was done using software developed with the LabView (National Instruments Corporation, Austin, TX, USA) visual language.34 The SANIST tool acquires the selected potential biomarker panel directly from the SACI/ESI‐MS device and automatically compares these with a reference database containing known PCa and BPH subjects. The software directly acquires the extracted ion chromatogram associated with the potential biomarker ion signal detected in the discovery phase and creates an ASCII file containing numeric values.35 The data are imported through an IPV4 protocol. The ion peak area is automatically extracted by the software and processed with the novel SANIST mathematical model based on Bayesian data analysis. SANIST data elaboration is based on the calculation of the probability that the detected disease biomarker profile was related to known disease (e.g. prostate cancer), for which the system was instructed by analyzing and inserting biomarker profiles of serum from biopsy positive (PCa) and negative (BPH) subjects. The Bayes' theorem measures the probability in which an event occurs. Under this interpretation, Bayes' theorem is the relationship between P(A) (probability that an acquired profile is a prostate cancer patient), P(B) (probability that a 'fingerprint' biomarker profile is a biopsy negative subject), P(A|B) and P(B|A) for any events A and B in the same event space. In our case A and B represent the biomarker chromatographic peak area and their relative ratios. The Bayesian interpretation of probability, or uncertainty, measures confidence that something is true. Under this interpretation, Bayes' theorem links uncertainty before and after observing evidence. P(A), the prior, is the initial uncertainty in A. P(A|B), the posterior, is the uncertainty having accounted for evidence B. P(B|A)/P(B) represents the degree of support B provides for A. The relationship among the probabilistic function is shown in Eqn. (1):
| (1) |
We introduced a new coefficient in Eqn. (1) that gives Eqn. (2):
| (2) |
C(mz,rt,i) is a correction factor that, on the basis of the number of uncorrected sample classifications, makes possible to progressively increase the disease classification accuracy. In our case, the samples are correctly classified as prostate cancer biopsy positive or negative with the SANIST tool. To obtain this result at least 10,000 sequential classification steps are needed. The theorem makes it possible to estimate the probability that the observation observed in the serum is correctly classifiable considering the follow experimental observations: accurate m/z value and analyte area (counts/s).
Results and Discussion
Serum samples were obtained from subjects undergoing a prostate biopsy for PCa diagnosis (Supplementary Table S1, see Supporting Information), which represents a typical clinical situation and challenging biomarker scenario where the samples must discriminate between PCa positive and patients with other potential prostate conditions. Samples were subjected to LC/MS analysis using water and CH3OH gradients, solvents often used in carnitine studies.27, 28 In order to obtain potential biomarker candidates for a prostate cancer panel to be used for the SANIST approach, the SACI/ESI data were converted into the mzXML standardized format and elaborated using the XCMS software. Typical representative full scan SACI/ESI mass chromatograms of BPH and prostate cancer subjects extracted under base peak conditions are shown in Figs. 1(a) and 1(b), respectively. As expected, the chromatographic profiles appear to be quite similar but with noticeable differences; therefore, a comparative alignment analysis of all samples was then obtained employing XCMS.30 These data were then analyzed using the R bioinformatic statistical environment31 allowing a comparison of all the m/z values of the chromatographic peak areas between BPH and prostate cancer subjects. In particular, the XCMS/R approach was useful to obtain a simple t‐test or assessing the statistical validity in difference of levels of each m/z value (Table 1). The signals at m/z values of 316.256, 288.217 and 370.295 acquired in positive ion mode were all significantly differentially expressed (p value <0.001) at lower levels in the prostate cancer subjects (Table 2) using the reserpine and Ultramark spiked in references. The instrument stability among the samples was tested by measuring the exact m/z value extraction mass chromatogram peak area variance (10%) of the reserpine internal standard. The sample instrument average analyte area variation was used to check the reproducibility, and was from 73 to 90%.
Figure 1.
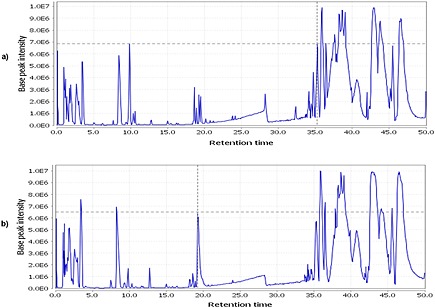
Representative full scan (base peak) extracted ion 'SANIST' mass chromatograms of (a) biopsy negative (BPH) and (b) biopsy positive (PCa) subjects.
Table 1.
Ions that were differentially expressed between serum samples from BPH and positive prostate cancer (PCa positive) subjects in the discovery study and their corresponding metabolites
| m/z value | Ion species | Metabolite name | Fold (Patient area/Control area) | p value |
|---|---|---|---|---|
| 316.256 | [M+H]+ | Decanoyl‐L‐carnitine | 0.76 | 0.0001 |
| 288.217 | [M+H]+ | Octanoyl‐L‐carnitine | 0.85 | 0.0003 |
| 370.295 | [M+H]+ | 5‐cis‐Tetradecenoyl carnitine | 0.72 | 0.0004 |
Table 2.
Classification percent identity score and absolute identity score obtained on the basis of the SANIST platform and the three identified carnitine biomerkers. All prostate cancer patient (PCa positive) profiles are similar to another prostate cancer, while benign prostate hyperplasia (BPH) are closest to other BPH subjects
| Sample | SANIST sample classification | Absolute identity (‰) | Percent identity score (%) |
|---|---|---|---|
| P1 | PCa Positive | 904 | 91 |
| P2 | PCa Positive | 911 | 92 |
| P3 | PCa Positive | 903 | 90 |
| P4 | PCa Positive | 905 | 94 |
| P5 | PCa Positive | 912 | 92 |
| P7 | PCa Positive | 920 | 91 |
| P8 | PCa Positive | 903 | 91 |
| P9 | PCa Positive | 907 | 92 |
| P10 | PCa Positive | 904 | 93 |
| P14 | PCa Positive | 903 | 92 |
| P16 | PCa Positive | 906 | 92 |
| P17 | PCa Positive | 905 | 93 |
| P18 | PCa Positive | 901 | 94 |
| P19 | PCa Positive | 902 | 93 |
| P29 | PCa Positive | 913 | 91 |
| C21 | BPH | 923 | 90 |
| C23 | BPH | 908 | 91 |
| C24 | BPH | 909 | 91 |
| C29 | BPH | 905 | 93 |
| C31 | BPH | 904 | 94 |
| C32 | BPH | 914 | 93 |
| C33 | BPH | 905 | 90 |
| C34 | BPH | 914 | 91 |
| C35 | BPH | 903 | 91 |
| C36 | BPH | 906 | 90 |
| C38 | BPH | 907 | 92 |
| C39 | BPH | 903 | 92 |
| C40 | BPH | 903 | 93 |
The identity of target analytes was also supported by means of MS/MS analysis and structural studies. Figures 2(a), 2(b) and 2(c) report their MS/MS spectra, obtained by CID. The high accurate fragment m/z ratio and the hypothetical structure are reported in Fig. 2.
Figure 2.
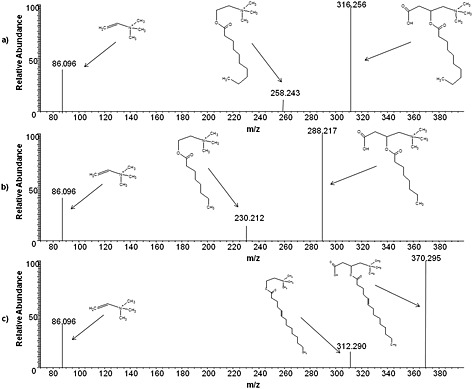
MS/MS spectra, obtained by collision‐induced dissociation (CID), of (a) decanoyl‐L‐Carnitine, (b) octanoyl‐L‐carnitine, and (c) 5‐cis‐tetradecenoyl carnitine.
These data suggest that the selected metabolite levels are biologically relevant candidate biomarkers likely generated by possible altered mitochondrial metabolism of prostate cancer subjects and could represent potentially useful markers for diagnosis. Oxidative stress and apoptosis inhibition are indicative of impaired mitochondrial function that is linked to cancer development.16 A correlation between mitochondrial dysfunction and differentially expressed carnitine has been previously described in rats in the context of ifosfamide chemotherapy toxicity.36 Propionyl‐L‐carnitine and acetyl‐L‐carnitine have shown to be promising in the management of therapy‐induced peripheral neuropathy in PCa patients without affecting therapeutic efficacy,20 and androgen deprivation therapy has been shown to significantly decrease numerous carnitines, including octanoylcarnitine and decanoylcarnitine.37
SANIST software was used to acquire the specific m/z values from the extracted mass chromatograms of the selected biomarker signatures, in full scan mode, using the high accuracy Orbitrap mass analyzer. After data acquisition, SANIST automatically proceeds to data elaboration using the Bayesian elaboration model developed in house in order to statistically evaluate the classification efficiency of the carnitine metabolite biomarker 'fingerprint'. A schematic representation of the SANIST platform is shown in Fig. 3. Basically, SANIST directly acquires the extracted ion chromatogram (Fig. 3(i)) of the selected ions of interest found during the discovery phase, creating an ascii file containing numeric values (m/z value, retention time and extracted ion chromatographic peak area). The ion data are elaborated (Fig. 3(ii)) by means of the Bayesian mathematical model: analyte m/z value, retention time and their peak chromatographic area are compared to those inserted in the SANIST database and classified as negative or (in this case) positive prostate cancer subjects. In particular, Figs. 4(a), 4(b) and 4(c) show the extracted ion chromatogram peaks obtained by monitoring the [M+H]+ ions at m/z 316.256, 288.217 and 370.295. Two scores are provided by the SANIST software:
The absolute identity score (expressed in ‰). This value range is between 1 and 1000 where the score 1000 indicate a complete similarity between the vector of the unknown sample profile and the most similar vector in the database.
The percent identity score (expressed in %). This coefficient reports the classification specificity of the subject state (e.g. BPH or unhealthy) identified by the best match score. This is calculated on the basis of the match score difference between that of the best database match and the next best match. A higher difference associates with a higher classification specificity percent. As an initial test, the biomarker fingerprint of each subject was compared with those inserted in the database, excluding the identical match to itself. The samples were then characterized as BPH or prostate cancer on the basis of their similarity with the best match. A complete discrimination (100%) was achieved among BPH and prostate cancer patients in this training set with a recognition identity % match between 90 and 94% (Table 2).
Figure 3.

'SANIST' bioinformatics platform scheme based on LabView software: (i) extracted ion chromatogram and (ii) total ion current. The evoluted Bayesian comparisons to a developed database makes it possible to statistically evaluate biomarker panel classification efficiency.
Figure 4.
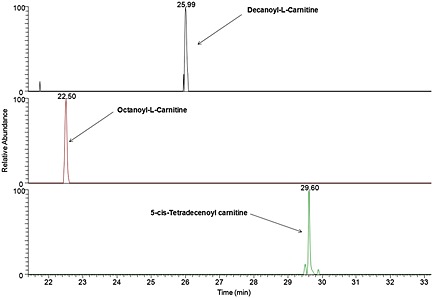
Extracted ion chromatogram peaks obtained by monitoring the [M+H]+ ions at (a) 316.256 m/z, (b) 288.217 m/z, and (c) 370.295 m/z, corresponding to decanoyl‐L‐carnitine, octanoyl‐L‐carnitine and 5‐cis‐tetradecenoyl carnitine, respectively.
A second test set of 15 patients and 15 BPH subjects (indicated with 01 as a suffix) were then analyzed using the SANIST platform to verify the potential specificity and selectivity of the fingerprint identified using the training set. The signals at m/z values of the three represented metabolites (Table 3) in this test set were comparable to those shown in Table 1 and highly statistically significant between the patients and BPH subjects, confirming the same potential biomarker panel found in the training set. The potential biomarker profile database identified in the training set using the SANIST approach was employed to classify the test set. Using this approach, all test set sera with BPH biopsies were matched to training set BPH biopsy samples, while all test set prostate cancer positive patients were matched to training set prostate cancer patients (Table 4). Moreover, a reverse search approach was used by employing the test set as the training set and the training set as the test set; very similar results were obtained, confirming the discriminating power of the SANIST approach. These data indicate that this panel could be a useful tool for supervised diagnostic purposes in prostate cancer due to high reproducibility of the results. A more extensive validation of this panel using a much larger cohort is needed to confirm the clinical usefulness of this panel.
Table 3.
Ions of the differentially expressed metabolites discovered in the training set in serum samples from an independent set of BPH and PCa positive subjects
| m/z value | Ion species | Metabolite name | Fold (Patient area/Control area) | p value |
|---|---|---|---|---|
| 316.256 | [M+H]+ | Decanoyl‐L‐carnitine | 0.56 | 0.0021 |
| 288.217 | [M+H]+ | Octanoyl‐L‐carnitine | 0.47 | 0.0024 |
| 370.295 | [M+H]+ | 5‐cis‐Tetradecenoyl carnitine | 0.41 | 0.0075 |
Table 4.
Classification percent identity score and absolute identity score, obtained by comparing the second sample set data to the training set using the SANIST platform. All the second samples set (01 suffix) match corresponding training set samples within the respective benign prostate hyperplasia (BPH) and prostate cancer patient (PCa positive) groups. No samples were misclassified
| Sample | SANIST sample classification | Absolute identity (‰) | Percent identity score (%) |
|---|---|---|---|
| P101 | PCa Positive | 804 | 90 |
| P201 | PCa Positive | 811 | 89 |
| P301 | PCa Positive | 807 | 85 |
| P401 | PCa Positive | 815 | 91 |
| P501 | PCa Positive | 824 | 86 |
| P601 | PCa Positive | 800 | 87 |
| P701 | PCa Positive | 781 | 87 |
| P801 | PCa Positive | 815 | 85 |
| P901 | PCa Positive | 831 | 84 |
| P1001 | PCa Positive | 829 | 83 |
| P1101 | PCa Positive | 825 | 89 |
| P1201 | PCa Positive | 915 | 91 |
| P1301 | PCa Positive | 905 | 84 |
| P1401 | PCa Positive | 905 | 87 |
| P1501 | PCa Positive | 913 | 88 |
| C101 | Negative | 909 | 88 |
| C201 | BPH | 907 | 81 |
| C301 | BPH | 907 | 86 |
| C401 | BPH | 911 | 85 |
| C501 | BPH | 913 | 84 |
| C601 | BPH | 912 | 84 |
| C701 | BPH | 917 | 86 |
| C801 | BPH | 918 | 86 |
| C901 | BPH | 914 | 83 |
| C1001 | BPH | 914 | 82 |
| C1101 | BPH | 918 | 82 |
| C1201 | BPH | 917 | 83 |
| C1301 | BPH | 914 | 91 |
| C1401 | BPH | 908 | 87 |
| C1501 | BPH | 908 | 89 |
Conclusions
In conclusion, the SANIST bioinformatic application is a dedicated SACI/ESI tool that can identify and analyze biomarker panels.
Supporting information
Supporting info item
Acknowledgements
These studies were supported by grants from the Ministero della Salute Ricerca Finalizzata (2010‐2011), the Ministero dell'Università e della Ricerca (MIUR) Grande Progetto Strategico GPS DM28938 and PRIN (Programmi di Ricerca Scientifica di Rilevante Interesse Nazionale) 2010NECHBX_003, and the AIRC (Associazione Italiana per la Ricerca sul Cancro, IG15895 to DN). AB is a FIRC (Fondazione Italiana per la Ricerca sul Cancro) fellow. DF is a student of the PhD program Clinical and Experimental Medicine at the University of Modena – Reggio‐Emilia. We thank Dr. Stefania Comini (IRCCS MultiMedica) for sample collection and Dr Giancarlo Comeri for helpful discussions. The authors are grateful to Katiuscia Dallaglio for critical reading of the manuscript and Paola Corradino for data management. The funding sources had no influence on study design, on the collection, analysis and interpretation of data, on the writing of the report and on the decision to submit the article for publication.
Albini, A. , Briga, D. , Conti, M. , Bruno, A. , Farioli, D. , Canali, S. , Sogno, I. , D'Ambrosio, G. , Consonni, P. and Noonan, D. M. (2015) SANIST: a rapid mass spectrometric SACI/ESI data acquisition and elaboration platform for verifying potential candidate biomarkers. Rapid Commun. Mass Spectrom., 29: 1703–1710. doi: 10.1002/rcm.7270.
References
- 1. Sogno I., Conti M., Consonni P., Noonan D. M., Albini A.. Surface‐activated chemical ionization‐electrospray ionization source improves biomarker discovery with mass spectrometry. Rapid Commun. Mass Spectrom. 2012, 26, 1213. [DOI] [PubMed] [Google Scholar]
- 2. Conti M., Motta R., Puggioli C., Brambilla P.. Surface‐activated chemical ionization‐electrospray ionization mass spectrometry combined with two‐dimensional serial chromatography is a powerful tool for drug stability studies. Rapid Commun. Mass Spectrom. 2013, 27, 1231. [DOI] [PubMed] [Google Scholar]
- 3. Conti M., Tazzari V., Bertona M., Brambilla M., Brambilla P.. Surface‐activated chemical ionization combined with electrospray ionization and mass spectrometry for the analysis of cannabinoids in biological samples. Part I: analysis of 11‐nor‐9‐carboxytetrahydro‐cannabinol. Rapid Commun. Mass Spectrom. 2011, 25, 1552. [DOI] [PubMed] [Google Scholar]
- 4. Chapman J. D., Goodlett D. R., Masselon C. D.. Multiplexed and data‐independent tandem mass spectrometry for global proteome profiling. Mass Spectrom. Rev. 2013, 33, 452. [DOI] [PubMed] [Google Scholar]
- 5. Di Girolamo F., Del Chierico F., Caenaro G., Lante I., Muraca M., Putignani L.. Human serum proteome analysis: new source of markers in metabolic disorders. Biomark. Med. 2012, 6, 759. [DOI] [PubMed] [Google Scholar]
- 6. Di Girolamo F., Lante I., Muraca M., Putignani L.. The role of mass spectrometry in the "Omics" era. Curr. Org. Chem. 2013, 17, 2891. [DOI] [PMC free article] [PubMed] [Google Scholar]
- 7. Flatley B., Malone P., Cramer R.. MALDI mass spectrometry in prostate cancer biomarker discovery. Biochim. Biophys. Acta 2014, 1844, 940. [DOI] [PubMed] [Google Scholar]
- 8. Honda K., Ono M., Shitashige M., Masuda M., Kamita M., Miura N., Yamada T.. Proteomic approaches to the discovery of cancer biomarkers for early detection and personalized medicine. Jpn. J. Clin. Oncol. 2013, 43, 103. [DOI] [PubMed] [Google Scholar]
- 9. Liebler D. C., Zimmerman L. J.. Targeted quantitation of proteins by mass spectrometry. Biochemistry 2013, 52, 3797. [DOI] [PMC free article] [PubMed] [Google Scholar]
- 10. Amaro A., Esposito A. I., Gallina A., Nees M., Angelini G., Albini A., Pfeffer U.. Validation of proposed prostate cancer biomarkers with gene expression data: a long road to travel. Cancer Metastasis Rev. 2014, 33, 657. [DOI] [PMC free article] [PubMed] [Google Scholar]
- 11. Barry M. J.. Screening for prostate cancer – the controversy that refuses to die. N. Engl. J. Med. 2009, 360, 1351. [DOI] [PubMed] [Google Scholar]
- 12. Thompson I. M., Pauler D. K., Goodman P. J., Tangen C. M., Lucia M. S., Parnes H. L., Minasian L. M., Ford L. G., Lippman S. M., Crawford E. D., Crowley J. J., Coltman C. A. Jr.. Prevalence of prostate cancer among men with a prostate‐specific antigen level < or =4.0 ng per milliliter. N. Engl. J. Med. 2004, 350, 2239. [DOI] [PubMed] [Google Scholar]
- 13. Sreekumar A., Poisson L. M., Rajendiran T. M., Khan A. P., Cao Q., Yu J., Laxman B., Mehra R., Lonigro R. J., Li Y., Nyati M. K., Ahsan A., Kalyana‐Sundaram S., Han B., Cao X., Byun J., Omenn G. S., Ghosh D., Pennathur S., Alexander D. C., Berger A., Shuster J. R., Wei J. T., Varambally S., Beecher C., Chinnaiyan A. M.. Metabolomic profiles delineate potential role for sarcosine in prostate cancer progression. Nature 2009, 457, 910. [DOI] [PMC free article] [PubMed] [Google Scholar] [Research Misconduct Found]
- 14. Cernei N., Heger Z., Gumulec J., Zitka O., Masarik M., Babula P., Eckschlager T., Stiborova M., Kizek R., Adam V.. Sarcosine as a potential prostate cancer biomarker – a review. Int. J. Mol. Sci. 2013, 14, 13893. [DOI] [PMC free article] [PubMed] [Google Scholar]
- 15. Koutros S., Meyer T. E., Fox S. D., Issaq H. J., Veenstra T. D., Huang W. Y., Yu K., Albanes D., Chu L. W., Andriole G., Hoover R. N., Hsing A. W., Berndt S. I.. Prospective evaluation of serum sarcosine and risk of prostate cancer in the Prostate, Lung, Colorectal and Ovarian Cancer Screening Trial. Carcinogenesis 2013, 34, 2281. [DOI] [PMC free article] [PubMed] [Google Scholar]
- 16. Wallace D. C.. A mitochondrial paradigm of metabolic and degenerative diseases, aging, and cancer: a dawn for evolutionary medicine. Annu. Rev. Genet. 2005, 39, 359. [DOI] [PMC free article] [PubMed] [Google Scholar]
- 17. Rabito E. I., Leme I. A., Demenice R., Portari G. V., Jordao A. A. Jr., Dos Santos J. S., Marchini J. S.. Lower carnitine plasma values from malnutrition cancer patients. J. Gastrointest. Cancer 2013, 44, 362. [DOI] [PubMed] [Google Scholar]
- 18. Burotto M., Fojo A. T.. Acetyl‐L‐carnitine and prevention of chemotherapy‐induced peripheral neuropathy: can anything work? Oncologist 2013, 18, 1151. [DOI] [PMC free article] [PubMed] [Google Scholar]
- 19. Ringseis R., Keller J., Eder K.. Mechanisms underlying the anti‐wasting effect of L‐carnitine supplementation under pathologic conditions: evidence from experimental and clinical studies. Eur. J. Nutr. 2013, 52, 1421. [DOI] [PubMed] [Google Scholar]
- 20. Campone M., Berton‐Rigaud D., Joly‐Lobbedez F., Baurain J. F., Rolland F., Stenzl A., Fabbro M., van Dijk M., Pinkert J., Schmelter T., de Bont N., Pautier P.. A double‐blind, randomized phase II study to evaluate the safety and efficacy of acetyl‐L‐carnitine in the prevention of sagopilone‐induced peripheral neuropathy. Oncologist 2013, 18, 1190. [DOI] [PMC free article] [PubMed] [Google Scholar]
- 21. Dionne S., Elimrani I., Roy M. J., Qureshi I. A., Sarma D. R., Levy E., Seidman E. G.. Studies on the chemopreventive effect of carnitine on tumorigenesis in vivo, using two experimental murine models of colon cancer. Nutr. Cancer 2012, 64, 1279. [DOI] [PubMed] [Google Scholar]
- 22. Huang H., Liu N., Guo H., Liao S., Li X., Yang C., Liu S., Song W., Liu C., Guan L., Li B., Xu L., Zhang C., Wang X., Dou Q. P., Liu J.. L‐carnitine is an endogenous HDAC inhibitor selectively inhibiting cancer cell growth in vivo and in vitro. PLoS One 2012, 7, e49062. [DOI] [PMC free article] [PubMed] [Google Scholar]
- 23. Huang H., Liu N., Yang C., Liao S., Guo H., Zhao K., Li X., Liu S., Guan L., Liu C., Xu L., Zhang C., Song W., Li B., Tang P., Dou Q. P., Liu J.. HDAC inhibitor L‐carnitine and proteasome inhibitor bortezomib synergistically exert anti‐tumor activity in vitro and in vivo. PLoS One 2012, 7, e52576. [DOI] [PMC free article] [PubMed] [Google Scholar]
- 24. Roscilli G., Marra E., Mori F., Di Napoli A., Mancini R., Serlupi‐Crescenzi O., Virmani A., Aurisicchio L., Ciliberto G.. Carnitines slow down tumor development of colon cancer in the DMH‐chemical carcinogenesis mouse model. J. Cell. Biochem. 2013, 114, 1665. [DOI] [PubMed] [Google Scholar]
- 25. Wenzel U., Nickel A., Daniel H.. Increased carnitine‐dependent fatty acid uptake into mitochondria of human colon cancer cells induces apoptosis. J. Nutr. 2005, 135, 1510. [DOI] [PubMed] [Google Scholar]
- 26. D'Angelo G., Villa C.. Comparison between siliconized evacuated glass and plastic blood collection tubes for prothrombin time and activated partial thromboplastin time assay in normal patients, patients on oral anticoagulant therapy and patients with unfractioned heparin therapy. Int. J. Lab. Hematol. 2011, 33, 219. [DOI] [PubMed] [Google Scholar]
- 27. Fingerhut R., Ensenauer R., Roschinger W., Arnecke R., Olgemoller B., Roscher A. A.. Stability of acylcarnitines and free carnitine in dried blood samples: implications for retrospective diagnosis of inborn errors of metabolism and neonatal screening for carnitine transporter deficiency. Anal. Chem. 2009, 81, 3571. [DOI] [PubMed] [Google Scholar]
- 28. Morand R., Donzelli M., Haschke M., Krahenbuhl S.. Quantification of plasma carnitine and acylcarnitines by high‐performance liquid chromatography‐tandem mass spectrometry using online solid‐phase extraction. Anal. Bioanal. Chem. 2013, 405, 8829. [DOI] [PubMed] [Google Scholar]
- 29. Pedrioli P. G., Eng J. K., Hubley R., Vogelzang M., Deutsch E. W., Raught B., Pratt B., Nilsson E., Angeletti R. H., Apweiler R., Cheung K., Costello C. E., Hermjakob H., Huang S., Julian R. K., Kapp E., McComb M. E., Oliver S. G., Omenn G., Paton N. W., Simpson R., Smith R., Taylor C. F., Zhu W., Aebersold R.. A common open representation of mass spectrometry data and its application to proteomics research. Nat. Biotechnol. 2004, 22, 1459. [DOI] [PubMed] [Google Scholar]
- 30. Smith C. A., Want E. J., O'Maille G., Abagyan R., Siuzdak G.. XCMS: processing mass spectrometry data for metabolite profiling using nonlinear peak alignment, matching, and identification. Anal. Chem. 2006, 78, 779. [DOI] [PubMed] [Google Scholar]
- 31. R_Core_Team . R: A language and environment for statistical computing. 2014. Available: http://www.R‐project.org.
- 32. Tautenhahn R., Patti G. J., Rinehart D., Siuzdak G.. XCMS Online: a web‐based platform to process untargeted metabolomic data. Anal. Chem. 2012, 84, 5035. [DOI] [PMC free article] [PubMed] [Google Scholar]
- 33. https://www.mzcloud.org/
- 34. Agraz J., Grunfeld A., Li D., Cunningham K., Willey C., Pozos R., Wagner S.. LabVIEW‐based control software for para‐hydrogen induced polarization instrumentation. Rev. Sci. Instrum. 2014, 85, 044705. [DOI] [PubMed] [Google Scholar]
- 35. Cristoni S., Molin L., Lai A., Bernardi L. R., Pucciarelli S., Agostini M., Bedin C., Nitti D., Seraglia R., Repetto O., Dibari V. F., Orlandi R., Sinues P. M., Traldi P.. MALDI‐MS‐NIST library approach for colorectal cancer diagnosis. Rapid Commun. Mass Spectrom. 2009, 23, 2839. [DOI] [PubMed] [Google Scholar]
- 36. Visarius T. M., Bahler H., Kupfer A., Cerny T., Lauterburg B. H.. Thiodiglycolic acid is excreted by humans receiving ifosfamide and inhibits mitochondrial function in rats. Drug Metab. Dispos. 1998, 26, 193. [PubMed] [Google Scholar]
- 37. Saylor P. J., Karoly E. D., Smith M. R.. Prospective study of changes in the metabolomic profiles of men during their first three months of androgen deprivation therapy for prostate cancer. Clin. Cancer Res. 2012, 18, 3677. [DOI] [PMC free article] [PubMed] [Google Scholar]
Associated Data
This section collects any data citations, data availability statements, or supplementary materials included in this article.
Supplementary Materials
Supporting info item