

Abstract
Ethylone, a synthetic cathinone with psychoactive properties, is a designer drug which has appeared on the recreational drug market in recent years. Since 2012, illicit shipments of ethylone hydrochloride have been intercepted with increasing frequency at the Canadian border. Analysis has revealed that ethylone hydrochloride exists as two distinct polymorphs. In addition, several minor impurities were detected in some seized exhibits. In this study, the two conformational polymorphs of ethylone hydrochloride have been synthesized and fully characterized by FTIR, FT‐Raman, powder XRD, GC‐MS, ESI‐MS/MS and NMR (13C CPMAS, 1H, 13C). The two polymorphs can be distinguished by vibrational spectroscopy, solid‐state nuclear magnetic resonance spectroscopy and X‐ray diffraction. The FTIR data are applied to the identification of both polymorphs of ethylone hydrochloride (mixed with methylone hydrochloride) in a laboratory submission labelled as 'Ocean Snow Ultra’. The data presented in this study will assist forensic scientists in the differentiation of the two ethylone hydrochloride polymorphs. This report, alongside our recent article on the single crystal X‐ray structure of a second polymorph of this synthetic cathinone, is the first to confirm polymorphism in ethylone hydrochloride. © 2015 Canada Border Services Agency. Drug Testing and Analysis published by John Wiley & Sons, Ltd. © 2015 Canada Border Services Agency. Drug Testing and Analysis published by John Wiley & Sons, Ltd.
Keywords: ethylone, polymorphism, synthetic cathinones, designer drugs, new psychoactive substances
Introduction
Ethylone [also called 3’,4’‐methylenedioxy‐N‐ethylcathinone, βk‐MDEA and 1‐(1,3‐benzodioxol‐5‐yl)‐2‐(ethylamino)propan‐1‐one] 1 joins an ever increasing number of new psychoactive substances that are more specifically defined as synthetic cathinones. Synthetic cathinones are designer drugs that often serve as a replacement for 3’,4’‐methylenedioxymethamphetamine (MDMA, ‘Ecstasy’) 2, other amphetamines and cocaine.1 These designer drugs are analogues, derivatives and isomers of cathinone 3 (Figure 1), a central nervous stimulant found in leaves of the ‘khat’ bush (Catha edulis).2 Recently, ethylone has been identified in death investigations.3, 4
Figure 1.
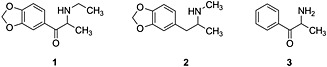
Chemical structures of ethylone 1, MDMA 2 and cathinone 3.
In Canada, ethylone is controlled as an amphetamine analogue under the Controlled Drugs and Substances Act. Ethylone was first seized entering Canada in 2012 and since then, the Canada Border Services Agency has seized over 100 different shipments containing this particular designer drug. With all of the modes (air, land, marine, rail, and postal) available to import commodities into Canada, ethylone has only been intercepted to date upon arrival by air and by post. Most ethylone shipments intercepted at the border arrived by international mail, while the remaining arrived in Canada by international air courier service. The majority of these shipments entered Canada in either Ontario or British Columbia; however, a significant 10 kg shipment of ethylone was intercepted in Alberta. Shipments of ethylone had various declarations or labelling (Table 1) and were of different sizes ranging from several grams to 10 kg, with an average mass of 1 kg. Some shipments were concealed within other objects, including flashlights and speakers. All shipments to date originated from China as high purity crystals, except for one packaged product (labelled as ‘Ocean Snow Ultra’) from Spain that was a powder mixture of ethylone, methylone, and other minor ingredients.
Table 1.
Various Customs declarations or labelling for shipments found to contain 1 hydrochloride
| Ocean Snow Ultra | Acrylic paint | Facial mask powder |
| Iron Oxide Black | Sodium isethionate | Mandy Brown |
| Zeolite | Food materials | Salt rock |
| Geolite | Phenolic resin | Gelatin |
Racemic ethylone was patented in 1996 as an anti‐depressant 5 and some analytical data were published shortly thereafter in an effort to identify this compound rapidly should it appear in the underground drug market.6 The mass spectra and nuclear magnetic resonance (NMR) spectra of ethylone hydrochloride seized in Canada were consistent with the literature; however, the infrared spectra of these exhibits were not the same as previously published spectra for ethylone hydrochloride.6, 7, 8 The seized exhibits were found to be racemic, but there remained various possible explanations for the differences in the vibrational spectra. This paper demonstrates that these differences are due to different polymorphic forms of ethylone hydrochloride. To the best of our knowledge, this paper and our related study9 are the first to describe polymorphism in ethylone hydrochloride.
This paper documents the analytical data (Fourier transform infrared spectroscopy (FTIR), FT‐Raman, X‐ray powder diffraction (XRD), solid‐state 13C cross polarization magic angle spinning nuclear magnetic resonance (13C CPMAS NMR), 1H NMR, 13C NMR, electrospray ionization‐high resolution mass spectra (ESI‐HRMS), liquid chromatography‐mass spectrometry (LC/MSn) and gas chromatography‐mass spectrometry (GC‐MS)) for two polymorphic forms of 1 hydrochloride, designated as 1A and 1B. Such data can be applied to forensic analyses of illicit drug samples. High‐purity reference materials for each polymorph were prepared. Detailed single‐crystal X‐ray diffraction data on the reference materials provided confirmation of the structure of polymorph 1A (space group P212121)9 and polymorph 1B (space group P21/c). The structure of 1B was consistent with previously reported data determined from seized material.10 The structures of the cations differ primarily by a 180° rotation about the C–C bond linking the carbonyl group and side chain to the phenyl ring (Figure 2). These two conformations are the two distinct energy minima9 for this rotation and it is unlikely that any further polymorphic forms will be observed that are the result of the rotation about this C‐C bond. This leads to different packing arrangements, and inversion twinning in 1A, although the strongest intermolecular interactions in each structure involve the same · · · Cl · · · H–N–H · · · Cl · · · hydrogen bonding motifs, which link the cations and anions alternately into extended chains.9 In the solid state, 1A and 1B do not interconvert at room temperature, nor down to 100 K,9 and as a result, can be differentiated by vibrational spectroscopy, solid‐state nuclear magnetic resonance spectroscopy and X‐ray diffraction.
Figure 2.
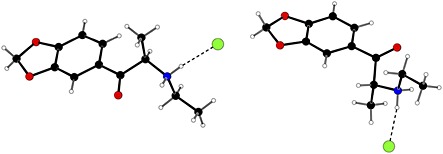
The molecular structures of polymorphs 1A (left) and 1B (right) from the single crystal structure determinations, showing the different conformations of the cationic fused ring system relative to the alkyl chain.
A case study is presented in which infrared spectroscopy was used to identify both polymorphic forms of 1 hydrochloride in a seized exhibit of Ocean Snow Ultra. In addition, an analysis of several seized exhibits revealed 3’,4’‐methylenedioxypropiophenone 4 and 3’,4’‐methylenedioxy‐1,2‐propanedione as either synthetic impurities or as decomposition products.
Experimental procedures
Chemicals, reagents, and methods
All solvents and reagents were purchased from Sigma‐Aldrich (Milwaukee, WI, USA), used without purification and were analytical grade. Sample solutions for analysis by NMR spectroscopy were prepared with 99.9% D anhydrous CD3OD from 1 mL ampoules.
Instrumentation
Density Functional Theory Computations were carried out as described previously.9 The computed atomic coordinates of 1A and 1B are provided in the Supporting Information.
For X‐ray fluorescence spectrometry (Fischerscope X‐ray XAN‐DPP with WINFTM EDXRF software), samples were placed directly on a polypropylene X‐ray TF‐250 thin film and analyzed with an energy of 50 kV and a collimator diameter of 0.6 mm.
Images of crystalline polymorphs 1A and 1B were recorded using a Keyence Digital Microscope VHX‐600E (with VH‐Z00R and VH‐Z100UR lenses) with suitable magnifications.
Melting point temperatures were determined in open capillaries on a Mettler Toledo FP900 Melting Point System and are uncorrected. Samples were heated from 180 °C at a constant heating rate of 1 °C/min.
Differential scanning calorimetry (DSC) analyses were performed by Integrity Testing Laboratory Inc., using a TA Instruments DSC Q10 calorimeter. Prior to the analysis, the DSC was calibrated using an indium calibration standard having a melting point of 156.60 °C and enthalpy of fusion 28.45 J/g. Each polymorph (10 mg) was placed in sealed aluminum pans and heated from 25 °C to 300 °C at a scanning rate of 10 °C/min under a nitrogen atmosphere (50 mL/min), followed by a dwell time of 5 min. Cooling was performed at 10 °C/min from 300 °C to 25 °C, followed by a dwell time of 5 min. A second heating was run under the same conditions as the first heating. DSC data are provided in the Supporting Information.
Thermogravimetric analyses (TGA) were determined using a Shimadzu TGA‐50 thermogravimetric analyzer. The apparatus was calibrated with calcium oxalate monohydrate. Polymorphs 1A (7.542 mg) and 1B (10.020 mg) were each heated on platinum pans from 25 °C to 1000 °C at a rate of 10 °C/min. The samples were maintained under a nitrogen atmosphere (20 mL/min) until 650 °C, when the atmosphere was switched to air. TGA data are provided in the Supporting Information.
ATR‐FTIR spectra were recorded on a Nicolet iS50 FTIR, with a single reflection diamond ATR accessory. Range: 4000 – 650 cm‐1, 16 scans and 4 cm‐1 resolution. Raman spectroscopy was performed using a Nicolet 6700 FTIR with an NXR FT‐Raman module on samples in an NMR tube with an excitation laser power of 1.0 W and an InGaAs detector. Range: 4000–100 cm‐1 Raman shift, 128 scans, 1064 nm Nd‐YVO4 excitation laser.
The powder X‐ray diffraction (XRD) patterns were collected on a PANalytical X'Pert‐PRO diffractometer using Cu Kα 1 radiation (λ = 1.54060 Å) at 45 kV, 40 mA with programmable divergence and anti‐scatter slits in automatic mode with an irradiated and observed length of 8.0 mm. A fixed 2° anti‐scatter slit was used in the incident beam. Each sample was back‐loaded into a PW1172/01 aluminum sample holder. Samples were analyzed in continuous mode with a step size of 0.017° and scan rate of 0.1°/s over an angular range of 5–70° 2θ. Data were collected at room temperature.
Solid‐state 13C CPMAS NMR spectra were collected on each polymorph using a Bruker AVANCE 500 MHz NMR spectrometer at the University of Ottawa NMR Facility. Approximately 60 mg of each polymorph was packed in a 4 mm zirconia rotor equipped with a kel‐F cap. The samples were spun at 10 kHz in a 4 mm Bruker CPMAS probe. Data were collected using a cross polarization pulse sequence using a ramped 1H contact pulse and high power SPINAL 64 decoupling. The 1H 90° pulse, contact time, recycle delay, and acquisition time were 2.5 µs, 2 ms, 4 s, and 32.6 ms, respectively. The spectra were the result of 512 scans. The data were zero‐filled to 16 K data points and processed with 10 Hz of exponential line broadening. The chemical shifts are reported with respect to the carbonyl carbon chemical shift of solid glycine, which was taken to be 176.5 ppm with respect to TMS at 0 ppm.
1H and 13C solution‐state NMR spectra were recorded at 298 K in 5 mm NMR tubes in CD3OD on a Bruker AVANCE III 400 spectrometer at 400.13 MHz (1H NMR) or 100.62 MHz (13C NMR). Chemical shifts are given in parts per million (ppm) relative to the solvent signal of δ = 3.31 ppm for 1H NMR spectroscopy and δ = 49.00 ppm for 13C NMR spectroscopy. Coupling constants (J) are expressed in Hertz (Hz). The following abbreviations are used to designate NMR absorption patterns: s, singlet; d, doublet; dd, doublet of doublets; app t, apparent triplet; q, quartet. The spectra are found in the Supporting Information.
Accurate mass HRMS were obtained on a Thermo Scientific LTQ Orbitrap XL mass spectrometer by flow injection (with an eluent of 0.1% formic acid in 50:50 methanol/water) using ESI. The instrument was operated in positive mode with a resolution setting of 30 000 (FWHM) at m/z 400 and internal lock masses of 391.28429 for the [M + H]+ ion of dioctyl phthalate and 338.34174 for the [M + H]+ ion of erucamide. Data were acquired in full‐scan mode over a range of m/z 100–1000 in the Orbitrap and in product ion (MSn) mode in ranges between m/z 50 and 250 in both the Orbitrap and linear ion trap (IT). Collision‐induced dissociations were carried out at normalized collision energies of 25% for MS2 or 35% for all other MSn experiments.
GC‐MS data were collected using an Agilent 7890A GC with autosampler 7693 series, 1 μL injection, at various split ratios, 4 mm single gooseneck liner (deactivated, with glass wool), DB5MS column (30 m × 0.25 mm × 0.25 µm) with constant flow (1 mL/min of helium) coupled to an Agilent 5975C with a Triple‐Axis Detector. Electron ionization (EI) operating parameters were: inlet temperature 280 °C, interface temperature 280 °C, MS source temperature 230 °C, MS Quad temperature 150 °C, 70 eV ionization energy. The oven temperature program started at an initial temperature of 100 °C with a ramp of 10 °C/min to 300 °C. The final temperature was held for 25 min (total run time 45 min).
Synthetic procedures
The synthetic pathway used to prepare 1A and 1B is given in Scheme 1. This synthetic route is commonly used for the synthesis of most cathinone analogues.11 Starting material 4 was treated with bromine to form the α‐brominated precursor 5 in quantitative yield. Subsequent reaction of 5 with ethylamine in tetrahydrofuran produced 1. After work‐up, polymorph 1A was formed when 1 was treated with ethereal hydrogen chloride, whereas polymorph 1B was formed when 1 was treated with methanolic hydrogen chloride and left to crystallize. Polymorphs 1A and 1B were each collected in high yields as a fine white powder or as colourless crystals respectively.
Scheme 1.
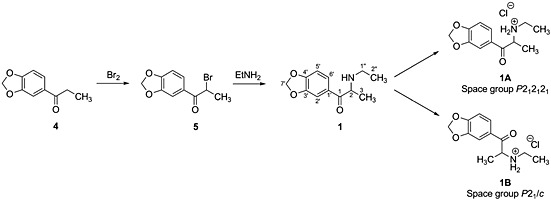
Synthetic pathway used to prepare 1A and 1B.
Results and discussion
Synthesis of reference materials and identification of impurities from seized exhibits
Several synthetic routes have been used and proposed for the preparation of cathinones.12, 13, 14 Seized exhibits containing 1 hydrochloride were also analyzed to determine whether impurities may be characteristic of a manufacturing route.
When seized exhibits of 1 hydrochloride were first analyzed, X‐ray fluorescence (XRF) was used to obtain an elemental profile. In the first few seized exhibits, bromine and chlorine were detected. Bromine was also detected by XRF in selected exhibits of cathinone analogues purchased from ‘smart shops’ in Portugal.15 Synthetic cathinone analogues are traditionally prepared as hydrochloride salts but have been reported as pure hydrobromide salts10, 16 and as mixed bromide/chloride salts.10, 17 Given that the NMR and GC‐MS data of the seized exhibits were consistent with a chemical structure of 1, it was possible that ethylone was prepared as a hydrobromide salt, hydrochloride salt, or as a mixed bromide/chloride salt. Reference materials of 1 hydrochloride were synthesized and a comparison of vibrational spectroscopic (FTIR, FT‐Raman) and X‐ray diffraction (powder and single‐crystal) data to those obtained from seized exhibits was used to confirm that the seized exhibits were also hydrochloride salts. As a result, this conclusion suggested that any detected bromine was present as an artifact of the synthetic route which likely proceeds via the formation of the α‐brominated precursor 5.
Two other minor impurities were detected in seized exhibits, namely, 4 and 3’,4’‐methylenedioxyphenyl‐1,2‐propanedione. The identification of 4 was confirmed by ESI‐HRMS and GC‐MS. The presence of 4 could represent either a synthetic precursor for, or a decomposition product of, 1 or 1 hydrochloride.
The other impurity, 3’,4’‐methylenedioxyphenyl‐1,2‐propanedione, was identified by GC‐MS. A related dione was identified as a decomposition product in diethylpropion hydrochloride.18 Also, cathinone can readily be oxidized in vitro to 1‐phenyl‐1,2‐propanedione.19 Therefore, it was postulated that 3’,4’‐methylenedioxyphenyl‐1,2‐propanedione is also a decomposition product of 1. It has been reported that cathinone derivatives are unstable, for example, with varying pH,20 with applied heat,18, 21, 22 and in air.23 As a result, a limited study was conducted on the stability of 1 hydrochloride under various conditions. It was found by GC‐MS analysis that 4 and 3’,4’‐methylenedioxyphenyl‐1,2‐propanedione are formed from 1 hydrochloride in all of our experiments. Under acidic conditions, 4 and 3’,4’‐methylenedioxyphenyl‐1,2‐propanedione were the main decomposition products, while under alkaline conditions, many other additional products were observed. The application of heat (at slightly elevated temperature or pyrolysis) to solid 1 hydrochloride also resulted in the formation of 4 and 3’,4’‐methylenedioxyphenyl‐1,2‐propanedione and other products. Pyrolysis results in many other byproducts, including suspected iso‐ethylone with a base peak of m/z 178 in the mass spectrum. The application of both heat and humidity resulted in an increase in the relative ratio of ketone to dione when compared to the results from the other experiments. In air at ambient conditions, 4 and 3’,4’‐methylenedioxyphenyl‐1,2‐propanedione were also identified with time as the main decomposition products albeit in low concentrations. Starting material 1A was analyzed by GC/MS to be of high purity before being subjected to these varying conditions.
These preliminary studies can only be used to support rather than confirm that a synthetic route, such as the one presented in Scheme 1, is being used for the illicit preparation of 1A and 1B. The precursor 4 may be the starting material in seized exhibits, or it is possible that 4 was prepared from other chemicals, including isosafrole24 or piperonal.25 Seized exhibits of 1 hydrochloride were found to be racemic, which supports the synthetic route in Scheme 1. Additional work would be needed to confirm the synthetic route and to identify the chemicals used to prepare 1A and 1B in seized exhibits, but this would likely be necessary for each individual exhibit.
To test the synthetic route presented in Scheme 1, the hydrochloride salt of 1 was successfully synthesized from the precursor 4. As discussed in the Synthetic Procedures, polymorph 1A was formed when the free base 1 was treated with ethereal hydrogen chloride, whereas polymorph 1B was formed when the free base 1 was treated with methanolic hydrogen chloride and left to crystallize. Polymorph 1A was also found to persist when the salt was recrystallized from 50:50 v/v methanol‐water at temperatures above 308 K,9 whereas repeated recrystallization from such a solution at room temperature ultimately yielded polymorph 1B.
Characterization of polymorphs
The two crystalline forms of 1 hydrochloride have significantly different morphology. While 1A appears as very small fine needle crystals, 1B exists as large block‐shaped crystals (Figure 3).
Figure 3.
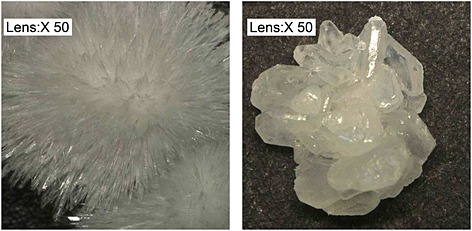
Keyence images of recrystallized 1A (left) and 1B (right).
Melting points for 1A are reported as 225–228 °C 6 and 236–243 °C; 8 however, the thermal analyses (melting point determination, DSC and TGA) indicate that 1A and 1B show no endothermic melting point before decomposition. This feature is not uncommon for alkylammonium hydrochloride salts.26, 27 During the melting point determination, the product decomposes to a dark brown material rather than melting and the values obtained (220–230 °C) were not reproducible. In the DSC experiments, it was found that each polymorph exhibited a single endothermic transition at 256 °C; however, this transition does not seem to be related to a melting endotherm since no other transitions were detected in the cooling and second heating runs for each sample. Overall, it was not possible to separate melting from decomposition with these techniques. The results from TGA further support decomposition as the thermal curves for each polymorph are similar to the thermal curve of the decomposition of dipropylammonium chloride.27 Due to the decomposition of 1A and 1B during heating and the lack of reproducibility in the melting points determined, the melting point cannot be used as a characteristic physical property for these compounds.
When either 1A or 1B is dissolved in solvent, the analytical data from the GC‐MS, LC‐MS, and NMR are identical. When either 1A or 1B is dissolved in methanol and quickly evaporated to dryness, 1A is obtained. This is consistent with our hypothesis that the (A) conformer is more stable in solution.9 From 1A, it is possible to form 1B through a recrystallization process; however, it is more reproducible to proceed by treating the free base 1 with methanolic hydrogen chloride. Most experiments resulted in a mixture of both forms.
Vibrational spectroscopy: infrared and FT‐Raman spectra
Vibrational spectroscopy is well‐suited to characterizing small organic molecules, including cathinones. Infrared spectroscopy has been used to distinguish cathinone homologues6, 7, 12 and to differentiate cathinone regioisomers.28, 29 Similarly, Raman spectroscopy has been used for the identification and characterization of cathinones30 and their mono‐substituted and methylenedioxy substituted regioisomers.31 Although vibrational spectroscopy has long been applied to the study of polymorphs, particularly for the purposes of the pharmaceutical industry, to our knowledge, this is the first published report of infrared and Raman spectroscopy being used to differentiate polymorphs of the same cathinone.
The ATR‐FTIR spectra (Figure 4) of 1A and 1B are significantly different as a consequence of the molecular conformational differences within the crystal structure of each polymorph. The ATR‐FTIR spectrum of 1A is consistent with previously published spectra for synthesized ethylone hydrochloride.6, 7, 8 However, the ATR‐FTIR spectrum of 1B has not been published and is discussed here for the first time in comparison with the spectrum of 1A.
Figure 4.
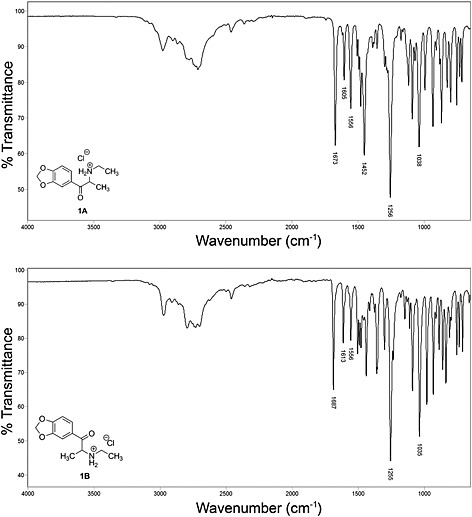
ATR‐FTIR spectra of 1A and 1B.
Both spectra show the characteristic bands associated with the hydrochloride salts of methylenedioxy substituted cathinones. These typically include a broad pattern from about 2200–3100 cm‐1 corresponding to a combination of C‐H stretches and absorption bands from the amine salt, an absorbance in the 1660–1690 cm‐1 region for the carbonyl group in conjugation with the methylenedioxyphenyl group, aromatic C=C ring vibration bands in the region of 1600–1625 cm‐1 and a strong C‐O stretching vibration from the methylenedioxy group at approximately 1250 cm‐1. The bands below 1500 cm‐1 generally allow for unambiguous identification of cathinones.
One of the key features of the infrared spectra of cathinones is the absorbance of the carbonyl group and one significant difference in the IR spectra of these two polymorphs is the frequency of the carbonyl band, which absorbs at approximately 1673 cm‐1 for 1A and 1687 cm‐1 for 1B.
These spectra were recorded in the solid phase and thus reflect differences between the crystal structures of 1A and 1B. The differences in the carbonyl band frequencies arise from different force constants between the two atoms of the carbonyl groups which can be caused by electron‐density differences, crystal packing forces or by different C–C–C=O torsion angles between the aryl ring and the carbonyl group. These torsion angles are 7.9(8)o for 1A and 21.8(2)o for 1B.9 A similar effect has been noted in the shift of the C=O band for 2’‐methylmethcathinone relative to those of the 3’‐methylmethcathinone and 4’‐methylmethcathinone isomers.28
Nevertheless, the differences in stretching frequencies between the two carbonyl groups appear to be an intrinsic property of the two cations, as the computed frequencies for 1A and 1B (gas phase, 298 K) were 1779 and 1810 cm‐1, respectively. Correspondingly, these structures had aryl‐carbonyl torsion angles of 3.2o and 12.8o, respectively. Images of these structures are given in the Supporting Information.
Similar effects may be responsible for a shift of the C=C ring vibration band from 1605 cm‐1 in 1A to 1613 cm‐1 in 1B. The C=C band in the 2’,3’‐methylenedioxy substituted cathinones was also shifted to a higher wavenumber when compared to the corresponding 3’,4’‐methylenedioxy analogues.29
The FT‐Raman spectra (Figure 5) of 1A and 1B are also significantly different, allowing each polymorph to be unambiguously identified. As predicted, they have the characteristic Raman shifts associated with methylenedioxy substituted cathinones, while exhibiting the differences found in their corresponding infrared spectra due to the conformation and packing of the crystals. For example, the C=O and C=C shifts for 1A are at 1673 and 1607 cm‐1, while those for 1B are found at 1686 and 1613 cm‐1, respectively.
Figure 5.
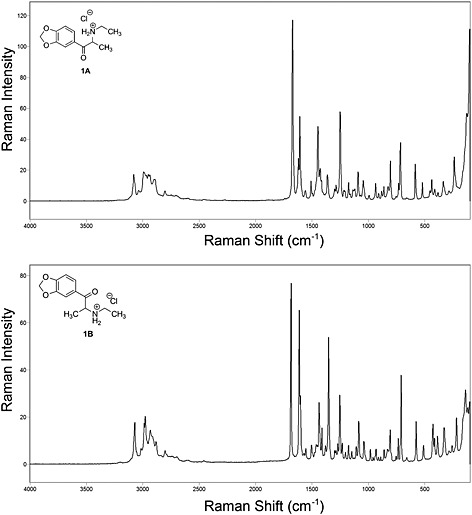
FT‐Raman spectra of 1A and 1B.
Peak lists and expansions of the fingerprint regions of the ATR‐FTIR spectra and FT‐Raman spectra of 1A and 1B are provided in the Supporting Information.
Application to Ocean Snow Ultra exhibit:
In 2012, a seized exhibit consisting of a fine white crystalline powder in a pouch labelled as Ocean Snow Ultra was received at our laboratory for chemical analysis. Initial screening by ATR‐FTIR suggested the exhibit was composed of more than one cathinone and other minor ingredients. The powder was identified as a mixture of methylone and ethylone by GC‐MS, GC/‐IR and ESI‐MS/MS. Further investigation of the ATR‐FTIR spectrum revealed evidence of both polymorphic forms of 1 hydrochloride in this exhibit (Figure 6).
Figure 6.
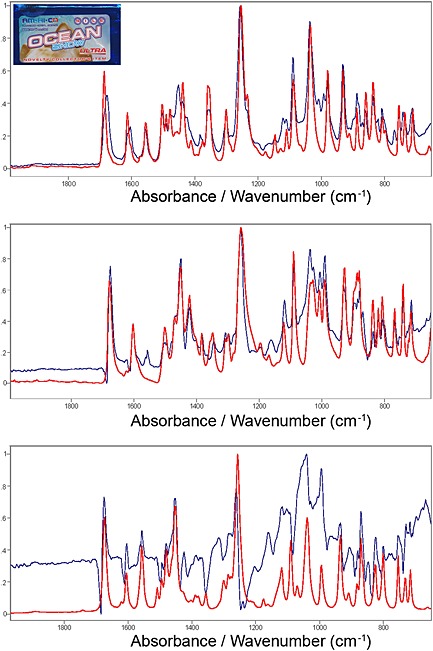
ATR‐FTIR spectra (650–2000 cm‐1) of Ocean Snow Ultra. Top: Ocean Snow Ultra (blue trace) shown with 1B (red trace). Middle: Ocean Snow Ultra with 1B subtracted (blue trace) shown with methylone hydrochloride (red trace). Bottom: Ocean Snow Ultra with 1B and methylone hydrochloride subtracted (blue trace) shown with 1A (red trace).
Powder X‐ray diffraction (XRD)
Powder X‐ray diffraction (XRD) is a powerful analytical technique for the identification of crystalline compounds. A powder diffraction pattern is produced by the interaction of monochromatic X‐rays with the regular repeating packing arrangement of the molecules within the crystal powder producing the pattern. This technique is usually non‐destructive, can discriminate between different forms (polymorphs, solvates) of the same compound and can be used to identify different components in a mixture. Therefore, powder XRD is widely used in the pharmaceutical industry and is an emerging technique for the forensic analysis of controlled drugs. X‐ray diffractometry is listed as a Category A analytical technique by the Scientific Working Group for the Analysis of Seized Drugs (SWGDRUG).32
Since different polymorphic forms of the same substance will give different XRD patterns,33, 34 this technique was used to confirm polymorphism in 1 hydrochloride. The two conformations have significantly dissimilar shapes (Figure 2) and, therefore, the packing of the molecules in each polymorph will not be the same. Thus, the powder diffraction patterns from crystals of each polymorph will be characteristically and identifiably different.
The diffractograms for polymorphs 1A and 1B (Figure 7) show many diagnostic peaks that do not overlap with or are absent in the other pattern, and hence they can be used for unambiguous identification of the polymorphs. Based on the patterns, it is clear that 1A is not present in samples of pure 1B and vice versa. This also demonstrates that the two polymorphs do not interchange during preparation (grinding) for the powder XRD analysis.9, 33, 35 Each pattern is reproducible and can be used as a reference for identification of an unknown sample containing 1 hydrochloride.
Figure 7.
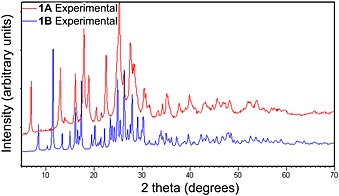
Overlaid measured powder X‐ray diffractograms of 1A and 1B.
To validate the data obtained from powder XRD, patterns of 1A and 1B were simulated from their single crystal X‐ray crystallography reflection data measured at room temperature and compared with the measured powder XRD patterns (Figure 8).
Figure 8.
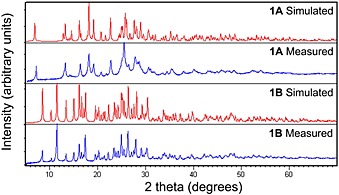
Simulated and measured powder X‐ray diffractograms of 1A and 1B.
There is a slight difference between the simulated and measured patterns of 1B. This includes the intensity difference due to the preferred orientation and multiplicity effects.36 It has been observed that this distortion can be eliminated using transmission mode instead of reflection mode in the analysis of famotidine.37
The simulated and experimental patterns of 1A vary in intensity and the resolution of the peaks observed. Some peak broadening is evident in the experimental pattern, possibly as a consequence of the crystallinity of the measured sample and preferred orientation of the powdered needles, and overlap of smaller peaks with the larger peaks is observed around 13°, 16°, 25°, 27°, and 29° in 2θ. The powder pattern of 1B does not show such significant peak broadening.
Nuclear magnetic resonance (NMR)
Conformational polymorphs are expected to have different solid‐state NMR spectra given that the molecular arrangements in the crystal are different.38 The solid‐state 13C CPMAS NMR spectra for 1A and 1B are shown in Figure 9. The assignments were made to correspond to those determined from solution‐state NMR (Table 2). It is clear that the spectra are not identical and the data support that 1A and 1B are separate solid polymorphs of 1 hydrochloride. The resonances for 1A are 2 to 3 times broader than those for 1B suggesting that 1A is less crystalline than 1B.
Figure 9.
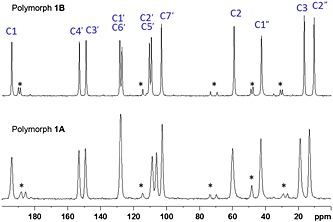
Solid‐state 13C CPMAS NMR spectra of 1A (bottom) and 1B (top). The smaller peaks marked with an asterisk (*) are spinning sidebands.
Table 2.
NMR assignments for 1 hydrochloride
| Position | Solid‐state 13C CPMAS NMR | Solution‐state NMR (CD3OD) | ||
|---|---|---|---|---|
| δ 1A | δ 1B | δ 13C | δ 1H, m, J (Hz) | |
| 1 | 193.98 | 194.11 | 195.0 | ‐ |
| 2 | 59.88 | 59.15 | 58.9 | 5.08, 1H, q, 7.2 |
| 3 | 18.87 | 16.54 | 16.9 | 1.57, 3H, d, 7.2 |
| 1’, 6’ | 127.84 | 128.50, 127.25 | 128.7 (C‐1’) | ‐ |
| 127.2 (C‐6’) | 7.72, 1H, dd, 1.8, 8.2 (H‐6’) | |||
| 2’, 5’ | 108.63, 106.05 | 110.59, 109.36 | 109.0 (C‐2’) | 7.50, 1H, d, 1.8 (H‐2’) |
| 109.5 (C‐5’) | 7.01, 1H, d, 8.2 (H‐5’) | |||
| 3’ | 149.26 | 149.00 | 150.3 | ‐ |
| 4’ | 153.16 | 153.03 | 155.0 | ‐ |
| 7’ | 102.61 | 103.24 | 104.0 | 6.12, 2H, s |
| 1” | 42.77 | 42.54 | 42.4 | 3.11, 2H, ABX3, 7.3, 12.3 |
| 2” | 13.30 | 10.55 | 11.7 | 1.37, 3H, app t, 7.3 |
A combination of 1D (1H, 13C, 13C‐DEPT) and 2D (COSY, 1H,13C‐HSQC, 1H,13C‐HMBC) NMR experiments for 1 hydrochloride in CD3OD permitted the unambiguous assignment of all carbon and hydrogen resonances. The 1H and 13C NMR spectra are presented in the Supporting Information and are generally consistent with previously reported data in the same solvent.7
The N‐ethyl moiety gives 1 hydrochloride an interesting signal pattern in the 1H NMR. The diastereotopic methylene protons, coupled to one another and to the methyl protons (H‐2”), show second order effects. Each proton of the methylene group exhibits geminal coupling (J = 12.3 Hz) and further vicinal coupling (J = 7.3 Hz). As a result, this spin system is described as an ABX3 and is consistent with the signals from the N‐ethyl group in 4’‐methyl‐N‐ethylcathinone.39 The methyl protons (H‐2”) of the N‐ethyl group are equally coupled to each of the non‐equivalent methylene protons and appear as an apparent triplet (J = 7.3 Hz) at 1.37 ppm. The doublet of triplets reported in the literature 7 for this signal was not observed.
Liquid chromatography‐mass spectrometry and high resolution mass spectrometry
The accurate mass ESI‐HRMS data obtained for 1 hydrochloride are consistent with the chemical formula of ethylone. The mass accuracies of the protonated molecule (C12H16NO3 +, m/z 222.11252) and the related isotope peak (C11 13CH16NO3 +, m/z 223.11584) experimentally determined on 1A, were well within 1 ppm.
Fragmentation data were obtained from selected precursor ions by collision‐induced dissociation in the linear ion trap with the resulting product ions detected in the ion trap (Figure 10) and in the Orbitrap (Table 3).
Figure 10.
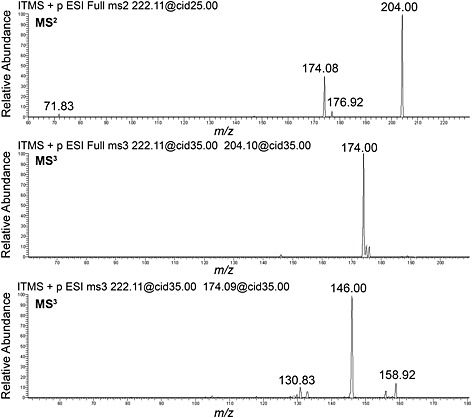
Product ion spectra on a linear ion trap for 1: MS2 on m/z 222 (top); MS3 on m/z 222, 204 (middle); and MS3 on m/z 222, 174 (bottom).
Table 3.
Proposed assignment of the primary fragments from the product ion spectra of 1
| MSn | Selected precursor ion (m/z) | Product ion (m/z) | Mass accuracy (ppm) | Proposed Formula | Proposed source of fragment from precursor ion |
|---|---|---|---|---|---|
| MS2 | 222.11 | 204.10185 | ‐0.26 | C12H14NO2 + | loss of water |
| 177.05457 | ‐0.31 | C10H9O3 + | loss of ethylamine | ||
| 174.09132 | ‐0.10 | C11H12NO+ | loss of CH2O | ||
| 72.08064 | ‐1.95 | C4H10N+ | iminium ion | ||
| MS3 | 204.10 | 174.09129 | ‐0.27 | C11H12NO+ | loss of CH2O |
| MS3 | 174.09 | 159.06790 | +0.22 | C10H9NO +• | loss of methyl radical |
| 146.09643 | +0.01 | C10H12N+ | loss of CO | ||
| 131.07290 | ‐0.38 | C9H9N+• | loss of methyl radical (subsequent to loss of CO) | ||
| MS5* | 146.10 | 131.07296 | +0.09 | C9H9N+• | loss of methyl radical |
same result obtained by either MS4 or MS5
The fragmentation pathways for cathinones under the conditions used in ESI‐HRMS instruments are distinctly different from those observed in EI‐MS spectra. It does not appear that a formal study of the fragmentation mechanisms of cathinones, including ethylone, has been completed, however, the origins of many of the characteristic fragments have been proposed.40, 41, 42, 43, 44, 45, 46
The primary fragments in the ESI‐HRMS of 1 are consistent with the neutral loss of water ([M + H‐H2O]+, m/z 204), subsequent loss of formaldehyde ([M + H‐H2O‐CH2O]+, m/z 174) and subsequent loss of CO ([M + H‐H2O‐CH2O‐CO]+, m/z 146). The m/z 174 ion has also been postulated41 to form by loss of the methylenedioxy moiety from the parent ion, [M + H‐CH2(OH)2]+, and while this pathway has not been ruled out, our MS2 data suggests that it is forming from the dehydrated species. Other ions observed in the product ion spectra include m/z 177 (loss of ethylamine), m/z 159 (loss of a methyl radical from m/z 174), m/z 131 (loss of a methyl radical from m/z 146) and m/z 72 (the iminium ion formed from the side chain). No significant amount of the acylium ion at m/z 149 was observed in our experiments. Isotopic labelling studies are required to provide a complete mechanism of the fragmentation pathways.
Gas chromatography‐mass spectrometry
The EI‐MS is shown in Figure 11 and is consistent with previously reported data.7, 8 Consistent with other synthetic cathinones, the molecular ion (m/z 221) is weak and the base peak (m/z 72) corresponds to the formation of an iminium ion (C4H10N+).
Figure 11.
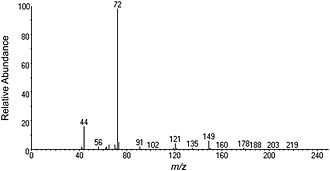
EI‐MS data for 1.
Conclusion
This work describes and provides analytical data for two polymorphic forms of the designer drug ethylone hydrochloride to assist forensic chemists in their identification. The two polymorphs of ethylone hydrochloride were synthesized in our laboratory and it has been shown that they can be distinguished easily by ATR‐FTIR, FT‐Raman, powder XRD, and solid‐state NMR. The synthesized ethylone was also characterized by GC‐MS, ESI‐HRMS and solution‐state NMR. The analytical data have been used to identify ethylone hydrochloride in seizures made by the Canada Border Services Agency. All seizures to date have been in form 1B, other than one exhibit of Ocean Snow Ultra that was shown to contain both polymorphs. It has been found that each polymorph of ethylone hydrochloride can be converted under appropriate conditions into the other form for comparison to reference spectra. This approach may also apply if polymorphs of other synthetic cathinones are encountered.
Supporting information
Supporting info item
Acknowledgements
The authors would like to sincerely thank Dr Glenn Facey for performing solid‐state NMR experiments, Ketevan Chigogidze and Dr Anasuya Adibhatla for powder X‐ray diffraction, Pat Latour for GC‐MS experiments, Céline Chartrand for solution‐state NMR and LC‐MS experiments and Caroline Dulude for TGA analysis. We would also like to acknowledge the Border Services Officers in British Columbia, Alberta and Ontario for finding the seized exhibits. We gratefully acknowledge access to computational facilities at the ACEnet Regional High Performance Computing Consortium for universities in Atlantic Canada, funded by the Canada Foundation for Innovation, the Atlantic Canada Opportunities Agency and the provinces of Newfoundland & Labrador, Nova Scotia and New Brunswick.
Maheux, C. R. , Alarcon, I. Q. , Copeland, C. R. , Cameron, T. S. , Linden, A. , and Grossert, J. S. (2016) Identification of polymorphism in ethylone hydrochloride: synthesis and characterization. Drug Test. Analysis, 8: 847–857. doi: 10.1002/dta.1859.
References
- 1. German C. L., Fleckenstein A. E., Hanson G. R.. Bath salts and synthetic cathinones: An emerging designer drug phenomenon. Life Sci. 2014, 97, 2. [DOI] [PMC free article] [PubMed] [Google Scholar]
- 2. Cozzi N. V., Sievert M. K., Shulgin A. T., Jacob P. III, Ruoho A. E.. Inhibition of plasma membrane monoamine transporters by β‐ketoamphetamines. Eur. J. Pharmacol. 1999, 381, 63. [DOI] [PubMed] [Google Scholar]
- 3. McIntyre I. M., Hamm C. E., Sherrard J. L., Gary R. D., Burton C. G., Mena O.. Acute 3,4‐Methylenedioxy‐N‐Ethylcathinone (Ethylone) Intoxication and Related Fatality: A Case Report with Postmortem Concentrations. J. Anal. Toxicol. 2015, 39, 225. [DOI] [PubMed] [Google Scholar]
- 4. Lee D., Chronister C. W., Hoyer J., Goldberger B. A.. Ethylone‐Related Deaths: Toxicological Findings. J. Anal. Toxicol. 2015. DOI:10.1093/jat/bkv053. [DOI] [PubMed] [Google Scholar]
- 5. Jacob P. III, Shulgin A.T.. Novel N‐substituted‐2‐amino‐3',4'‐methylene‐dioxypropiophenones. Patent No. WO9639133 (A1). 1996.
- 6. Dal Cason T. A.. The characterization of some 3,4‐methylenedioxycathinone (MDCATH) homologs. Forensic Sci. Int. 1997, 87, 9. [Google Scholar]
- 7. Russell M. J., Bogun B.. New “party pill” components in New Zealand: The synthesis and analysis of some β‐ketone analogues of 3,4‐methylenedioxymethamphetamine (MDMA) including βk‐DMBDB (β‐ketone‐N,N‐dimethyl‐1‐(1,3‐benzodioxol‐5‐yl)‐2‐butanamine). Forensic Sci. Int. 2011, 210, 174. [DOI] [PubMed] [Google Scholar]
- 8. Scientific Working Group for the Analysis of Seized Drugs (SWGDRUG) Ethylone Monograph. Available at: http://www.swgdrug.org/Monographs/Ethylone.pdf [7 April 2015].
- 9. Cameron T. S., Grossert J. S., Maheux C. R., Alarcon I. Q., Copeland C. R., Linden A.. Inversion twinning in a second polymorph of the hydrochloride salt of the recreational drug ethylone. Acta Crystallogr. C. 2015, 71, 266. [DOI] [PubMed] [Google Scholar]
- 10. Wood M. R., Lalancette R. A., Bernal I.. Crystallographic investigations of select cathinones: emerging illicit street drugs known as 'bath salts'. Acta Crystallogr. C. 2015, 71, 32. [DOI] [PubMed] [Google Scholar]
- 11. Archer R. P., Treble R., Williams K.. Reference materials for new psychoactive substances. Drug Test. Anal. 2011, 3, 505. [DOI] [PubMed] [Google Scholar]
- 12. Maheux C. R., Copeland C. R.. Chemical analysis of two new designer drugs: buphedrone and pentedrone. Drug Test. Anal. 2012, 4, 17. [DOI] [PubMed] [Google Scholar]
- 13. Osorio‐Olivares M., Rezende M. C., Sepúlveda‐Boza S., Cassels B. K., Baggio R. F., Muñoz‐Acevedo J. C.. A two‐step method for the preparation of homochiral cathinones. Tetrahedron: Asymmetry. 2003, 14, 1473. [Google Scholar]
- 14. Smolianitski E., Wolf E., Almog J.. Proactive forensic science: A novel class of cathinone precursors. Forensic Sci. Int. 2014, 242, 219. [DOI] [PubMed] [Google Scholar]
- 15. Zancajo V. M. R., Brito J., Carrasco M. P., Bronze M. R., Moreira R., Lopes A.. Analytical profiles of “legal highs” containing cathinones available in the area of Lisbon. Portugal. Forensic Sci. Int. 2014, 244, 102. [DOI] [PubMed] [Google Scholar]
- 16. Khreit O. I. G., Irving C., Schmidt E., Parkinson J. A., Nic Daeid N., Sutcliffe O. B.. Synthesis, full chemical characterisation and development of validated methods for the quantification of the components found in the evolved “legal high” NRG‐2. J. Pharm. Biomed. Anal. 2012, 61, 122. [DOI] [PubMed] [Google Scholar]
- 17. Power J. D., Kavanagh P., O'Brien J., Barry M., Twamley B., Talbot B., Dowling G., Brandt S. D.. Test purchase, identification and synthesis of 2‐amino‐1‐(4‐bromo‐2, 5‐dimethoxyphenyl)ethan‐1‐one (bk‐2C‐B). Drug Test. Anal. 2015, 7, 512. [DOI] [PubMed] [Google Scholar]
- 18. Walters M. J., Walters S. M.. High‐performance liquid chromatographic determination of diethylpropion hydrochloride in tablets: isolation and identification of two decomposition products. J. Pharm. Sci. 1977, 66, 198. [DOI] [PubMed] [Google Scholar]
- 19. Hashimoto Y., Kawanishi K., Moriyasu M.. Chapter 1 Forensic Chemistry of Alkaloids by Chromatographic Analysis. Alkaloids: Chem. Pharmacol. 1988, 32, 1. [Google Scholar]
- 20. Tsujikawa K., Mikuma T., Kuwayama K., Miyaguchi H., Kanamori T., Iwata Y. T., Inoue H.. Degradation pathways of 4‐methylmethcathinone in alkaline solution and stability of methcathinone analogs in various pH solutions. Forensic Sci. Int. 2012, 220, 103. [DOI] [PubMed] [Google Scholar]
- 21. Kavanagh P., O'Brien J., Power J. D., Talbot B., McDermott S. D.. 'Smoking' mephedrone: The identification of the pyrolysis products of 4‐methylmethcathinone hydrochloride. Drug Test. Anal. 2013, 5, 291. [DOI] [PubMed] [Google Scholar]
- 22. Bell S., Nida C.. Pyrolysis of drugs of abuse: a comprehensive review. Drug Test. Anal. 2015, 7, 445. [DOI] [PubMed] [Google Scholar]
- 23. Tsujikawa K., Yamamuro T., Kuwayama K., Kanamori T., Iwata Y. T., Inoue H.. Instability of the hydrochloride salts of cathinone derivatives in air. Forensic Sci. Int. 2015, 248, 48. [DOI] [PubMed] [Google Scholar]
- 24. Ichikawa N., Togashi E.. Derivatives of isosafrole. I. A new method for the synthesis of 3,4‐methylenedioxypropiophenone. Nippon Kagaku Kaishi (1921‐47). 1950, 71, 596. [Google Scholar]
- 25. Maheux C. R., Copeland C. R., Pollard M. M.. Characterization of three methcathinone analogs: 4‐methylmethcathinone, methylone, and bk‐MBDB. Microgram J. 2010, 7, 42. [Google Scholar]
- 26. Ding Z., Hao A.. Synthesis and thermotropic properties of novel double‐chained quaternary ammonium chlorides with symmetric and asymmetric hydrocarbon chain length. J. Mol. Struct. 2009, 923, 127. [Google Scholar]
- 27. Mitra S., Singh H. P.. The thermal investigation of some normal propylammonium salts in the solid state. Thermochim. Acta. 1993, 225, 43. [Google Scholar]
- 28. Power J. D., McGlynn P., Clarke K., McDermott S. D., Kavanagh P., O'Brien J.. The analysis of substituted cathinones. Part 1: Chemical analysis of 2‐, 3‐ and 4‐methylmethcathinone. Forensic Sci. Int. 2011, 212, 6. [DOI] [PubMed] [Google Scholar]
- 29. Kavanagh P., O'Brien J., Fox J., O'Donnell C., Christie R., Power J. D., McDermott S. D.. The analysis of substituted cathinones. Part 3. Synthesis and characterisation of 2,3‐methylenedioxy substituted cathinones. Forensic Sci. Int. 2012, 216, 19. [DOI] [PubMed] [Google Scholar]
- 30. Stewart S. P., Bell S. E. J., Fletcher N. C., Bouazzaoui S., Ho Y. C., Speers S. J., Peters K. L.. Raman spectroscopy for forensic examination of β‐ketophenethylamine “legal highs”: Reference and seized samples of cathinone derivatives. Anal. Chim. Acta. 2012, 711, 1. [DOI] [PubMed] [Google Scholar]
- 31. Christie R., Horan E., Fox J., O'Donnell C., Byrne H. J., McDermott S., Power J., Kavanagh P.. Discrimination of cathinone regioisomers, sold as 'legal highs', by Raman spectroscopy. Drug Test. Anal. 2014, 6, 651. [DOI] [PubMed] [Google Scholar]
- 32. Scientific Working Group for the Analysis of Seized Drugs (SWGDRUG) Recommendations Edition 7.0. Available at: http://www.swgdrug.org/approved.htm [7 April 2015].
- 33. Agatonovic‐Kustrin S., Rades T., Wu V., Saville D., Tucker I. G.. Determination of polymorphic forms of ranitidine‐HCl by DRIFTS and XRPD. J. Pharm. Biomed. Anal. 2001, 25, 741. [DOI] [PubMed] [Google Scholar]
- 34. Bonfilio R., Leal J. S., Santos O. M. M., Pereira G. R., Doriguetto A. C., de Araújo M. B.. Analysis of chlorthalidone polymorphs in raw materials and tablets and the effect of forms I and II on the dissolution properties of drug products. J. Pharm. Biomed. Anal. 2014, 88, 562. [DOI] [PubMed] [Google Scholar]
- 35. Otsuka M., Kaneniwa N.. Effect of seed crystals on solid‐state transformation of polymorphs of chloramphenicol palmitate during grinding. J. Pharm. Sci. 1986, 75, 506. [DOI] [PubMed] [Google Scholar]
- 36. Pecharsky V. K., Zavalij P. Y.. Fundamentals of Powder Diffraction and Structural Characterization of Materials, Springer, New York: 2009. [Google Scholar]
- 37. Német Z., Sajó I., Demeter Á.. Rietveld refinement in the routine quantitative analysis of famotidine polymorphs. J. Pharm. Biomed. Anal. 2010, 51, 572. [DOI] [PubMed] [Google Scholar]
- 38. Thirunahari S., Aitipamula S., Chow P. S., Tan R. B. H.. Conformational Polymorphism of Tolbutamide: A Structural, Spectroscopic, and Thermodynamic Characterization of Burger's Forms I‐IV. J. Pharm. Sci. 2010, 99, 2975. [DOI] [PubMed] [Google Scholar]
- 39. Nycz J. E., Malecki G., Zawiazalec M., Pazdziorek T.. X‐ray structures and computational studies of several cathinones. J. Mol. Struct. 2011, 1002, 10. [Google Scholar]
- 40. Fornal E.. Formation of odd‐electron product ions in collision‐induced fragmentation of electrospray‐generated protonated cathinone derivatives: α‐primary amino ketones. Rapid Commun. Mass Spectrom. 2013, 27, 1858. [DOI] [PubMed] [Google Scholar]
- 41. Fornal E.. Identification of substituted cathinones: 3,4‐Methylenedioxy derivatives by high performance liquid chromatography‐quadrupole time of flight mass spectrometry. J. Pharm. Biomed. Anal. 2013, 81–82, 13. [DOI] [PubMed] [Google Scholar]
- 42. Zuba D.. Identification of cathinones and other active components of ‘legal highs’ by mass spectrometric methods. Trends Anal. Chem. 2012, 32, 15. [Google Scholar]
- 43. Reitzel L. A., Dalsgaard P. W., Müller I. B., Cornett C.. Identification of ten new designer drugs by GC‐MS, UPLC‐QTOF‐MS, and NMR as part of a police investigation of a Danish Internet company. Drug Test. Anal. 2012, 4, 342. [DOI] [PubMed] [Google Scholar]
- 44. Strano Rossi S., Odoardi S., Gregori A., Peluso G., Ripani L., Ortar G., Serpelloni G., Romolo F. S.. An analytical approach to the forensic identification of different classes of new psychoactive substances (NPSs) in seized materials. Rapid Commun. Mass Spectrom. 2014, 28, 1904. [DOI] [PubMed] [Google Scholar]
- 45. López‐Arnau R., Martinez‐Clemente J.. M.l. Carbó, D. Pubill, E. Escubedo, J. Camarasa. An integrated pharmacokinetic and pharmacodynamic study of a new drug of abuse, methylone, a synthetic cathinone sold as 'bath salts'. Prog. Neuro‐Psychopharmacol. Biol. Psychiatry. 2013, 45, 64. [DOI] [PubMed] [Google Scholar]
- 46. Fornal E.. Study of collision‐induced dissociation of electrospray‐generated protonated cathinones. Drug Test. Anal. 2014, 6, 705. [DOI] [PubMed] [Google Scholar]
Associated Data
This section collects any data citations, data availability statements, or supplementary materials included in this article.
Supplementary Materials
Supporting info item