Abstract
This work examines the effect of midazolam‐induced light sedation on intrinsic functional connectivity of human brain, using a randomized, double‐blind, placebo‐controlled, cross‐over, within‐subject design. Fourteen healthy young subjects were enrolled and midazolam (0.03 mg/kg of the participant's body mass, to a maximum of 2.5 mg) or saline were administrated with an interval of one week. Resting‐state fMRI was conducted before and after administration for each subject. We focus on two types of networks: sensory related lower‐level functional networks and higher‐order functions related ones. Independent component analysis (ICA) was used to identify these resting‐state functional networks. We hypothesize that the sensory (visual, auditory, and sensorimotor) related networks will be intact under midazolam‐induced light sedation while the higher‐order (default mode, executive control, salience networks, etc.) networks will be functionally disconnected. It was found that the functional integrity of the lower‐level networks was maintained, while that of the higher‐level networks was significantly disrupted by light sedation. The within‐network connectivity of the two types of networks was differently affected in terms of direction and extent. These findings provide direct evidence that higher‐order cognitive functions including memory, attention, executive function, and language were impaired prior to lower‐level sensory responses during sedation. Our result also lends support to the information integration model of consciousness. Hum Brain Mapp 36:4247–4261, 2015. © 2015 The Authors Human Brain Mapping Published by Wiley Periodicals, Inc.
Keywords: resting‐state functional MRI (rs‐fMRI), independent component analysis (ICA), midazolam, sedation
Abbreviations
- AN
auditory network
- DAN
dorsal attention network
- DMN
default mode network
- ECN
executive control network
- FPN
frontoparietal network
- FWHM
full width at half maximum
- ICA
independent component analysis
- LAN
language network
- MN
motor network
- MNI
Montreal Neurological Institute
- PCA
principle component analysis
- PVN
primary visual network
- rs‐fMRI
resting state functional MRI
- RSN
resting state networks
- SMN
sensorimotor network
- SN
salience network
- VN
visual network
INTRODUCTION
Consciousness is a phenomenon that has so far not been exactly defined. Many efforts have been made; however, the neural bases of consciousness remain poorly understood. Resting‐state functional magnetic resonance imaging (rs‐fMRI) combined with sedation presents a unique approach for locating changes in brain activity associated with altered consciousness. This experimental paradigm attempts to manipulate the global level of consciousness, and may contribute to the study of the neural substrates of consciousness.
Fruits from rs‐fMRI domain have demonstrated that the spontaneous activity is highly organized into different resting state networks (RSN) [Damoiseaux et al., 2006; Kiviniemi et al., 2003 ; Smith et al., 2009]. Each RSN consists of brain regions functionally connected and is considered to be associated with different cognitive functions [Gordon et al., 2012; Menon, 2011; Smith et al., 2009]. Some of RSNs were thought of as higher‐level brain networks, which are responsible for memory, executive function, language, attention, self‐referential function, etc. Others were called lower‐level networks, which relate to perceptual processing. It was also widely admitted that low frequency changes in blood oxygenation as measured by resting‐state functional connectivity reflect neuronal activity. Given that the within‐network connectivity of the RSNs is reliably and stably observed in fully awake resting state of human brain [Zuo et al., 2010], we are thus interested to investigate how drug‐induced sedation affects the integrity of the RSNs.
In previous studies, the widely recognized results of drug‐induced sedation/anesthesia effect on RSNs are the elevated connectivity within the lower‐level sensorimotor networks including motor network (MN), auditory network (AN), and visual network (VN) [MacDonald et al., 2015]. While for higher‐order networks, although default mode network (DMN) got the most focus, results of the drug effect on DMN are inconsistent. For instance, both decreased connectivity [Boveroux et al., 2010; Greicius et al., 2008; Jordan et al., 2013] and increased connectivity [Liu et al., 2014; Martuzzi et al., 2010; Stamatakis et al., 2010] within DMN have been reported. Actually, there are also some other contradictory results in previous studies, such as the drug effects on the thalamus region [Alkire et al., 2008]. Although many factors such as drug type and concentration may contribute to the variability, an important reason for these inconsistent results may be the improper study design. Some studies used the uni‐modal design (i.e., no placebo condition) [Deshpande et al., 2010; Martuzzi et al., 2010, 2011; Schrouff et al., 2011]. As the injection per se may cause some emotion experience and psychological activities (e.g., nervous, mental preparation, etc.), the results based on this design cannot be fully attributed to the drug effect of our interest. In this case, the scan order effect (e.g., fatigue, familiarity, etc.) may also confound the drug effect. Some other studies did not set up the pre‐injection baseline [i.e., only post‐placebo and post‐drug conditions were compared; Licata et al., 2013], which may also produce the sham results for the drug effect. As drug and placebo were used in two different days, thus, the possible alteration of the baseline, as reflected by contrasting pre‐placebo with pre‐drug conditions, may introduce the confounding results.
Only one study was run to examine the drug effect on executive control network (ECN) [Boveroux et al., 2010] and salience network (SN) [Guldenmund et al., 2013] respectively, while the other higher‐order brain networks such as bilateral frontoparietal network (FPN), dorsal attention network (DAN), and language network (LAN) were left not investigated. Given that drug‐induced sedation/anesthesia significantly impairs executive control, attention, explicit memory/working memory, and semantic processing/language [Adapa et al., 2014; Buffett‐Jerrott and Stewart, 2002; Davis et al., 2007; Fisher et al., 2006; Millar et al, 2007], as well as the correspondence between these cognitive functions with higher‐order RSNs, we hypothesize that in contrast to placebo, midazolam may significantly reduce the network integrity of higher‐order brain networks, including DMN, ECN, SN as well as bilateral FPN, DAN, and LAN. We will also expect to replicate the increased connectivity within lower‐level brain networks including MN, AN, and VN.
Together, the main goal of the current study is to examine connectivity changes within RSNs as a function of consciousness level. A randomized, double‐blind, placebo‐controlled, cross‐over, counter‐balanced, within‐subject experimental design was adopted in this study, with which the sedation effect of interest could be separated from the false positive results as mentioned above. Independent component analysis (ICA) was utilized to identify the RSNs.
MATERIALS AND METHODS
Participants
Fourteen (six females) right‐handed healthy volunteers (20–30 years old, mean ± SD age was 24 ± 3.2 years) participated in the study. Volunteers were screened by a medical doctor prior to the study with the exclusion criteria of alcohol addiction or drinking frequently, use of psychoactive drugs and drug abuse, history of medical, neurological or psychiatric disease, and taking any regular medications. Specifically, participants were required to refrain from alcohol and caffeine for at least 12 h prior to being scanned. All volunteers gave their written informed consent for a protocol approved by the Institutional Review Boards (IRBs) of Xuanwu Hospital, Capital Medical University. They received monetary compensation for their participation over two sessions.
Study Design
In a randomized, double‐blind, placebo‐controlled, cross‐over, within‐subject design, subjects received midazolam in one session and saline in the other, with the two sessions occurring approximately one week apart. Two sessions were identical except the specific treatment (injection of midazolam [M] or saline [S]) being given. Each session consisted of a pre‐injection (M1 and S1) and a post‐injection imaging section (M2 and S2). The assignment of drug condition to session was counterbalanced and double‐blind, and the assignment of participants to the order of drug administration was randomly determined. These assignments were unknown to subject and staff at the hospital (only the principal investigator knew the assignment).
Prior to entering the scanner, saline was infused at 100 ml/h to maintain infusion through a 22‐gauge intravenous cannula. For the pre‐injection section, the structural scanning was firstly applied to allow subjects to adapt to MRI scan, and then followed by a 7‐min rs‐fMRI scanning. After completion of the pre‐injection section, participants were given ani.v. injection of either midazolam (0.03 mg/kg of the participant's body mass, to a maximum of 2.5 mg) diluted to a total volume of 10 ml or a matching volume of saline through the intravenous cannula within a 2‐min period [Liang et al., 2012; Nyhus and Curran, 2012; Park et al., 2004; Reder et al., 2006]. The drug administration procedure was double‐blinded, thus neither the participants nor the experimenter was told which drug the participants were being given. The participants' level of sedation was estimated by the attending anesthesiologist from the scanner side (YX) using a six‐point modified Observer Assessment of Alertness and Sedation scale [OAA/S; Chernik et al., 1990], which ranges from 0 (i.e., subject does not respond to extrusion of deltoid muscle) to 5 (i.e., subject responds readily to name spoken in normal tone). In this study, all subjects got an OAA/S of 4 in the midazolam session (i.e., subject makes slow response to name spoken in normal tone/sleeping when undisturbed). After drug injection, there was an time interval of about 5 min before scanning, allowing for evaluation of the sedation level, verification of participants' safety, and midazolam concentration reaching a steady state. Then, a 7‐min rs‐fMRI scanning was executed in the post‐injection section. Subjects were not assessed of the sedation level during the MRI scanning.
During the whole experimental session, vital signs including blood pressure, electrocardiogram (ECG), and pulse were continuously monitored using an MR‐compatible monitor. After scanning, subjects were monitored for at least 30 min, and then they were allowed to go home if they had completely recovered evaluated by the attending anesthesiologist (YX). Then, the intravenous cannula was removed and the monitor was disconnected.
MRI Data Acquisition
MRI data acquisition was performed on a Siemens Trio 3‐Tesla scanner (Siemens, Erlangen, Germany). Foam padding and headphones were used to limit head motion and reduce scanner noise. 3D T1‐weighted magnetization‐prepared rapid gradient echo (MPRAGE) sagittal images were collected by using the following parameters: repetition time (TR)/echo time (TE)/inversion time (TI)/flip angle (FA) = 1,600 ms/2.25 ms/800 ms/9°, resolution = 256 × 256 matrix, slices = 192, voxel size = 1 × 1 × 1 mm3. Functional images were obtained using a T2* gradient‐echo echo‐planar imaging (EPI) sequence (TR/TE/FA = 2,000/31 ms/90°, 64 × 64 matrix size in 240 × 240 mm2 field of view (FOV)). Thirty axial slices with a thickness of 4 mm and inter‐slice gap of 0.8 mm were acquired and paralleled to the AC‐PC line. The in‐plane voxel size was 3.75 × 3.75 × 4 mm3. During the fMRI scanning, subjects were instructed to hold still, keep their eyes closed but not fall asleep, and think nothing in particular. The subjects were required to report their status during scanning immediately after the scan.
fMRI Data Preprocessing
Unless otherwise stated, all analyses were conducted using a statistical parametric mapping software package (SPM8, http://www.fil.ion.ucl.ac.uk/spm). The first 10 volumes of the functional images were discarded for the signal equilibrium and participants' adaptation to the scanning noise. The remaining 200 fMRI images were first corrected for within‐scan acquisition time differences between slices and then realigned to the first volume to correct for inter‐scan head motions. No participant had head motion of more than 3 mm maximum displacement in any of the x, y, or z directions and 3° of any angular motion throughout the course of scan. The motion corrected functional volumes were co‐registered to the T1 structural image and spatially normalized to the Montreal Neurological Institute (MNI) space (re‐sampled to 3 mm isotropic voxels). Subsequently, the functional images were spatially smoothed with a Gaussian kernel of 8 × 8 × 8 mm3 full width at half maximum (FWHM) to decrease spatial noise.
ICA Analysis
A group‐level ICA was performed on the all subjects' preprocessed fMRI data using the MICA toolbox [Zhang et al., 2010, http://www.nitrc.org/projects/cogicat/]. To make the result comparable between sections or sessions, all fMRI data, from both sections in both sessions (i.e., four fMRI data for each subject), were fed into the MICA. The previous group‐level ICA method, using three‐stage principle component analysis (PCA) to reduce data dimensions, produced inconsistent results when different subject feeding orders were used [Zhang et al., 2010]. To generate reliable and consistent results, MICA was proposed [Zhang et al., 2010], in which each subject's data were concatenated and ICA decomposition was performed using the Infomax algorithm [Bell and Sejnowski, 1995]; this analysis was performed 100 times, each time with randomized initial values and randomly‐sifted subject feeding orders [Zhang et al., 2010]. The model order, or total component number, was set to 30 according to previous studies [Maneshi et al., 2014; Reineberg et al., 2015; Wang et al., 2014]. Individual components for each scanning section and each session were derived via back‐reconstruction [Calhoun et al., 2001]. The MN, VN, AN, DMN, ECN, SN, DAN, LAN as well as left‐ and right‐sided FPN were identified as components‐of‐interest based on visual comparisons with previous ICA papers [Allen et al., 2011; Damoiseaux et al., 2006; Smith et al., 2009]. They were transformed into z‐score maps for further statistical analyses.
Statistical Analyses
For each component of interest, one sample t‐tests were performed on all subjects' individual spatial (z‐score) maps for M1 and S1, respectively. Binary maps were then generated using voxel‐wise threshold P < 0.01 and cluster size > 99 voxels (i.e., AlphaSim corrected, P < 0.01). Note that they were two‐tailed t‐tests but we only retained positive‐sided results (i.e., t > t‐threshold) as what lots of previous ICA studies have done [Damoiseaux et al., 2008; Filippini et al., 2009; Leech et al., 2012; Roosendaal et al., 2010]. An intersection map was generated based on the two binary maps (for M1 and S1) and served as a mask for following analyses. A 2 × 2 two‐way repeated measure analysis of variance (ANOVA) was conducted on all subjects' individual spatial maps for M1, S1, M2, and S2 within the predefined mask. Two main effects, drug and scan, as well as an interaction (drug‐by‐scan) effect were obtained using an uncorrected P < 0.001 and cluster size >= 10 voxels. The regions of interest (ROIs) with significant interaction effect were picked up and the z‐values within the ROIs for M1, S1, M2, and S2 were plotted using GraphPad Prism 5 (GraphPad Software, Inc, http://www.graphpad.com) for visualization.
RESULTS
To examine the possibility that differences in rs‐fMRI results reflected changes due to the subject's head movement, head displacement parameters estimated by the realignment algorithm were compared between pre‐injection and post‐injection runs (midazolam or saline). This analysis did not reveal any significant head motion difference between the four conditions (ANOVA, P > 0.05).
In this study, we identified 11 of RSNs, including four lower‐level sensory‐related networks (i.e., left sensorimotor network (lSMN), right sensorimotor network (rSMN), primary visual network (PVN) and AN) and seven higher‐order network (i.e., DMN, ECN, SN, left FPN (LFPN), right FPN (RFPN), LAN, and DAN). All of these intrinsic functional networks are of our interest. DMN included the posterior cingulate cortex (PCC; BA 31), bilateral inferior parietal lobule (IPL; BA 39), and dorsomedial prefrontal cortex/ventral anterior cingulate cortex (dMPFC/vACC; BA8/32). ECN consisted of the anterior cingulate cortex (ACC; BA 24/32), bilateral dorsolateral prefrontal cortex (DLPFC; BA 9/46) and inferior frontal gyrus (IFG; BA 45/47), and bilateral posterior parietal cortex (BA 7/39/40). SN contained the dorsal anterior cingulate cortex (dACC; BA 24), pre‐supplementary motor area (BA 6/8), and anterior insula (BA 13). LFPN and RFPN comprehended dorsal premotor cortex (BA 6), and the homolateral lateral frontal cortex and the intra‐parietal sulcus/superior parietal lobule. LAN comprised the bilateral (L>R) posterior inferior frontal cortex (BA 44/45; Broca's area) and superior temporal gyrus (STG; BA 22; Wernicke's area). DAN incorporated the bilateral frontal eye fields (FEF; BA 8) and superior parietal lobule (SPL; BA 5/7). lSMN and rSMN were constituted of the premotor area (BA 6), the homolateral primary motor area (PMA; BA 4) and cerebellum. AN embodied the bilateral superior/middle temporal gyrus (STG/MTG; BA 41/42). PVN was made up of bilateral lingual gyrus/calcarine (BA 18/19). The spatial patterns of these networks were largely consistent with previous reports [Damoiseaux et al., 2006; Fox et al., 2006; Seeley et al., 2007].
What interest us most in the current study is the interaction effect between drug and scan (pre‐injection vs. post‐injection). Figure 1 shows the interaction effect for the lower‐level functional networks, including rSMN, lSMN, PVN, and AN. Voxels with significant differences are presented in hot and rendered on the whole network distribution in green. Plots of the relative functional connectivity strength (z values) are shown for each cluster with significant interaction effect. It was found that all the lower‐level functional networks showed an increased within‐network functional connectivity. As contrast to the saline condition, a cluster located at the right primary motor cortex (PMC) in rSMN was significantly increased by midazolam injection. Similarly, a cluster in the left PMC, two clusters in the bilateral middle temporal areas, and two clusters in the primary visual cortex were significantly increased by midazolam injection for lSMN, AN, and PVN, respectively.
Figure 1.
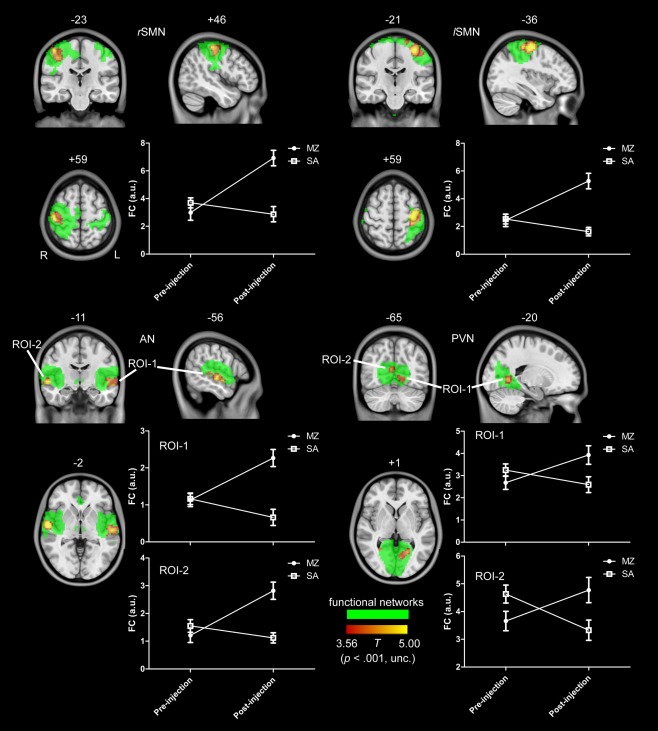
The interaction effect for the lower level functional networks, including rSMN, lSMN, PVN, and AN. Voxels with significant differences are presented in hot, and rendered on the whole network distribution in green. Plots of the relative functional connectivity strength (z values) are shown for each cluster with significant interaction effect. [Color figure can be viewed in the online issue, which is available at http://wileyonlinelibrary.com.]
Figure 2 shows the interaction effect for LAN and LFPN. For the both networks, as compared to the saline condition, some regions were significantly increased, while other regions were significantly decreased by midazolam injection. In LAN, a cluster located in the left cerebellum crus2 was decreased and a region in the left middle temporal cortex was increased by midazolam injection. In LFPN, two regions in the right cerebellum crus1 and left middle frontal cortex were decreased and a cluster in the right angular gyrus was increased by midazolam injection. No activations were found for RFPN and DAN.
Figure 2.
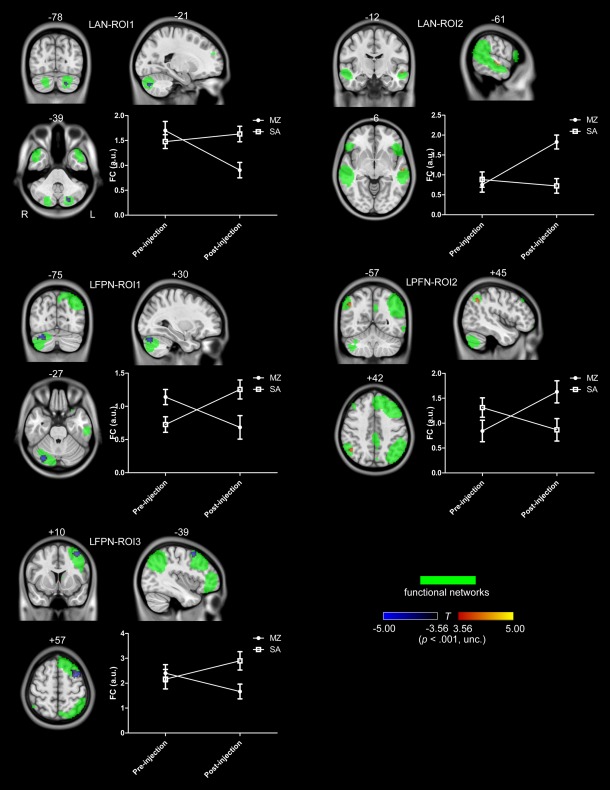
The interaction effect for LAN and LFPN. Voxels with significant differences are presented in hot, and rendered on the whole network distribution in green. Plots of the relative functional connectivity strength (z values) are shown for each cluster with significant interaction effect. [Color figure can be viewed in the online issue, which is available at http://wileyonlinelibrary.com.]
We only identified a small cluster in SN for the interaction effect, and no any activation was found for DMN and ECN with the threshold of uncorrected P < 0.001. In order to compare with previous findings, we further reduced the threshold to uncorrected P < 0.05 to detect the activations and test our hypothesis. As shown in Figure 3, it was found that a PCC cluster in DMN, a DLPFC cluster and a right PPC cluster in ECN was significantly decreased by midazolam injection. While for SN, two areas located in dACC and left anterior insula were increased, and a cluster in vACC was decreased by midazolam injection, as shown in Figure 4.
Figure 3.
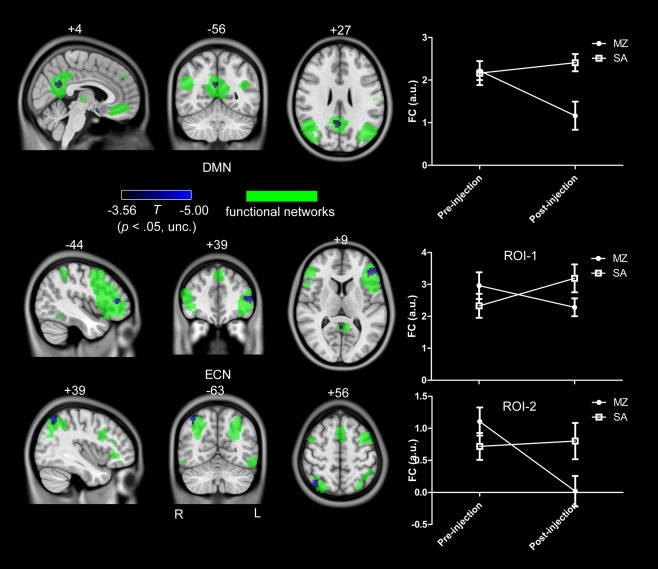
The interaction effect for DMN and ECN (uncorrected P < 0.05). Voxels with significant differences are presented in hot, and rendered on the whole network distribution in green. Plots of the relative functional connectivity strength (z values) are shown for each cluster with significant interaction effect. [Color figure can be viewed in the online issue, which is available at http://wileyonlinelibrary.com.]
Figure 4.
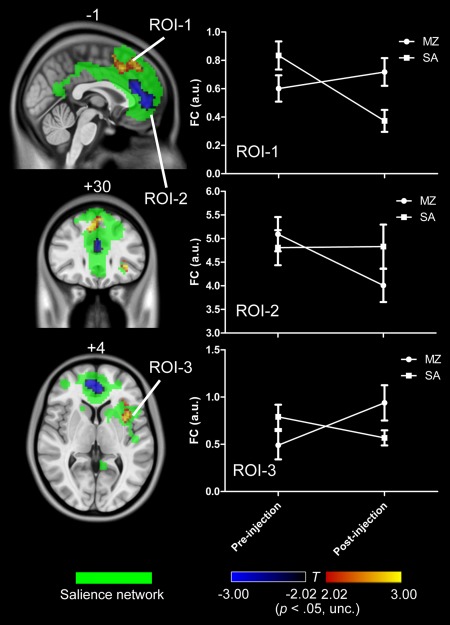
The interaction effect for SN (uncorrected P < 0.05). Voxels with significant differences are presented in hot, and rendered on the whole network distribution in green. Plots of the relative functional connectivity strength (z values) are shown for each cluster with significant interaction effect. [Color figure can be viewed in the online issue, which is available at http://wileyonlinelibrary.com.]
Figure 5 summarizes all the results with significant interaction effect, and shows the relative strength of functional connectivity for all the regions with significant interaction effect. These results indicated that the four lower‐level functional networks, i.e., lSMN, rSMN, PVN, and AN, were significantly increased of their functional connectivity by midazolam injection as contrast to the saline injection, and the changes were relatively larger than those of higher‐level functional networks.
Figure 5.
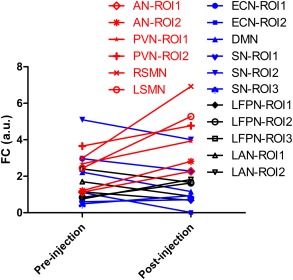
The relative strength of functional connectivity for all the RSNs regions with significant interaction effect. [Color figure can be viewed in the online issue, which is available at http://wileyonlinelibrary.com.]
DISCUSSION
The novelty of the present study lies in the fact that the different effects of midazolam on intrinsic networks were firstly examined by using a randomized, double‐blind, placebo‐controlled, cross‐over, within‐subject design. We found the connectivity patterns of all resting‐state functional networks were persistent, which suggests that functional brain organization is preserved under light sedation. It was also found that the integrity of lower‐level networks (including lSMN, rSMN, AN, and PVN) kept intact, while the integrity of higher‐level networks (including DMN, ECN, SN, LAN, LFPN) was significantly disrupted by light sedation. This dissociation indicates the different effect of light sedation on higher‐level networks and lower‐level networks, and may further have implications to the mechanism of consciousness.
The Experimental Design
As contrast to previous studies, the experimental design in this study (i.e., randomized, double‐blind, placebo‐controlled, cross‐over, within‐subject) can help to separate the true drug effect from the false positive results, which has been illustrated in Figure 6. Different from previous studies (Fig. 6A, B), the interaction effect of drug by scan is of our interest based on our experiment design, as shown in Figure 6C, D. Actually, some inconsistent results reported in the previous studies can be clarified with the current experimental design. Based on the two main effects of drug and injection, we also identified two clusters located at the thalamus, as shown in Figures 7 and 8. Obviously, the two thalamus regions can also be detected if only the drug condition (i.e., pre‐MZ vs. post‐MZ; like Fig. 6A) or the post‐injection condition (i.e., post‐MZ vs. post‐SA; like Fig. 6B) was designed. This suggests that the decreased thalamus connectivity within DMN observed in a previous study [Guldenmund et al., 2013] should be further clarified.
Figure 6.
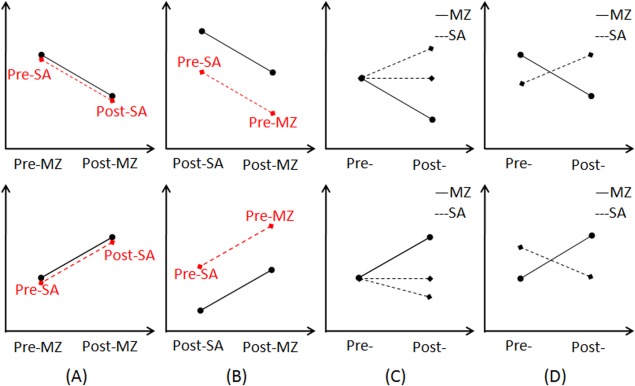
An illustration of the experimental design involved in previous studies, either designing only the uni‐modal drug condition (A) or only the post‐injection condition (B). By contrast, the interaction effect as illustrated in (C) and (D) are of our interest. [Color figure can be viewed in the online issue, which is available at http://wileyonlinelibrary.com.]
Figure 7.
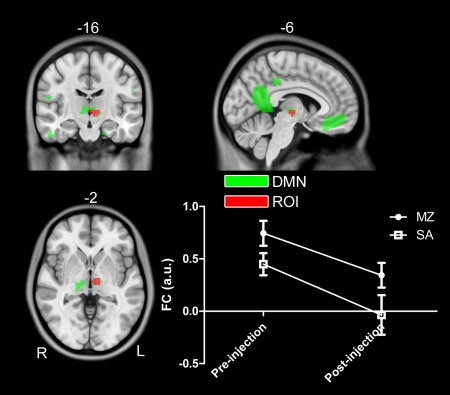
A cluster in the left thalamus within DMN identified in the main effect of drug (i.e., (pre‐MZ + post‐MZ) vs. (pre‐SA + post‐SA)). Voxels with significant differences are presented in hot, and rendered on the whole network distribution in green. The relative functional connectivity strength (z values) of this region is plotted. [Color figure can be viewed in the online issue, which is available at http://wileyonlinelibrary.com.]
Figure 8.
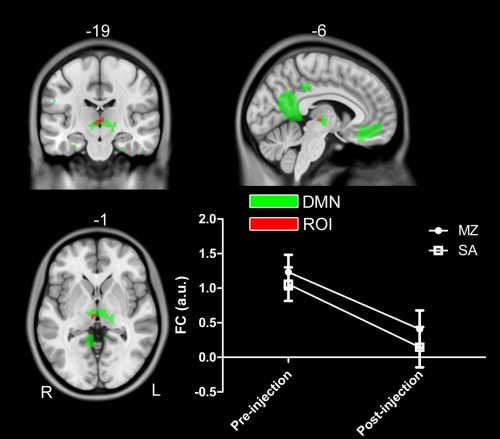
A cluster in the right thalamus within DMN identified in the main effect of scan (i.e., (pre‐MZ + pre‐SA) vs. (post‐MZ + post‐SA)). Voxels with significant differences are presented in hot, and rendered on the whole network distribution in green. The relative functional connectivity strength (z values) of this region is plotted. [Color figure can be viewed in the online issue, which is available at http://wileyonlinelibrary.com.]
In particular, the conjectured psychological activity following the drug injection (midazolam or saline) was widely admitted, which can be revealed by the contrast of pre‐SA vs. post‐SA in the current study, as the experimental design is double‐blind and counter balanced. However, no study ever reported and discussed of this issue due to the limitation of the experimental design. Figure 8 showed an example of the injection related brain alterations, which would confound the drug effect on brain functions. It was argued that the effects induced by injection per se can be attributed to overcome/weaken the influence by midazolam, for subjects were informed of the possible midazolam effects on human. Due to the double‐blind design, subjects did not know what kind of drug (midazolam or saline) was injected each time, which suggest that the injection effect is existed in both midazolam and saline condition. Thus, the injection effect can be excluded from drug effect by controlling for the saline condition (i.e., the interaction effect of drug by scan).
Increased Functional Connectivity Within Lower‐Level Perceptual Networks
The increased within‐network connectivity for the lower‐level perceptual networks are consistent with the previous studies of midazolam‐induced sedation [Greicius et al., 2008; Kiviniemi et al., 2005], as well as sedation induced by other drugs [see a review in MacDonald et al., 2015]. These findings are reliable and replicable; however, fewer studies gave the explanation. As elevated functional connectivity implies synchronization, which can be thought of as an efficient means for controlling information processing by enhancing local communication within connected networks, thus, a direct account for the increased functional connectivity within these lower‐level functional networks is that it may reflect a more highly organized state and facilitate the perceptual information processing [Fries, 2005]. This intuitive account is generally congruent with the notion that enhanced functional connectivity may associate with functional compensation, as reported in many brain disease studies [Liang et al., 2011; Wang et al., 2006]. An alternative explanation considers these drug‐induced increases in functional connectivity as a reflection of functional disruption [Esposito et al., 2010] and hindered neuronal communication [Licata et al., 2013]. Actually, the increased connectivity serving a facilitating role or an inhibiting role is liberal and contradictory among existing publications.
We argue that brain neural systems autonomously compensate for the drug effect as a direct reaction to the drug injection. This compensation thus helps to maintain the sensory processing abilities, which is directly introduced by midazolam effect, and is automatic, autonomous, and unconscious by nature. However, the overcompensation improves the baseline of within‐network functional connectivity, and thus raises the threshold for further recruiting the functional network. This may explain the decline perceptual processing induced by drug injection (e.g., longer response time), particularly under higher dose sedation. It was argued that the higher basal threshold inhibits the brain response to the exerted external perceptual stimulus by increasing the blood oxygen level dependent (BOLD) signal intensity and/or the within‐network connectivity.
Disrupted Network Integrity Within the Higher‐Order Functional Network
Consistent with the hypothesis, this study found that higher‐order brain networks, including DMN, ECN, SN, LFPN, and LAN, showed significantly decreased within‐network connectivity, and SN, LFPN, and LAN also showed elevated within‐network connectivity. Actually, similar disconnections could be detected if the threshold was further reduced for RFPN and DAN. The current study is also congruent with the previous literatures of non‐REM sleep and consciousness disorders [see a review in Heine et al., 2012], which reported that the integrity of higher‐order brain networks was impaired when the consciousness level was reduced. These results suggest that the decreased connectivity within higher‐order networks may represent a correlate of reduced consciousness [Boveroux et al., 2010; Greicius et al., 2008; Guldenmund et al., 2013], and may be responsible for the cognitive decline under sedation/anesthesia, such as episodic memory, executive functions, semantic processing, etc.
The identified elevated functional connectivity in SN, LFPN, and LAN induced by midazolam (but not for saline) may reflect the compensation response to the sedation effect. In particular, it is argued that the overcompensation, which has been hypothesized in sensory‐related lower‐level networks, is not hypothesized to happen for these higher‐order networks. The reason lies in the different neuroanatomical organization between the lower‐level networks and the higher‐order networks. The lower‐level perceptual networks are highly specific, functional singleness, and mainly locally organized, thus relatively easier to recruit more resources to maintain (or compensate for) the functions of the network by increasing the within‐network connectivity. While the higher‐level networks are relatively non‐specific, functional diversity, and consisted of long‐distance connectivity (specifically, the anterior–posterior frontoparietal connectivity), thus are more difficult to survive their function. Taking together, the coexistence of the increased and decreased within‐network connectivity further indicate that the network integrity of higher‐order networks was broken down by midazolam‐induced sedation.
It should be further mentioned that, as shown in Figure 5, the brain networks were differently affected by midazolam, and there were evident dissociations between higher‐ and lower‐order brain networks. Our results have added new evidences to the notion that light sedation impairs first in higher‐order or complex cognitive functions (such as language and semantic processing) before lower‐level perceptual processing is attenuated [MacDonald et al., 2015]. These results are also consistent with the “Last in, first out” principal [Whalley, 2015] and imply that resting‐state brain network connectivity could act as the neuroanatomical signature of consciousness. Moreover, higher‐order brain network connectivity and lower‐level network connectivity may signal the different stage of sedation/anesthesia.
Implications to the Consciousness Model
There are multiple models of consciousness, such as information processing model [Zeki and Bartels, 1999], “all‐or‐none” ignition account [Dehaene et al., 2014], cognitive unbinding theory [Mashour, 2013], and integrated information theory (IIT) [Tononi, 2004, 2012]. Among these theories, IIT of consciousness got more positive evidences and was widely supported recent years [Alkire et al., 2008; Lee et al., 2009; Martuzzi et al., 2010; Schrouff et al., 2011].
Our data broadly supports IIT and has added new evidences to IIT. Keeping with the view of IIT, this study demonstrated that the higher‐order and lower‐level brain networks showed dissociable alterations, and the network integrity of higher‐order brain networks was disrupted. Particularly, the within‐network connectivity of LFPN, RFPN, DAN, and LAN was the first time to be investigated. It should also be emphasized that these results were attained based on a randomized, double‐blind, placebo‐controlled, counter‐balanced, within‐subject design.
However, it does not mean that the current data vote down the other theories. The main reason is that these theoretical accounts are not entirely mutually exclusive and competitive. For example, in accordance with both IIT and global ignition account, anesthetic sedation is considered to associate with fragmentation of within‐network connectivity of distributed networks. Moreover, both IIT and cognitive unbinding theory deem that consciousness depends on the synthesis of neural information.
Limitations
ICA was used in this study to examine rs‐fMRI connectivity during light sedation. Potential bias might occur because the drug itself may cause alterations in the number as well as the spatial configuration of the components present in the brain. The current study divide both the saline condition and the midazolam condition into 30 independent components (ICs), thus, a seeming connectivity increase or decrease may be the result of a changing number of discriminable ICs available in the brain [Guldenmund et al., 2013]. In particular, as midazolam is a kind of psychoactive drugs, the observable resting state under midazolam thus may not be identical to that observed in the saline condition. However, as shown in Figures 1, 2, 3, 4, we identified the majority of the previous reported RSN both for the saline and the midazolam condition. Furthermore, inspection of these components showed that the obtained components for the two conditions were highly similar and overlapped. We have shown all these identifiable networks we obtained to mitigate this limitation. Additionally, increased connectivity in AN with ICA in this study was also found with seed‐based functional connectivity method [Guldenmund et al., 2013]. Therefore, we do not expect that this limitation will affect our results greatly based on these observed facts.
Due to technical limitations, the online cardio‐respiratory data was only monitored as a safety precaution in this study but could not be included in the fMRI data analysis and compared with the rs‐fMRI time series. Given that cardiac and respiratory fluctuations contribute to BOLD signal changes at rest [Birn et al., 2008; Shmueli et al., 2007], our results may be limited to determine the extent of physiological artifacts.
Additionally, this study was restricted to the within‐network connectivity in RSN of primary interest with respect to the well‐known higher‐order and lower‐level brain networks, while the between‐network connectivity was not the focus of this study. It should be noted that work is still in progress to undertake many more investigations with strict experimental design to clarify the neural responses to midazolam‐induced sedation, as many previous findings were inconsistent, even conflicting. Another reason for without consideration of the between‐network connectivity in this study is that the repeatability and reliability of the functional connectivity between RSNs are low. Given the within‐network connectivity patterns have been widely duplicated, still no test‐retest study has been done for the between‐network connectivity at rest.
CONCLUSIONS
This study shows that midazolam‐induced light sedation is associated with the disrupted network integrity in higher‐level brain networks including LFPN and LAN, in addition to previously reported DMN, ECN, and SN breakdown. By contrast, increased connectivity were found in lower‐level brain networks including lSMN, rSMN, AN, and PVN. Different from previous studies, these results were attained based on a randomized, double‐blind, placebo‐controlled, cross‐over, within‐subject experimental design. These findings give insight into understanding how drug‐induced sedation impacts on resting state brain networks, as well as the preserved patterns of brain activity seen in patients with consciousness disorders.
Correction added on 14 October 2015, after first online publication.
REFERENCES
- Adapa RM, Davis MH, Stamatakis EA, Absalom AR, Menon DK (2014): Neural correlates of successful semantic processing during propofol sedation. Hum Brain Mapp 35:2935–2949. [DOI] [PMC free article] [PubMed] [Google Scholar]
- Alkire MT, Hudetz AG, Tononi G (2008): Consciousness and Anesthesia. Science 322:876–880. [DOI] [PMC free article] [PubMed] [Google Scholar]
- Allen EA, Erhardt EB, Damaraju E, Gruner W, Segall JM, Silva RF, Havlicek M, Rachakonda S, Fries J, Kalyanam R, Michael AM, Caprihan A, Turner JA, Eichele T, Adelsheim S, Bryan AD, Bustillo J, Clark VP, Feldstein Ewing SW, Filbey F, Ford CC, Hutchison K, Jung RE, Kiehl KA, Kodituwakku P, Komesu YM, Mayer AR, Pearlson GD, Phillips JP, Sadek JR, Stevens M, Teuscher U, Thoma RJ, Calhoun VD (2011): A baseline for the multivariate comparison of resting‐state networks. Front Syst Neurosci 5:2. [DOI] [PMC free article] [PubMed] [Google Scholar]
- Bell AJ, Sejnowski TJ (1995): An information‐maximization approach to blind separation and blind deconvolution. Neural Comput 7:1129–1159. [DOI] [PubMed] [Google Scholar]
- Birn RM, Smith MA, Jones TB, Bandettini PA (2008): The respiration response function: the temporal dynamics of fMRI signal fluctuations related to changes in respiration. Neuroimage 40:644–654. [DOI] [PMC free article] [PubMed] [Google Scholar]
- Boveroux P, Vanhaudenhuyse A, Bruno MA, Noirhomme Q, Lauwick S, Luxen A, Degueldre C, Plenevaux A, Schnakers C, Phillips C, Brichant JF, Bonhomme V, Maquet P, Greicius MD, Laureys S, Boly M (2010): Breakdown of within‐ and between‐network resting state functional magnetic resonance imaging connectivity during propofol‐induced loss of consciousness. Anesthesiology 113:1038–1053. [DOI] [PubMed] [Google Scholar]
- Buffett‐Jerrott SE, Stewart SH (2002): Cognitive and sedative effects of benzodiazepine use. Curr Pharm Des 8:45–58. [DOI] [PubMed] [Google Scholar]
- Calhoun VD, Adali T, Pearlson GD, Pekar JJ (2001): A method for making group inferences from functional MRI data using independent component analysis. Hum Brain Mapp 14:140–151. [DOI] [PMC free article] [PubMed] [Google Scholar]
- Chernik DA, Gillings D, Laine H, Hendler J, Silver JM, Davidson AB, Schwan EM, Siegel JL (1990): Validity and reliability of the observer's assessment of alertness/sedation scale: Study with intravenous midazolam. J Clin Psychopharmacol 10:244–251. [PubMed] [Google Scholar]
- Damoiseaux JS, Rombouts SARB Barkhof F, Scheltens P, Stam CJ, Smith SM Beckmann CF (2006): Consistent resting‐state networks across healthy subjects. Proc Natl Acad Sci USA 103:13848–13853. [DOI] [PMC free article] [PubMed] [Google Scholar]
- Damoiseaux J, Beckmann C, Arigita E, Barkhof F, Scheltens P, Stam C, Smith S, Rombouts S (2008): Reduced resting‐state brain activity in the “default network” in normal aging. Cereb Cortex 18:1856–1864. [DOI] [PubMed] [Google Scholar]
- Davis MH, Coleman MR, Absalom AR, Rodd JM, Johnsrude IS, Matta BF, Owen AM, Menon DK (2007): Dissociating speech perception and comprehension at reduced levels of awareness. Proc Natl Acad Sci USA 104:16032–16037. [DOI] [PMC free article] [PubMed] [Google Scholar]
- Dehaene S, Charles L, King JR, Marti S (2014): Toward a computational theory of conscious processing. Curr Opin Neurobiol. 25:76–84. [DOI] [PMC free article] [PubMed] [Google Scholar]
- Deshpande G, Kerssens C, Sebel PS, Hu X (2010): Altered local coherence in the default mode network due to sevoflurane anesthesia. Brain Res. 1318:110–121. [DOI] [PMC free article] [PubMed] [Google Scholar]
- Esposito F, Pignataro G, Di Renzo G, Spinali A, Paccone A, Tedeschi G, Annunziato L (2010): Alcohol increases spontaneous BOLD signal fluctuations in the visual network. Neuroimage 53:534–543. [DOI] [PubMed] [Google Scholar]
- Filippini N, MacIntosh BJ, Hough MG, Goodwin GM, Frisoni GB, Smith SM, Matthews PM, Beckmann CF, Mackay CE (2009): Distinct patterns of brain activity in young carriers of the APOE‐ε4 allele. Proc Natl Acad Sci USA 106:7209–7214. [DOI] [PMC free article] [PubMed] [Google Scholar]
- Fisher J, Hirshman E, Henthorn T, Arndt J, Passannante A (2006): Midazolam amnesia and short‐term/working memory processes. Conscious Cogn 15:54–63. [DOI] [PubMed] [Google Scholar]
- Fox MD, Corbetta M, Snyder AZ, Vincent JL, Raichle ME (2006): Spontaneous neuronal activity distinguishes human dorsal and ventral attention systems. Proc Natl Acad Sci USA 103:10046–10051. [DOI] [PMC free article] [PubMed] [Google Scholar]
- Fries P (2005): A mechanism for cognitive dynamics: Neuronal communication through neuronal coherence. Trends Cogn Sci. 9:474–480. [DOI] [PubMed] [Google Scholar]
- Gordon EM, Stollstorff M, Vaidya CJ (2012): Using spatial multiple regression to identify intrinsic connectivity networks involved in working memory performance. Hum Brain Mapp 33:1536–1552. [DOI] [PMC free article] [PubMed] [Google Scholar]
- Greicius MD, Kiviniemi V, Tervonen O, Vainionpää V, Alahuhta S, Reiss AL, Menon V (2008): Persistent default‐mode network connectivity during light sedation. Hum Brain Mapp 29:839–847. [DOI] [PMC free article] [PubMed] [Google Scholar]
- Guldenmund P, Demertzi A, Boveroux P, Boly M, Vanhaudenhuyse A, Bruno MA, Gosseries O, Noirhomme Q, Brichant JF, Bonhomme V, Laureys S, Soddu A (2013): Thalamus, brainstem and salience network connectivity changes during propofol‐induced sedation and unconsciousness. Brain Connect 3:273–285. [DOI] [PubMed] [Google Scholar]
- Heine L, Soddu A, Gómez F, Vanhaudenhuyse A, Tshibanda L, Thonnard M, Charland‐Verville V, Kirsch M, Laureys S, Demertzi A (2012): Resting state networks and consciousness: Alterations of multiple resting state network connectivity in physiological, pharmacological, and pathological consciousness states. Front Psychol 3:295. [DOI] [PMC free article] [PubMed] [Google Scholar]
- Jordan D, Ilg R, Riedl V, Schorer A, Grimberg S, Neufang S, Omerovic A, Berger S, Untergehrer G, Preibisch C, Schulz E, Schuster T, Schröter M, Spoormaker V, Zimmer C, Hemmer B, Wohlschläger A, Kochs EF, Schneider G (2013): Simultaneous electroencephalographic and functional magnetic resonance imaging indicate impaired cortical top‐down processing in association with anesthetic‐induced unconsciousness. Anesthesiology 119:1031–1042. [DOI] [PubMed] [Google Scholar]
- Kiviniemi V, Kantola JH, Jauhiainen J, Hyvarinen A, Tervonen O (2003): Independent component analysis of nondeterministic fMRI signal sources. Neuroimage 19:253–260. [DOI] [PubMed] [Google Scholar]
- Kiviniemi VJ, Haanpää H, Kantola JH, Jauhiainen J, Vainionpää V, Alahuhta S, Tervonen O (2005): Midazolam sedation increases fluctuation and synchrony of the resting brain BOLD signal. Magn Reson Imaging 23:531–537. [DOI] [PubMed] [Google Scholar]
- Lee U, Mashour GA, Kim S, Noh GJ, Choi BM (2009): Propofol induction reduces the capacity for neural information integration: Implications for the mechanism of consciousness and general anesthesia. Conscious Cogn 18:56–64. [DOI] [PubMed] [Google Scholar]
- Leech R, Braga R, Sharp DJ (2012): Echoes of the brain within the posterior cingulate cortex. J Neurosci 32:215–222. [DOI] [PMC free article] [PubMed] [Google Scholar]
- Liang P, Wang Z, Yang Y, Jia X, Li K (2011): Functional disconnection and compensation in mild cognitive impairment: Evidence from DLPFC connectivity using resting‐state fMRI. PLoS One 6:e22153. [DOI] [PMC free article] [PubMed] [Google Scholar]
- Liang P, Manelis A, Liu X, Aizenstein HJ, Gyulai F, Quinlan JJ, Reder LM (2012): Using arterial spin labeling perfusion MRI to explore how midazolam produces anterograde amnesia. Neurosci Lett 522:113–117. [DOI] [PMC free article] [PubMed] [Google Scholar]
- Licata SC, Nickerson LD, Lowen SB, Trksak GH, Maclean RR, Lukas SE (2013): The hypnotic zolpidem increases the synchrony of BOLD signal fluctuations in widespread brain networks during a resting paradigm. Neuroimage 70:211–222. [DOI] [PMC free article] [PubMed] [Google Scholar]
- Liu X, Li S, Hudetz AG (2014): Increased precuneus connectivity during propofol sedation. Neurosci Lett. 561:18–23. [DOI] [PMC free article] [PubMed] [Google Scholar]
- MacDonald AA, Naci L, MacDonald PA, Owen AM (2015): Anesthesia and neuroimaging: Investigating the neural correlates of unconsciousness. Trends Cogn Sci 19:100–107. [DOI] [PubMed] [Google Scholar]
- Maneshi M, Vahdat S, Fahoum F, Grova C, Gotman J (2014): Specific resting‐state brain networks in mesial temporal lobe epilepsy. Front Neurol 5:127. [DOI] [PMC free article] [PubMed] [Google Scholar]
- Martuzzi R, Ramani R, Qiu M, Rajeevan N, Constable RT (2010): Functional connectivity and alterations in baseline brain state in humans. Neuroimage 49:823–834. [DOI] [PMC free article] [PubMed] [Google Scholar]
- Martuzzi R, Ramani R, Qiu M, Shen X, Papademetris X, Constable RT (2011): A whole‐brain voxel based measure of intrinsic connectivity contrast reveals local changes in tissue connectivity with anesthetic without a priori assumptions on thresholds or regions of interest. Neuroimage 58:1044–1050. [DOI] [PMC free article] [PubMed] [Google Scholar]
- Mashour GA (2013): Cognitive unbinding: Aneuroscientific paradigm of general anesthesia and related states of unconsciousness. Neurosci Biobehav Rev 37:2751–2759. [DOI] [PMC free article] [PubMed] [Google Scholar]
- Menon V (2011): Large‐scale brain networks and psychopathology: A unifying triple network model. Trends Cogn Sci 15:483–506. [DOI] [PubMed] [Google Scholar]
- Millar K, Asbury AJ, Bowman AW, Hosey MT, Martin K, Musiello T, Welbury RR (2007): A randomised placebo‐controlled trial of the effects of midazolam premedication on children's postoperative cognition. Anaesthesia 62:923–930. [DOI] [PubMed] [Google Scholar]
- Nyhus E, Curran T (2012): Midazolam‐induced amnesia reduces memory for details and affects the ERP correlates of recollection and familiarity. J Cogn Neurosci 24:416–427. [DOI] [PubMed] [Google Scholar]
- Park H, Quinlan J, Thornton E, Reder LM (2004): The effect of midazolam on visual search: Implications for understanding amnesia. Proc Natl Acad Sci USA 101:17879–17883. [DOI] [PMC free article] [PubMed] [Google Scholar]
- Reder LM, Oates JM, Thornton ER, Quinlan JJ, Kaufer A, Sauer J (2006): Drug induced amnesia hurts recognition, but only for memories that can be unitized. Psychol Sci 17:562–567. [DOI] [PMC free article] [PubMed] [Google Scholar]
- Reineberg AE, Andrews‐Hanna JR, Depue BE, Friedman NP, Banich MT (2015): Resting‐state networks predict individual differences in common and specific aspects of executive function. NeuroImage 104:69–78. [DOI] [PMC free article] [PubMed] [Google Scholar]
- Roosendaal SD, Schoonheim MM, Hulst HE, Sanz‐Arigita EJ, Smith SM, Geurts JJG, Barkhof F (2010): Resting state networks change in clinically isolated syndrome. Brain 133:1612–1621. [DOI] [PubMed] [Google Scholar]
- Schrouff J, Perlbarg V, Boly M, Marrelec G, Boveroux P, Vanhaudenhuyse A, Bruno MA, Laureys S, Phillips C, Pélégrini‐Issac M, Maquet P, Benali H (2011): Brain functional integration decreases during propofol‐induced loss of consciousness. Neuroimage 57:198–205. [DOI] [PubMed] [Google Scholar]
- Seeley WW, Menon V, Schatzberg AF, Keller J, Glover GH, Kenna H, Reiss AL, Greicius MD (2007): Dissociable intrinsic connectivity networks for salience processing and executive control. J Neurosci. 27:2349–2356. [DOI] [PMC free article] [PubMed] [Google Scholar]
- Shmueli K, van Gelderen P, de Zwart JA, Horovitz SG, Fukunaga M, Jansma JM, Duyn JH (2007): Low‐frequency fluctuations in the cardiac rate as a source of variance in the resting‐state fMRI BOLD signal. Neuroimage 38:306–320. [DOI] [PMC free article] [PubMed] [Google Scholar]
- Smith SM, Fox PT, Miller KL, Glahn DC, Fox PM, Mackay CE, Filippini N, Watkins KE, Toro R, Laird AR, Beckmann CF (2009): Correspondence of the brain's functional architecture during activation and rest. Proc Natl Acad Sci USA 106:13040–13045. [DOI] [PMC free article] [PubMed] [Google Scholar]
- Stamatakis EA, Adapa RM, Absalom AR, Menon DK (2010): Changes in resting neural connectivity during propofol sedation. PLoS One 5:e14224. [DOI] [PMC free article] [PubMed] [Google Scholar]
- Tononi G (2004): An information integration theory of consciousness. BMC Neurosci 5:42. [DOI] [PMC free article] [PubMed] [Google Scholar]
- Tononi G (2012): Integrated information theory of consciousness: An updated account. Arch Ital Biol 150:290–326. [DOI] [PubMed] [Google Scholar]
- Wang L, Zang Y, He Y, Liang M, Zhang X, Tian L, Wu T, Jiang T, Li K (2006): Changes in hippocampal connectivity in the early stages of Alzheimer's disease: Evidence from resting state fMRI. Neuroimage 31:496–504. [DOI] [PubMed] [Google Scholar]
- Wang D, Qin W, Liu Y, Zhang Y, Jiang T, Yu C (2014): Altered resting‐state network connectivity in congenital blind. Hum Brain Mapp 35:2573–2581. [DOI] [PMC free article] [PubMed] [Google Scholar]
- Whalley K (2015): Brain aging: Last in, first out? Nat Rev Neurosci 16:2 [Google Scholar]
- Zeki S, Bartels A (1999): Toward a theory of visual consciousness. Conscious Cogn 8:225–259. [DOI] [PubMed] [Google Scholar]
- Zhang H, Zuo XN, Ma SY, Zang YF, Milham MP, Zhu CZ (2010): Subject order‐independent group ICA (SOI‐GICA) for functional MRI data analysis. NeuroImage 51:1414–1424. [DOI] [PubMed] [Google Scholar]
- Zuo XN, Kelly C, Adelstein JS, Klein DF, Castellanos FX, Milham MP (2010): Reliable intrinsic connectivity networks: Test‐retest evaluation using ICA and dual regression approach. Neuroimage 49:2163–2177. [DOI] [PMC free article] [PubMed] [Google Scholar]


