

Abstract
Background & Aims
Accumulating evidence indicates that microRNAs play a role in a number of disease processes including the pathogenesis of liver fibrosis in hepatitis C infection. Our goal is to add to the accruing information regarding microRNA deregulation in liver fibrosis to increase our understanding of the underlying mechanisms of pathology and progression.
Methods
We used next generation sequencing to profile all detectable microRNAs in liver tissue and serum from patients with hepatitis C, stages F1–F4 of fibrosis.
Results
We found altered expression of several microRNAs, in particular, miR‐182, miR199a‐5p, miR‐200a‐5p and miR‐183 were found to be significantly upregulated in tissue from liver biopsies of hepatitis C patients with advanced fibrosis, stage F3 and F4, when compared with liver biopsies from patients with early fibrosis, stages F1 and F2. We also found miR‐148‐5p, miR‐1260b, miR‐122‐3p and miR‐378i among the microRNAs most significantly down‐regulated from early to advanced fibrosis of the liver. We also sequenced the serum microRNAs; however, we were not able to detect significant changes in circulating microRNAs associated with fibrosis stage after adjusting for multiple tests.
Conclusions
Adding measurements of tissue microRNAs acquired during routine biopsies will continue to increase our knowledge of underlying mechanisms of fibrosis. Our goal is that these data, in combination with studies from other researchers and future long‐term studies, could be used to enhance the staging accuracy of liver biopsies and expand the surveillance of patients at increased risk for cancer and progression to advanced fibrosis.
Keywords: fibrosis, hepatitis C, liver, microRNA, sequencing
Abbreviations
- F1, F2, F3, F4
Fibrosis stage 1,2,3,4
- miR
microRNA
- miRNA
microRNA
- ntaX
non‐templated nucleotide additions
Key Points.
microRNAs regulate cell signalling cascades; the role of microRNAs in the pathogenesis of liver fibrosis is not well understood. We used a discovery‐mode approach (sequencing) to examine microRNA deregulation in liver tissue from fibrosis stages 1–4 in hepatitis C patients.
We identified a number of microRNAs that are expressed up or down with fibrosis.
These microRNAs should be highlighted for continued research; to assess their involvement in underlying pathogenesis, as indicators of the disease progression and potentially the development of cancer.
We also assessed microRNA isomiRs and microRNAs detected in serum from patients with liver fibrosis.
Chronic hepatitis C infection is the second most common cause of cirrhosis in the United States with approximately 130 million people infected worldwide and about three million in the United States 1. Approximately 7% of chronic hepatitis C patients develop cirrhosis after 20 years, and increases to 20% after 40 years 2. The leading indication for liver transplantation in the United States is chronic hepatitis C infection 3.
Understanding which microRNAs are deregulated in the development of liver fibrosis and identifying the pathways affected will provide a better understanding of disease mechanisms 4, 5, 6. There have also been reports suggesting that circulating microRNAs may be useful biomarkers of hepatic fibrosis in chronic hepatitis C. Cermelli et al. 7. described a direct correlation between circulating levels of miR‐122, miR‐34a, and to a lesser degree miR‐16, with fibrosis stage among patients with chronic hepatitis C infection. A recent publication from Shrivastava et al. 8, demonstrated that miR‐20a and miR‐92a were significantly up‐regulated in sera from hepatitis C virus‐infected patients; in particular, miR‐20a was expressed at a higher level among patients with late fibrosis. Additionally, some microRNAs may act as biomarkers of downstream cancer risk or progression to cirrhosis; e.g. miR‐183 has been shown to have high expression in diseased liver and its amplification may increase the risk for hepatocellular carcinoma 9, 10, 11.
We identified differentially expressed microRNAs in liver biopsies between early (F0–F2) and advanced (F3–F4) fibrosis stages in hepatitis C patients.
Patients and methods
Subjects
We studied 45 patients with chronic hepatitis C obtained from the Mayo and Scripps Clinics. Thirty‐eight men and seven females, median age 60 years old (range: 50–76). Twelve patients had one liver biopsy sample and 33 patients had two biopsy samples (total samples, 78). Fibrosis stages were determined in liver biopsies according to METAVIR classification 12 and the distribution according to stage was as follows: F0 – I; F1 – 18; F2 – 15; F3 – 14, and F4 – 30 samples. All patients were serum HCV‐RNA positive at the time of liver biopsy.
Approval
All patients were consented at the Mayo and Scripps Clinics and the Institutional Review Boards of both sites approved the collection of the samples.
RNA isolation
For liver samples, the miRVana kit (AM1560; Life Technologies) was used according to the manufacturer's protocol with a slight modification for two phenol chloroform extractions (Burgos et al., 2013). RNA concentrations were measured using a NanoDrop 2000 (Thermo Scientific, Wilmington, DE, USA). Serum samples (1–2 ml) were isolated using the same modified miRVana PARIS protocol (AM1556; Life Technologies) with sequential phenol–chloroform extractions 13.
Sequencing
The Illumina TruSeq small RNA Library preparation Kit (RS‐200‐0048; Illumina, San Diego, CA, USA) was used for sequencing all samples. Kit reagents were used in a half reaction 13. Each sample was assigned one of 48 different indices. Tissue samples were used with the kit at 200 ng, and 15 PCR cycles were used. For serum samples, the total RNA isolated from each sample volume (~1 mL) was used for small RNA sequencing. Indexed samples were run on a gel and purified away from the adaptor band. Fifteen to 20 samples were then pooled and placed on different lanes of a single read Illumina V3 flowcell (GD‐401‐3001). One lane of the flowcell was loaded with PhiX as a reference lane to help with low nucleotide diversity in microRNA.
Sequencing and statistical analysis
Reads that passed quality check were trimmed of their adaptor sequence then entered into the analysis pipeline. Samples were aligned using miRDeep2, and version 21 of mirbase ( 13). The isomiR detection and quantification was conducted through the sRNA workbench tool 14.
The miRNA read counts identified by miRDeep2 were normalized for compositional bias in sequenced libraries and library size using deseq2 15 (version: 1.6.1). Samples with <100 000 mapped microRNA reads were removed from data, resulting in 43 tissue and 78 serum samples. Tissue: Stage F1 (n = 9), Stage F2 (n = 9), Stage F3 (n = 10), Stage F4 (n = 15); Serum: No Fibrosis (n = 3), Stage F1 (n = 14), Stage F2 (n = 16), Stage F3 (n = 15), Stage4 (n = 30). Differential expression of miRNA read counts was performed using the deseq2 (v1.6.1) package. For the differential expression analyses, miRNAs with average <5 counts across all samples were discarded.
Ordinal logistic regression and one‐way anova were used to assess monotonic relationships between fibrosis stage and normalized miRNA counts using the package ordinal (version: 2014.11‐14). A graphical method for assessing the parallel slopes assumption was used to check ordinal logit requirements. Parameter confidence intervals were based on the profile likelihood function, and the estimates in the output are given in units of ordered log odds. All analyses were performed using r version 3.1.1 16.
We fitted a negative binomial generalized linear model for each genotype and carried out a likelihood ratio test in order to test for presence of differentially expressed microRNAs between any of the fibrosis stage groups. We found no differentially represented miRNAs with relationship to viral genotypes in varying fibrosis stages.
qPCR
TaqMan MicroRNA Reverse Transcription Kit and primers for miR‐183‐5p, miR‐182‐5p, miR‐199a‐5p and miR‐148a‐5p were run according to the manufacturer's protocol (Life Technologies) using an ABI 7900HT Fast Real‐Time PCR system (Life Technologies). All qPCR reactions were performed in triplicate. Cycle threshold values for each target microRNA were normalized against U6. 2ΔΔCt was used to calculate the fold change of microRNA expression levels between (F0–F2) and advanced (F3–F4) fibrosis stages. A representative nine samples were chosen from each group for qRT‐PCR validation. A t‐test (two tailed, type 2) was performed to assess statistical significance between the normalized Ct values for the two groups.
Results
Using next generation sequencing technologies, we profiled microRNAs in liver biopsy samples from patients with hepatitis C infection. The degree of liver fibrosis was assessed by METAVIR criteria at Scripps. We obtained tissue samples from nine patients with stage F1 liver fibrosis, nine patients with stage F2, 10 patients with fibrosis stage F3, and 15 patients with stage F4. Thirty‐three subjects had two liver biopsy samples. We first tested to see if there was an interaction between miRNAs and viral genotype. We did not find microRNAs in the tissue samples that were expressed differently with viral genotype, nor in association with viral genotype and fibrosis stage.
For tissue samples, the median number of reads mapped to microRNA per sample was 504 351, with a range from 121 504 to 5 708 614. The total number of microRNAs that were detected in liver tissue were 658, and those with a normalized count of ≥5 were 301. We obtained the following serum samples: three patients with stage F0 liver fibrosis, 13 patients with stage F1 liver fibrosis, 17 patients with stage F2, 15 patients with fibrosis stage F3 and 30 patients with stage F4. For the serum samples, the median number of reads mapped to microRNA was 2 084 067, with a range from 159 783 to 10 833 093. The total number of microRNAs that were detected in the serum were 549, and those with a normalized count of ≥5 were 397. Normalized counts for microRNAs detected in serum or tissue samples are displayed in Tables S1 and S2, microRNAs overlapping in at least 30% of tissue and serum samples are highlighted.
We combined the microRNA data from liver biopsies classified as fibrosis F1 and F2 (early fibrosis) separately from F3 and F4 (advanced fibrosis). There were 18 samples in the early and 25 samples in the advanced fibrosis groups. We compared the microRNA between these two groups and corrected for multiple tests using Benjamini–Hochberg. There are 37 microRNAs differentially expressed between the two groups, Table 1 contains 25 significant microRNAs with a log2‐fold change >0.6 or <−0.6. The remaining 12 microRNAs with smaller log2‐fold changes are listed in Table S3. We also assessed microRNAs differentially expressed between the two most extreme fibrosis stages, F1 and F4, 44 microRNAs were significantly different (Table S4).
Table 1.
Differentially expressed microRNAs in tissue between early (F1 and F2) and advance (F3 and F4) fibrosis. microRNAs listed have log2 fold change >0.60 and <−0.60. Significant microRNAs with a smaller fold change are listed in Table S2
| microRNA | Log2‐fold change | P‐value | Adjusted P‐value |
|---|---|---|---|
| miR‐183‐5p | 1.2 | 3.20E‐07 | 1.10E‐04 |
| miR‐182‐5p | 1.04 | 9.09E‐07 | 1.56E‐04 |
| miR‐200a‐5p | 0.95 | 3.21E‐06 | 3.68E‐04 |
| miR‐199a‐5p | 0.74 | 1.16E‐05 | 1.00E‐03 |
| miR‐429 | 0.89 | 4.54E‐05 | 3.13E‐03 |
| miR‐148a‐5p | −0.71 | 5.83E‐05 | 3.34E‐03 |
| miR‐1260b | −0.8 | 1.17E‐04 | 5.73E‐03 |
| miR‐199a‐3p | 0.64 | 2.09E‐04 | 7.20E‐03 |
| miR‐199b‐3p | 0.64 | 2.09E‐04 | 7.20E‐03 |
| miR‐200b‐3p | 0.7 | 1.94E‐04 | 7.20E‐03 |
| miR‐34c‐5p | 1.02 | 2.63E‐04 | 7.54E‐03 |
| miR‐150‐5p | 0.72 | 3.41E‐04 | 8.50E‐03 |
| miR‐200b‐5p | 0.85 | 3.46E‐04 | 8.50E‐03 |
| miR‐1260a | −0.74 | 5.57E‐04 | 1.19E‐02 |
| miR‐200a‐3p | 0.85 | 5.48E‐04 | 1.19E‐02 |
| miR‐122‐3p | −0.65 | 7.27E‐04 | 1.26E‐02 |
| miR‐148a‐3p | −0.66 | 7.67E‐04 | 1.26E‐02 |
| miR‐378i | −0.76 | 6.81E‐04 | 1.26E‐02 |
| miR‐10a‐5p | 0.73 | 1.13E‐03 | 1.76E‐02 |
| miR‐181d‐5p | 0.61 | 1.38E‐03 | 1.90E‐02 |
| miR‐5588‐5p | −0.83 | 1.56E‐03 | 1.98E‐02 |
| miR‐1296‐5p | −0.72 | 2.95E‐03 | 3.09E‐02 |
| miR‐192‐3p | −0.65 | 2.84E‐03 | 3.09E‐02 |
| miR‐31‐5p | 0.74 | 3.06E‐03 | 3.09E‐02 |
| miR‐452‐5p | 0.62 | 2.98E‐03 | 3.09E‐02 |
The Volcano Plot in Fig. 1A displays significant microRNAs and their relative fold changes when comparing early (F1 and F2) to advanced (F3 and F4) fibrosis. miR‐182 and miR‐183 (green, log2‐fold change >1 and corrected P‐value <0.05) and miR‐200a‐5p and miR‐199a‐5p (blue, log2‐fold change >0.6 and corrected P‐value <0.05) have the greatest significance and fold change. miR‐148a‐5p, also pointed out in Fig. 1A, is expressed significantly lower in advanced fibrosis compared with early fibrotic stages. Box and whisker plots of normalized count data between early and advanced fibrosis for five microRNAs are displayed in Fig. 1B.
Figure 1.
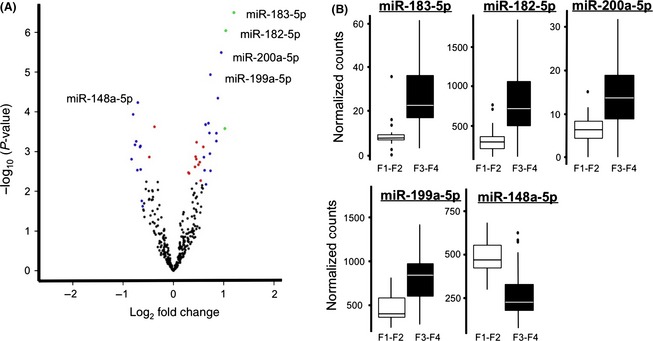
Assessment of microRNAs differentially expressed in liver samples. (A) A Volcano plot of samples from F1 and F2 (early) liver fibrosis compared with samples from F3 and F4 (advanced fibrosis). Log10 P‐value on the y‐axis and log2‐fold change on the x‐axis. microRNAs with a log2‐fold change >1 and significance <0.05 are indicated in green, microRNAs with fold change <−0.6 and >0.6 and adjusted P‐value <0.05 are blue, smaller fold changes with adjusted P‐value <0.05 are red. (B) Box and whisker plots for miR‐183‐5p, miR‐182‐5p, miR‐200a‐5p, and miR‐199a‐5p, the four microRNAs with the smallest P‐values and largest fold changes. We also included miR‐148a‐5p, the most significantly down‐regulated microRNA. The graph depicts the median and quartiles of the normalized counts for each group.
We wanted to verify the sequencing results using a second assay platform, qRT‐PCR. From liver tissue we chose the following microRNAs with increased expression in advanced fibrosis: miR‐183‐5p, miR‐182‐5p, miR‐199a‐5p and with decreased expression in advanced fibrosis, miR‐148a‐5p. We did not attempt to validate miR‐200a‐5p by qRT‐PCR, the average count across samples was low, ~11. Eighteen samples were reverse transcribed using specific TaqMan microRNA probes for the four selected microRNAs. Nine representative samples from the F1 and F2 group were compared with nine samples selected from the F3 and F4 group. Figure 2A shows the log2‐fold change between early and advanced fibrosis calculated using 2ΔΔCt and U6 as the reference for normalization. microRNAs with an asterisk, miR‐183‐5p, miR148‐5p and miR199a‐5p, were significantly different between early and advanced fibrosis (P ≤ 0.05, t‐test). Although the trend was the same as exhibited in the sequencing data, the change in the microRNA expression levels between early and advanced fibrosis was not significant for miR‐182‐5p in this subset of samples (P ≤ 0.34; Fig. 2B).
Figure 2.
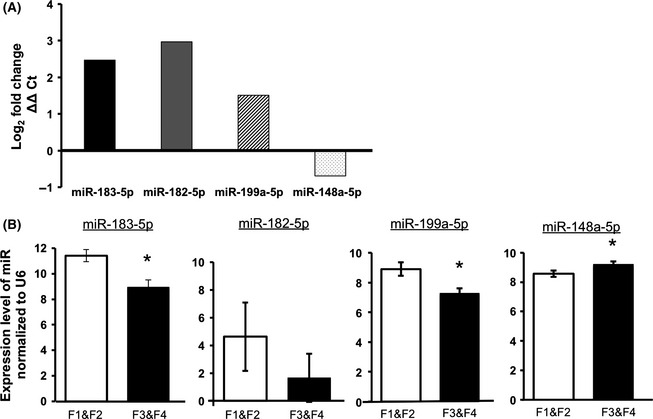
qRT‐PCR validation of four microRNAs with highest significance and fold change in comparison of F1 and F2 (early) with F3 and F4 (advanced) fibrosis. (A) Calculated fold change for microRNAs 183‐5p, 182‐5p, miR‐199a‐5p and miR‐148a‐5p. Fold changes were calculated using 2ΔΔCt. U6 was used for normalization in all samples. (B) Average Ct values normalized to U6 and the standard error of the mean. *indicates qRT‐PCR changes that are statistically significant by t‐test (P ≤ 0.05).
We assessed the data using ordinal logistic regression analysis to determine if microRNA expression changes, either up or down, behaved in a progressive manner with increasing fibrosis from F1 to F4. We assessed all microRNAs across each stage and found 35 microRNAs that indicated an ordered change in expression after multiple corrections (Table 2). miR‐182‐5p, miR‐183‐5p, miR‐199a‐5p, and miR‐148‐5p were among the significant microRNAs that showed monotonic trend, continuous change with increasing fibrosis (Fig. S1).
Table 2.
Ordinal logistic regression. Ordinal logistic regression was implemented in order to detect miRNAs exhibiting monotonic expression trend with fibrosis advancement. We report miRNAs with the lowest Akaike Information Criterion value significant at adjusted P‐value <0.05
| miRNA | Estimate | SE | AIC | Adjusted P‐value |
|---|---|---|---|---|
| miR‐148a‐5p | −0.01 | 0.00 | 96.73 | 6.04E‐03 |
| miR‐122‐3p | −0.01 | 0.00 | 103.87 | 1.42E‐02 |
| miR‐183‐5p | 0.12 | 0.03 | 101.37 | 1.42E‐02 |
| miR‐199a‐5p | 0.01 | 0.00 | 103.30 | 1.42E‐02 |
| miR‐199a‐3p | 0.00 | 0.00 | 108.55 | 1.98E‐02 |
| miR‐199b‐3p | 0.00 | 0.00 | 108.55 | 1.98E‐02 |
| miR‐23a‐3p | 0.01 | 0.00 | 108.76 | 1.98E‐02 |
| miR‐429 | 0.02 | 0.01 | 106.57 | 1.98E‐02 |
| miR‐497‐5p | 0.03 | 0.01 | 106.25 | 1.98E‐02 |
| miR‐92a‐3p | 0.00 | 0.00 | 109.00 | 1.98E‐02 |
| miR‐181a‐2‐3p | 0.04 | 0.01 | 110.87 | 2.21E‐02 |
| miR‐181b‐5p | 0.00 | 0.00 | 110.93 | 2.21E‐02 |
| miR‐181c‐3p | 0.18 | 0.05 | 109.75 | 2.21E‐02 |
| miR‐122‐5p | 0.00 | 0.00 | 111.29 | 2.38E‐02 |
| miR‐181d‐5p | 0.07 | 0.02 | 109.86 | 2.42E‐02 |
| miR‐192‐5p | 0.00 | 0.00 | 110.69 | 2.42E‐02 |
| miR‐200b‐3p | 0.01 | 0.00 | 111.10 | 2.42E‐02 |
| miR‐30c‐1‐3p | −0.14 | 0.04 | 112.29 | 2.79E‐02 |
| miR‐150‐5p | 0.00 | 0.00 | 108.81 | 2.79E‐02 |
| miR‐181a‐5p | 0.00 | 0.00 | 112.93 | 2.79E‐02 |
| miR‐181c‐5p | 0.01 | 0.00 | 111.80 | 2.79E‐02 |
| miR‐182‐5p | 0.00 | 0.00 | 111.40 | 2.79E‐02 |
| miR‐192‐3p | −0.21 | 0.06 | 111.98 | 2.79E‐02 |
| miR‐194‐5p | 0.00 | 0.00 | 113.31 | 2.79E‐02 |
| miR‐195‐5p | 0.01 | 0.00 | 111.32 | 2.79E‐02 |
| miR‐455‐5p | −0.06 | 0.02 | 112.41 | 2.79E‐02 |
| miR‐195‐3p | 0.07 | 0.02 | 112.10 | 2.80E‐02 |
| miR‐214‐3p | 0.03 | 0.01 | 111.19 | 2.80E‐02 |
| miR‐200a‐5p | 0.16 | 0.05 | 111.85 | 2.94E‐02 |
| miR‐101‐3p | 0.00 | 0.00 | 113.66 | 3.23E‐02 |
| miR‐148a‐3p | 0.00 | 0.00 | 112.71 | 3.31E‐02 |
| miR‐194‐3p | −0.11 | 0.03 | 113.92 | 3.31E‐02 |
| miR‐378i | −0.04 | 0.01 | 112.67 | 3.59E‐02 |
| miR‐215‐5p | −0.01 | 0.00 | 112.21 | 3.63E‐02 |
| let‐7e‐5p | 0.00 | 0.00 | 113.76 | 4.01E‐02 |
| miR‐1468‐5p | −0.03 | 0.01 | 114.97 | 4.01E‐02 |
| miR‐1295b‐5p | −0.24 | 0.08 | 115.33 | 4.31E‐02 |
| miR‐132‐3p | 0.07 | 0.02 | 113.40 | 4.31E‐02 |
| miR‐214‐5p | 0.05 | 0.02 | 114.54 | 4.57E‐02 |
| miR‐221‐3p | 0.01 | 0.01 | 115.35 | 4.63E‐02 |
We next examined serum samples to determine whether or not we could detect significant microRNA changes that indicated fibrosis stage. We assessed microRNAs that were detectable in both serum and liver (number = 495). We compared microRNA expression levels in patients with F0, F1 and F2 (combined, n = 33) to microRNA expression levels in patients with F3 and F4 (n = 45). We found 34 microRNAs that had P‐value <0.05, however, none of them survived Benjamini‐Hochberg correction for multiple testing (Table S5).
By using next generation sequencing as our discovery platform, we were able to investigate the number and potential significance of variations in the mature microRNA sequence – isomiRs. We measured microRNA length heterogeneities and RNA editing. We categorized isomiRs as the following: 3′ length variants (lv3p), 5′ length variants (lv5p) and non‐templated nucleotide additions (ntaA, ntaT, ntaC, ntaG). To provide a more detailed description of microRNA length heterogeneities, we indicated the number of nucleotides added (+) or trimmed (−) from the 3′ or 5′ end in the isomiR categories. Of 37 differentially expressed miRNAs between early and advanced fibrosis in liver, 10 were differentially expressed for at least one of the isomiR categories: 199b‐3p, 148a‐3p, 150‐5p, 122‐3p, 199a‐5p, 10a‐5p, 92a‐3p, 195‐5p, 181c‐5p, 181a‐5p (Table 3). Several miRNAs with no evidence of differential expression for the exact canonical sequence were significantly differentially expressed for one or more isomiR categories (Table 3). For some microRNAs, when we combined all the counts for isomiRs and the canonical sequence, they became differentially expressed. While the functional consequences of these nucleotide changes are not yet fully understood, we report our findings in order to increase the growing knowledgebase on these types of microRNA modifications.
Table 3.
microRNAs in tissue differentially expressed solely for one or more isomiR categories between early and advanced fibrosis. IsomiR categories incorporate 3′ length variants (lv3p), 5′ length variants (lv5p) and non‐templated nucleotide additions (ntaA, ntaT, ntaC, ntaG) with +/− indicating additions and trimming respectively. Additional isomiR data can be found in Table S6
| microRNA | Log2‐fold change | P‐value | Adjusted P‐value | IsomiR category |
|---|---|---|---|---|
| miR‐194‐5p | −1.48 | 4.57E‐04 | 2.06E‐02 | lv3p−4 |
| let‐7e‐5p | 1.10 | 1.43E‐03 | 4.22E‐02 | lv3p+1 |
| miR‐122‐5p | −1.26 | 1.03E‐03 | 4.22E‐02 | lv3p+1 |
| miR‐21‐5p | 0.33 | 1.90E‐03 | 4.37E‐02 | lv3p+1 |
| miR‐192‐5p | −1.07 | 1.29E‐04 | 1.44E‐02 | ntaG+1 |
| miR‐142‐5p | 1.39 | 3.17E‐04 | 1.87E‐02 | ntaT+1 |
| miR‐122‐5p | −1.26 | 7.38E‐04 | 2.42E‐02 | ntaT+1 |
| miR‐30e‐5p | −0.85 | 6.39E‐04 | 2.42E‐02 | ntaT+1 |
| miR‐143‐3p | 1.04 | 1.81E‐03 | 3.56E‐02 | ntaT+1 |
| miR‐192‐5p | −1.00 | 1.99E‐03 | 3.67E‐02 | ntaT+1 |
| miR‐122‐5p | −1.49 | 1.11E‐04 | 9.04E‐03 | ntaT+2 |
| miR‐143‐3p | 1.38 | 6.40E‐05 | 9.04E‐03 | ntaT+2 |
| miR‐192‐5p | −1.09 | 6.26E‐04 | 1.98E‐02 | ntaT+2 |
| let‐7f‐5p | 1.56 | 5.21E‐07 | 5.42E‐05 | ntaT+3 |
| miR‐143‐3p | 1.49 | 2.27E‐05 | 1.18E‐03 | ntaT+3 |
| let‐7 g‐5p | 1.48 | 8.80E‐04 | 1.53E‐02 | ntaT+3 |
| miR‐192‐5p | −1.34 | 1.55E‐03 | 2.30E‐02 | ntaT+3 |
Discussion
We identified 37 microRNAs, 26 up and 11 down‐regulated, between early and advanced fibrotic stages in liver biopsies from patients with chronic hepatitis C. Early fibrosis were METAVIR classification F1 and F2 biopsy samples grouped together. Samples classified as F3 and F4 were grouped as advanced fibrosis. In serum, we were not able to identify microRNAs that were significant after adjusting for multiple comparisons (Table S5).
We report isomiR changes, single and multiple nucleotide changes from the canonical sequence. The impact of these single nucleotide changes on microRNA function is not well understood. With respect to microRNA expression analysis, it is also not clear how these single nucleotide changes might alter microRNA measurements using other methods such as microarray and qRT‐PCR. It might cause some difficulties comparing microRNA expression levels across platforms that are sensitive or insensitive to these changes.
We focused our attention on four microRNAs with the lowest P‐values, miR‐183‐5p, miR‐182‐5p, miR‐200a‐5p and miR‐199a‐5p, all with elevated expression levels, as well as miR‐148a‐5p that had significantly decreased expression when comparing early and advanced liver fibrosis. Each of these selected microRNAs demonstrated similar direction and fold changes when assessed with qRT‐PCR. In addition, we used ordinal logistic regression to examine the progressive increase or decrease in each of these microRNAs with advancing fibrosis severity. Each of these microRNAs becomes increasingly dysregulated in hepatic tissue with progressive fibrosis (adjusted P‐value < 0.05), except miR‐200a‐5p (Fig. S1).
Very little is known about which microRNAs play a role in the pathogenesis of liver fibrosis, or increase the risk for downstream complications, such as hepatic cancer. Using pathway analysis to get a better understanding of the function of microRNAs in liver fibrosis can be very difficult to interpret. Not only can a single microRNA regulate many mRNA targets, but there is also a large false positive rate for the prediction of microRNAs and mRNA targets. There are currently 2588 mature human microRNAs listed in miRBase. Ingenuity Pathway Analysis (Qiagen http://www.ingenuity.com), lists 114 human microRNAs as having experimentally validated target mRNAs, most microRNAs are linked to several mRNA targets. We chose to focus our discussion on a few microRNAs identified in these experiments and the published literature that strengthens their link to liver disease. While this is not an exhaustive list, and there are many studies that found different microRNAs to be important in liver fibrosis, the microRNAs reported here have been found to be associated with liver damage in several papers. Figure 3 is a network diagram describing the relationships for each of the miRNAs and the available information from the literature and the association of each one with liver disease, injury or cancer.
Figure 3.

Network Analysis for the five miRNAs that had the highest fold change and lowest P‐value. Using the current literature and what is known about these miRNAs with respect to liver disease, fibrosis and hepatocellular carcinoma, we created a network diagram. The diagram indicates experimentally validated biological processes, gene targets and disease pathways affected by these miRNAs.
miR‐182
Several papers have linked high miRNA‐182 expression levels to hepatocellular carcinoma 17, 18 or liver metastasis 19, 20. Metastasis suppressor 1 18, 21, 22 was identified as a target for miR‐182 in liver. MicroRNA expression measured in mouse models of alcoholic and non‐alcoholic steatohepatitis 23 found miR‐182 and miR‐183 (both identified in our study) to be down‐regulated in alcoholic liver and up‐regulated in non‐alcoholic fatty liver. Murakami et al. 24. compared liver samples from patients with chronic hepatitis and cirrhosis and found miR‐182 to be one of the most differentially expressed microRNAs, up‐regulated in chronic hepatitis. In the current paper, we also found miR‐182 to increase with fibrosis stage in patients with chronic hepatitis C.
miR‐183‐5p
Wojcicka et al. 5. examined microRNAs in cirrhotic liver and hepatocellular carcinoma. miR‐183‐5p and miR‐199a‐5p (both significantly up‐regulated with advanced fibrosis in our data) were among the top ten most differentially expressed microRNAs when comparing tumour and normal tissue. miR‐183‐5p was approximately four‐fold more highly expressed in tumour samples. miR‐183 was also found to be significantly up‐regulated in hepatocellular carcinoma samples from patients with chronic hepatitis C 25. In a larger study examining liver biopsy samples from normal controls and patients with hepatitis C, hepatitis B, cirrhosis, hepatocellular carcinoma, they found that miR‐183 increased with increasing liver damage, highest in cirrhosis and cancer. Goeppert et al. 10. found miR‐183 to be up‐regulated in cirrhotic liver and premalignant lesions, and went on to investigate potential mRNA targets for miR‐183. They found AKAP12, a tumour suppressor gene found to be down‐regulated in cirrhotic liver, premalignant lesions and hepatocellular carcinoma. miR‐183 was found to be up‐regulated in hepatocellular carcinoma samples in a study by Li et al. 9, where they also found that Programmed Cell Death 4, a proapoptotic molecule was targeted by miR‐183.
miR‐200a‐5p
In our studies the expression level of miR‐200a was very low – average read counts per sample were 11. We observed a small significant increase with fibrosis stage (Table 1, Fig. 1). Several papers implicate miR‐200a in liver damage and cancer, but there are discrepancies in the level and direction of expression. Perhaps these differences in findings are, in part, a reflection of the overall low abundance we found for this microRNA in tissue. In many cases, reduced expression of miR‐200a predicted prognosis 26, 30 and expression inversely correlated with tumour size 31. Dhayat et al. 32. found that miR‐200a was significantly decreased in patients with hepatocellular carcinoma and in cirrhotic tissue from patients with hepatocellular carcinoma compared with patients with cirrhosis. However, other papers found increased levels of miR‐200a promoting hepatocellular carcinoma progression 33. In a rat model of non‐alcoholic fatty liver disease, researchers found miR‐200a to be significantly up‐regulated in rats that received a high‐fat diet 27, 34, 35. Feng et al. 27. also showed that human hepatocytes treated with free fatty acids and inflammatory factors had increased miR‐200a levels. miR‐200a was found to be associated with epithelial‐mesenchymal transition and invasion when overexpressed 26, 36. Identified mRNA targets of miR‐200a were MACC1 (metastasis associated in colon cancer1) 27, CTNNB1 (catenin, cadherin‐associated protein beta1) 28, 29; TGF‐β2 (transforming growth factor beta2) 29 and MDM2 (E3 Ubiquitin‐protein ligase) 37.
miR‐199a‐5p
There are several papers describing the relevance of both miR‐199a‐5p and miR199a‐3p in liver disease and injury, however, there were variable findings with respect to expression levels of these microRNAs in the literature. Murakami et al. 38. found that miR‐199a regulates hepatitis C virus replication. Several papers found the expression of miR‐199a to be down with injury and disease 19, 21, 31, 39, 40, 41, 42, 43, and in other papers miR‐199a was found to be up‐regulated in hepatocellular carcinoma and liver injury 44, 45, 46 and increased with liver fibrosis progression 6, 47. Experimentally identified targets of miR199a‐5p in liver disease were SMARCA4 (swi/snf‐related, matrix‐associated, actin‐dependent regulator of chromatin, subfamily a, member 4) and MST1 (macrophage stimulating 1) 48, MMP‐9 (matrix metallopeptidase 9) 44, GRP78 (glucose‐regulated protein, 78 kDa), endoplasmic reticulum to nucleus signalling 1, activating transcription factor 6 45, clathrin heavy chain 21, ATG7 (autophagy related 7) 49, hypoxia inducible factor‐1α 41 and discoidin domain receptor‐1 43.
miR‐148a‐5p
In our study, miR‐148a‐5p was the most significantly down‐regulated microRNA in advanced fibrosis. In a recent publication, Pan et al. 50. found miR‐148a‐5p was down‐regulated in hepatocellular carcinoma and expression was correlated with tumour stage. Several other papers found down‐regulation of miR‐148a 51, 52, targeting ubiquitin specific protease 4 and sphingosine 1‐phosphate receptor 1 53, genes in the Met/Snail signalling pathway 54, Wnt1 55, DNA methyltransferase 52, 56 and c‐Myc 57. In a large study examining two subtypes of hepatocellular carcinoma 58, miR‐148a was down‐regulated in both cancer types compared with controls, and the more aggressive subtype had significantly less miR‐148a expression. ACVR1 (activin A receptor, type1) was identified as a downstream target in that study. Rieger et al. 59. found miR‐148a down‐regulated in cholestatic tissue. Xu et al. 60. found that miR‐148a is repressed by hepatitis B virus X protein, and this in turn allows enhanced expression of Hematopoietic pre‐B cell leukaemia transcription factor‐interacting protein. miR‐148a was also found to be down‐regulated in liver injury and rejection with liver transplantation 61 and down‐regulated in hepatoblastoma 62.
In conclusion, our data identified several microRNAs that are altered with worsening liver fibrosis in chronic hepatitis C patients. These data provide further support for the role of specific microRNAs in the pathogenesis of fibrosis and focuses attention on identifying microRNAs that could be used to predict clinical outcomes and complications.
Supporting information
Additional Supporting Information may be found at onlinelibrary.wiley.com/doi/10.1111/liv.12919/suppinfo
Acknowledgements
Financial support: Institutional Funding Mayo/TGen.
Conflict of interest: The authors do not have any disclosures to report.
Liver Int. 2016; 36: 334–343. DOI: 10.1111/liv.12919
Handling Editor: Zobair Younossi
References
- 1. Alter MJ. Epidemiology of hepatitis C virus infection. World J Gastroenterol 2007; 13: 2436–41. [DOI] [PMC free article] [PubMed] [Google Scholar]
- 2. Dore GJ, Freeman AJ, Law M, Kaldor JM. Is severe liver disease a common outcome for people with chronic hepatitis C? J Gastroenterol Hepatol 2002; 17: 423–30. [DOI] [PubMed] [Google Scholar]
- 3. Chen SL, Morgan TR. The natural history of hepatitis C virus (HCV) infection. Int J Med Sci 2006; 3: 47–52. [DOI] [PMC free article] [PubMed] [Google Scholar]
- 4. Lee JE, Yi R. Highly efficient ligation of small RNA molecules for microRNA quantitation by high‐throughput sequencing. J Vis Exp 2014; 18: e52095. [DOI] [PMC free article] [PubMed] [Google Scholar]
- 5. Wojcicka A, Swierniak M, Kornasiewicz O, et al Next generation sequencing reveals microRNA isoforms in liver cirrhosis and hepatocellular carcinoma. Int J Biochem Cell Biol 2014; 53: 208–17. [DOI] [PubMed] [Google Scholar]
- 6. Murakami Y, Toyoda H, Tanaka M, et al The progression of liver fibrosis is related with overexpression of the miR‐199 and 200 families. PLoS One 2011; 6: e16081. [DOI] [PMC free article] [PubMed] [Google Scholar]
- 7. Cermelli S, Ruggieri A, Marrero JA, Ioannou GN, Beretta L. Circulating microRNAs in patients with chronic hepatitis C and non‐alcoholic fatty liver disease. PLoS One 2011; 6: e23937. [DOI] [PMC free article] [PubMed] [Google Scholar]
- 8. Shrivastava S, Mukherjee A, Ray RB. Hepatitis C virus infection, microRNA and liver disease progression. World J Hepatol 2013; 5: 479–86. [DOI] [PMC free article] [PubMed] [Google Scholar]
- 9. Li J, Fu H, Xu C, et al miR‐183 inhibits TGF‐beta1‐induced apoptosis by downregulation of PDCD4 expression in human hepatocellular carcinoma cells. BMC Cancer 2010; 10: 354. [DOI] [PMC free article] [PubMed] [Google Scholar]
- 10. Goeppert B, Schmezer P, Dutruel C, et al Down‐regulation of tumor suppressor A kinase anchor protein 12 in human hepatocarcinogenesis by epigenetic mechanisms. Hepatology 2010; 52: 2023–33. [DOI] [PubMed] [Google Scholar]
- 11. Liang Z, Gao Y, Shi W, et al Expression and significance of microRNA‐183 in hepatocellular carcinoma. ScientificWorldJournal 2013; 2013: 381874. [DOI] [PMC free article] [PubMed] [Google Scholar]
- 12. Bedossa P, Poynard T. An algorithm for the grading of activity in chronic hepatitis C. The METAVIR Cooperative Study Group. Hepatology 1996; 24: 289–93. [DOI] [PubMed] [Google Scholar]
- 13. Burgos KL, Javaherian A, Bomprezzi R, et al Identification of extracellular miRNA in human cerebrospinal fluid by next‐generation sequencing. RNA 2013; 19: 712–22. [DOI] [PMC free article] [PubMed] [Google Scholar]
- 14. Stocks MB, Moxon S, Mapleson D, et al The UEA sRNA workbench: a suite of tools for analysing and visualizing next generation sequencing microRNA and small RNA datasets. Bioinformatics 2012; 28: 2059–61. [DOI] [PMC free article] [PubMed] [Google Scholar]
- 15. Anders S, Huber W. Differential expression analysis for sequence count data. Genome Biology 2010; 11: R106. doi:10.1186/gb‐2010‐11‐10‐r106. [DOI] [PMC free article] [PubMed] [Google Scholar]
- 16. R Development Core Team. R: A language and environment for statistical computing. Vienna, Austria: R Foundation for Statistical Computing, 2010. Retrieved from http://www.r-project.org. [Google Scholar]
- 17. Wang M, Wang Y, Zang W, et al Downregulation of microRNA‐182 inhibits cell growth and invasion by targeting programmed cell death 4 in human lung adenocarcinoma cells. Tumour Biol 2014; 35: 39–46. [DOI] [PubMed] [Google Scholar]
- 18. Qin J, Luo M, Qian H, Chen W. Upregulated miR‐182 increases drug resistance in cisplatin‐treated HCC cell by regulating TP53INP1. Gene 2014; 538: 342–7. [DOI] [PubMed] [Google Scholar]
- 19. Wang J, Li J, Shen J, et al MicroRNA‐182 downregulates metastasis suppressor 1 and contributes to metastasis of hepatocellular carcinoma. BMC Cancer 2012; 12: 227. [DOI] [PMC free article] [PubMed] [Google Scholar]
- 20. Huynh C, Segura MF, Gaziel‐Sovran A, et al Efficient in vivo microRNA targeting of liver metastasis. Oncogene 2011; 30: 1481–8. [DOI] [PubMed] [Google Scholar]
- 21. Wang W, Zhao LJ, Tan YX, Ren H, Qi ZT. Identification of deregulated miRNAs and their targets in hepatitis B virus‐associated hepatocellular carcinoma. World J Gastroenterol 2012; 18: 5442–53. [DOI] [PMC free article] [PubMed] [Google Scholar]
- 22. Wang C, Ren R, Hu H, et al MiR‐182 is up‐regulated and targeting Cebpa in hepatocellular carcinoma. Chin J Cancer Res 2014; 26: 17–29. [DOI] [PMC free article] [PubMed] [Google Scholar]
- 23. Dolganiuc A, Petrasek J, Kodys K, et al MicroRNA expression profile in Lieber‐DeCarli diet‐induced alcoholic and methionine choline deficient diet‐induced nonalcoholic steatohepatitis models in mice. Alcohol Clin Exp Res 2009; 33: 1704–10. [DOI] [PMC free article] [PubMed] [Google Scholar]
- 24. Murakami Y, Yasuda T, Saigo K, et al Comprehensive analysis of microRNA expression patterns in hepatocellular carcinoma and non‐tumorous tissues. Oncogene 2006; 25: 2537–45. [DOI] [PubMed] [Google Scholar]
- 25. Li J, Shi W, Gao Y, et al Analysis of microRNA expression profiles in human hepatitis B virus‐related hepatocellular carcinoma. Clin Lab 2013; 59: 1009–15. [DOI] [PubMed] [Google Scholar]
- 26. Wang Y, Gao Y, Shi W, et al Profiles of differential expression of circulating microRNAs in hepatitis B virus‐positive small hepatocellular carcinoma. Cancer Biomark 2014; 15: 171–80. [DOI] [PubMed] [Google Scholar]
- 27. Feng YY, Xu XQ, Ji CB, et al Aberrant hepatic microRNA Expression in nonalcoholic fatty liver disease. Cell Physiol Biochem 2014; 34: 1983–97. [DOI] [PubMed] [Google Scholar]
- 28. Liu J, Ruan B, You N, et al Downregulation of miR‐200a induces EMT phenotypes and CSC‐like signatures through targeting the beta‐catenin pathway in hepatic oval cells. PLoS One 2013; 8: e79409. [DOI] [PMC free article] [PubMed] [Google Scholar]
- 29. Sun X, He Y, Ma TT, et al Participation of miR‐200a in TGF‐beta1‐mediated hepatic stellate cell activation. Mol Cell Biochem 2014; 388: 11–23. [DOI] [PubMed] [Google Scholar]
- 30. Yuan JH, Yang F, Chen BF, et al The histone deacetylase 4/SP1/microrna‐200a regulatory network contributes to aberrant histone acetylation in hepatocellular carcinoma. Hepatology 2011; 54: 2025–35. [DOI] [PubMed] [Google Scholar]
- 31. Chiu LY, Kishnani PS, Chuang TP, et al Identification of differentially expressed microRNAs in human hepatocellular adenoma associated with type I glycogen storage disease: a potential utility as biomarkers. J Gastroenterol 2014; 49: 1274–84. [DOI] [PubMed] [Google Scholar]
- 32. Dhayat SA, Mardin WA, Kohler G, et al The microRNA‐200 family–a potential diagnostic marker in hepatocellular carcinoma? J Surg Oncol 2014; 110: 430–8. [DOI] [PubMed] [Google Scholar]
- 33. Petrelli A, Perra A, Cora D, et al MicroRNA/gene profiling unveils early molecular changes and nuclear factor erythroid related factor 2 (NRF2) activation in a rat model recapitulating human hepatocellular carcinoma (HCC). Hepatology 2014; 59: 228–41. [DOI] [PubMed] [Google Scholar]
- 34. Benoit C, Ould‐Hamouda H, Crepin D, et al Early leptin blockade predisposes fat‐fed rats to overweight and modifies hypothalamic microRNAs. J Endocrinol 2013; 218: 35–47. [DOI] [PubMed] [Google Scholar]
- 35. Alisi A, Da Sacco L, Bruscalupi G, et al Mirnome analysis reveals novel molecular determinants in the pathogenesis of diet‐induced nonalcoholic fatty liver disease. Lab Invest 2011; 91: 283–93. [DOI] [PubMed] [Google Scholar]
- 36. Hung CS, Liu HH, Liu JJ, et al MicroRNA‐200a and ‐200b mediated hepatocellular carcinoma cell migration through the epithelial to mesenchymal transition markers. Ann Surg Oncol 2013; 20(Suppl 3): S360–8. [DOI] [PubMed] [Google Scholar]
- 37. Yang YM, Lee WH, Lee CG, et al Galpha gep oncogene deregulation of p53‐responsive microRNAs promotes epithelial‐mesenchymal transition of hepatocellular carcinoma. Oncogene 2014; 34: 2910–21. [DOI] [PubMed] [Google Scholar]
- 38. Murakami Y, Aly HH, Tajima A, Inoue I, Shimotohno K. Regulation of the hepatitis C virus genome replication by miR‐199a. J Hepatol 2009; 50: 453–60. [DOI] [PubMed] [Google Scholar]
- 39. Yang J, Han S, Huang W, et al A meta‐analysis of microRNA expression in liver cancer. PLoS One 2014; 9: e114533. [DOI] [PMC free article] [PubMed] [Google Scholar]
- 40. Cardin R, Piciocchi M, Sinigaglia A, et al Oxidative DNA damage correlates with cell immortalization and mir‐92 expression in hepatocellular carcinoma. BMC Cancer 2012; 12: 177. [DOI] [PMC free article] [PubMed] [Google Scholar]
- 41. Jia XQ, Cheng HQ, Qian X, et al Lentivirus‐mediated overexpression of microRNA‐199a inhibits cell proliferation of human hepatocellular carcinoma. Cell Biochem Biophys 2012; 62: 237–44. [DOI] [PubMed] [Google Scholar]
- 42. Qu KZ, Zhang K, Li H, Afdhal NH, Albitar M. Circulating microRNAs as biomarkers for hepatocellular carcinoma. J Clin Gastroenterol 2011; 45: 355–60. [DOI] [PubMed] [Google Scholar]
- 43. Shen Q, Cicinnati VR, Zhang X, et al Role of microRNA‐199a‐5p and discoidin domain receptor 1 in human hepatocellular carcinoma invasion. Mol Cancer 2010; 9: 227. [DOI] [PMC free article] [PubMed] [Google Scholar]
- 44. Zhang J, Zhang D, Wu GQ, Feng ZY, Zhu SM. Propofol inhibits the adhesion of hepatocellular carcinoma cells by upregulating microRNA‐199a and downregulating MMP‐9 expression. Hepatobiliary Pancreat Dis Int 2013; 12: 305–9. [DOI] [PubMed] [Google Scholar]
- 45. Dai BH, Geng L, Wang Y, et al microRNA‐199a‐5p protects hepatocytes from bile acid‐induced sustained endoplasmic reticulum stress. Cell Death Dis 2013; 4: e604. [DOI] [PMC free article] [PubMed] [Google Scholar]
- 46. Kanda T, Ishibashi O, Kawahigashi Y, et al Identification of obstructive jaundice‐related microRNAs in mouse liver. Hepatogastroenterology 2010; 57: 1013–23. [PubMed] [Google Scholar]
- 47. Ogawa T, Enomoto M, Fujii H, et al MicroRNA‐221/222 upregulation indicates the activation of stellate cells and the progression of liver fibrosis. Gut 2012; 61: 1600–9. [DOI] [PubMed] [Google Scholar]
- 48. Mobus S, Yang D, Yuan Q, et al MicroRNA‐199a‐5p inhibition enhances the liver repopulation ability of human embryonic stem cell‐derived hepatic cells. J Hepatol 2014; 62: 101–10. [DOI] [PubMed] [Google Scholar]
- 49. Xu N, Zhang J, Shen C, et al Cisplatin‐induced downregulation of miR‐199a‐5p increases drug resistance by activating autophagy in HCC cell. Biochem Biophys Res Commun 2012; 423: 826–31. [DOI] [PubMed] [Google Scholar]
- 50. Pan L, Huang S, He R, et al Decreased expression and clinical significance of miR‐148a in hepatocellular carcinoma tissues. Eur J Med Res 2014; 19: 68. [DOI] [PMC free article] [PubMed] [Google Scholar]
- 51. He XX, Kuang SZ, Liao JZ, et al The regulation of microRNA expression by DNA methylation in hepatocellular carcinoma. Mol BioSyst 2014; 11: 532–9. [DOI] [PubMed] [Google Scholar]
- 52. Braconi C, Huang N, Patel T. MicroRNA‐dependent regulation of DNA methyltransferase‐1 and tumor suppressor gene expression by interleukin‐6 in human malignant cholangiocytes. Hepatology 2010; 51: 881–90. [DOI] [PMC free article] [PubMed] [Google Scholar]
- 53. Heo MJ, Kim YM, Koo JH, et al microRNA‐148a dysregulation discriminates poor prognosis of hepatocellular carcinoma in association with USP4 overexpression. Oncotarget 2014; 5: 2792–806. [DOI] [PMC free article] [PubMed] [Google Scholar]
- 54. Zhang Z, Zheng W, Hai J. MicroRNA‐148b expression is decreased in hepatocellular carcinoma and associated with prognosis. Med Oncol 2014; 31: 984. [DOI] [PubMed] [Google Scholar]
- 55. Yan H, Dong X, Zhong X, et al Inhibitions of epithelial to mesenchymal transition and cancer stem cells‐like properties are involved in miR‐148a‐mediated anti‐metastasis of hepatocellular carcinoma. Mol Carcinog 2014; 53: 960–9. [DOI] [PubMed] [Google Scholar]
- 56. Gailhouste L, Gomez‐Santos L, Hagiwara K, et al miR‐148a plays a pivotal role in the liver by promoting the hepatospecific phenotype and suppressing the invasiveness of transformed cells. Hepatology 2013; 58: 1153–65. [DOI] [PubMed] [Google Scholar]
- 57. Han H, Sun D, Li W, et al A c‐Myc‐MicroRNA functional feedback loop affects hepatocarcinogenesis. Hepatology 2013; 57: 2378–89. [DOI] [PubMed] [Google Scholar]
- 58. Li L, Liu Y, Guo Y, et al Regulatory miR‐148a‐ACVR1/BMP circuit defines a cancer stem cell‐like aggressive subtype of hepatocellular carcinoma. Hepatology 2014; 61: 574–84. [DOI] [PMC free article] [PubMed] [Google Scholar]
- 59. Rieger JK, Klein K, Winter S, Zanger UM. Expression variability of absorption, distribution, metabolism, excretion‐related microRNAs in human liver: influence of nongenetic factors and association with gene expression. Drug Metab Dispos 2013; 41: 1752–62. [DOI] [PubMed] [Google Scholar]
- 60. Xu X, Fan Z, Kang L, et al Hepatitis B virus X protein represses miRNA‐148a to enhance tumorigenesis. J Clin Invest 2013; 123: 630–45. [DOI] [PMC free article] [PubMed] [Google Scholar]
- 61. Farid WR, Pan Q, van der Meer AJ, et al Hepatocyte‐derived microRNAs as serum biomarkers of hepatic injury and rejection after liver transplantation. Liver Transpl 2012; 18: 290–7. [DOI] [PubMed] [Google Scholar]
- 62. Magrelli A, Azzalin G, Salvatore M, et al Altered microRNA expression patterns in hepatoblastoma patients. Transl Oncol 2009; 2: 157–63. [DOI] [PMC free article] [PubMed] [Google Scholar]
Associated Data
This section collects any data citations, data availability statements, or supplementary materials included in this article.
Supplementary Materials
Additional Supporting Information may be found at onlinelibrary.wiley.com/doi/10.1111/liv.12919/suppinfo