

ABSTRACT
Purpose
Retinopathy of prematurity (ROP) is a potentially blinding vasoproliferative disease. There is no standardized way to quantify plus disease (tortuous and dilated retinal vessels) or characterize abnormal recovery during ROP monitoring. This study objectively studies vascular features in live mice during development using noninvasive retinal imaging.
Methods
Using fluorescein angiography (FA), retinal vascular features were quantified in live mice with oxygen induced retinopathy (OIR). A total of 105 wild-type mice were exposed to 77% oxygen from postnatal day 7 (P7) till P12 (OIR mice). Also, 105 age-matched pups were raised in room air (RA mice). In vivo FA was performed at early (P16 to P20), mid (P23 to P27), late (P30 to P34), and mature (P47) phases of retinal vascular development. Retinal vascular area, retinal vein width, and retinal artery tortuosity were quantified.
Results
Retinal artery tortuosity was higher in OIR than RA mice at early (p < 0.0001), mid (p < 0.0001), late (p < 0.0001), and mature (p < 0.0001) phases. Retinal vascular area in OIR mice increased from early to mid-phase (p < 0.0001), but remained unchanged from mid to late (p = 0.23), and from late to mature phase (p = 0.98). Retinal vein width was larger in OIR mice compared to RA mice during early phase only. Arteries in OIR mice were more tortuous from early to mid-phase (p < 0.0001), but tortuosity remained stable from mid through mature phase. RA mice had an increase in retinal vascular area from early to late phase, but maintained uniform retinal vein width and retinal artery tortuosity in all phases.
Conclusions
In vivo FA distinguished arterial and venous features, similar to plus disease, and revealed aberrant recovery of OIR mice (arterial tortuosity, reduced capillary density, and absent neovascular buds) that persisted into adulthood. Retinal artery tortuosity may be a reliable, objective marker of severity of ROP. Infants with abnormal retinal vascular recovery may need extended monitoring.
Key Words: fluorescein angiography, retinopathy of prematurity, oxygen-induced retinopathy, retinal vascular development, angiogenesis, retinal vessels
Retinopathy of prematurity (ROP) is a disease of abnormal retinal vascular development. In utero, retinal vessels develop in physiologic hypoxemia. Preterm birth into a relatively hyperoxic environment (extra-uterine environment has a partial pressure of oxygen (PaO2) close to 100 mmHg compared to less than 35 mmHg in utero) disrupts retinal vascularization, exacerbated by supplemental oxygen use (Phase 1 ROP). This leads 4 to 6 weeks later to a relatively hypoxic retinal environment, as there are now insufficient vessels to meet the retinal metabolic demand, causing subsequent neovascularization, fibrosis, and detachment (Phase 2 ROP).1 Improved obstetric and neonatal care, with increased newborn survival at the limits of viability and prolonged supplemental oxygen use for pulmonary insufficiency, has led to an increased prevalence of ROP.
Serial dilated retinal examinations of infants less than 1500 g or 30 weeks’ gestation at birth are done to detect severity of abnormal vascularization (stage) and extent of peripheral retinal vessel coverage (zone), and presence of plus disease. Plus disease describes abnormally prominent retinal venous dilation and arterial tortuosity in the posterior pole that warrants emergent treatment2–4; however, it is difficult to distinguish arteries from veins clinically in the presence of vascular abnormalities. The clinical diagnosis of plus disease is done subjectively by comparing the retina with a standard photo of the International Classification of ROP (IC-ROP).5,6 This largely nonquantitative method of diagnosis of plus disease has been shown to result in inconsistent diagnosis with widely varying expert interpretation.7 ROP examinations continue clinically until there is full vascularization to the peripheral retina (zone 3) or postmenstrual age 45 weeks and full regression of any ROP. ROP appears to regress from post-menstrual age 44 weeks in 90% of infants,8 hence retinal examinations are discontinued in the neonatal intensive care unit (NICU) with limited follow-up. Premature infants are known to have adverse long-term visual outcomes including myopia, strabismus, visual field deficits, contrast sensitivity, and color vision deficits,9,10 which are more prevalent in those with ROP. Despite current management strategies including early treatment of severe ROP with laser photocoagulation2 and bevacizumab,11 ROP remains a significant cause of blindness worldwide.12
Animal studies have greatly contributed to current knowledge of ROP. Although rodents (mice and rats) are born at term gestation and not premature,13 their retinas vascularize after birth unlike humans that complete retinal vascularization by term gestation in utero.14 Postnatal exposure of newly formed vessels to hyperoxia allows studies of the effect of oxidative stress on retinal vascular development. Ex vivo techniques using histologic sections of the retina15 and retinal flat mounts16,17 have advanced knowledge of ROP, but have limited capabilities to enable studies on retinal physiology or function.18,19 In vivo retinal imaging is an emerging technique in the study of oxygen-induced retinopathy (OIR) and shows unique abnormalities in retinal vascularization, after intraperitoneal injection of fluorescein, and retinal vascular oxygen tension and vessel thickness.20 No systematic methods have been applied to quantify retinal vascular features in mice using fluorescein angiography (FA); hence, most published literature on FA in OIR is descriptive. The goal of this study was to use FA to qualitatively and quantitatively distinguish artery and vein development in live, anesthetized mice with OIR. This may facilitate more objective and consistent diagnosis in ROP screening.
METHODS
Animals
All experiments were approved by the Animal Care and Use Committee of the University of Wisconsin, Madison and were in accordance with the Association of Research in Vision and Ophthalmology Statement for the Use of Animals in Ophthalmic and Vision Research. C57BL/6J mice used for this research were derived from breeding colonies maintained at the University of Wisconsin, Madison.
Oxygen Exposure
Using a modification21 of an established method of inducing OIR,22 105 mice (referred to as OIR mice) were exposed to 77% (±2%) oxygen in a hyperoxia chamber (Biospherix Ltd., Redfield, NY) from postnatal day 7 (P7) to P12, before returning to room air (RA). A total of 105 age-matched mice were raised in room air (referred to as RA mice). Nursing dams were used to switch out the mothers of the litters in hyperoxia at P9 to prevent pulmonary toxicity. Pups were weighed before retinal imaging. Number of pups per litters were matched in both RA and OIR mice (8 ± 2 vs. 7 ± 1, p = 0.05), respectively, to avoid the effect of large litters on reduced weight or severity of OIR.
Retinal Fluorescein Angiography
Three intervals of retinal vascular development were evaluated: early (P16 to P20), mid (P23 to P27), late (P30 to P34), and mature (P47) phases. The mature phase denotes any time point after P35, which is the age of sexual maturity of the mouse. After intraperitoneal injections (IP) of ketamine (100 mg/kg) and xylazine (10 mg/kg), the pupils of the mice were dilated with 1% tropicamide (Bausch + Lomb, Inc., Tampa, FL) followed by IP injection of 10% fluorescein sodium (100 mg/kg) (AK-FLUOR; Akorn, Decatur, IL) 1 to 2 minutes before imaging. Using a commercially available Micron IV retinal imaging system (Phoenix Research Laboratories, Pleasanton, CA), retinal FA images with 50° fields of views were obtained in one eye of each mouse.
Statistical Analysis
Statistical analysis was performed with GraphPad Prism v.6 (GraphPad Software, Inc.). Retinal arterial and vascular parameters were summarized in terms of means ± standard deviations (SD). Analysis of variance was conducted to perform comparisons between RA and OIR mice, postnatal days, and phases of retinal vascular development. Pearson’s correlation was performed to examine the effect of postnatal day age, weight, and oxygen on vascular parameters. All p-values are two-sided and p <0.05 was used to define statistical significance.
Methods of Quantification of Retinal Vascular Features
Automated and semi-automated customized software were developed using MATLAB (Mathworks, Natick, MA) to quantify the retinal vascular area (RVA), retinal vein width (RVW), and retinal arterial tortuosity (RAT) (Fig. 1). For retinal vascular area measurement, a retinal FA image with the optic nerve close to the center (Fig. 1A) was selected for each mouse and opened in the customized software program, which automatically converts the FA image into a binary image (Fig. 1B). The extent of vessel coverage in the retinal images (both major vessels and capillaries) was automatically derived. The retinal vascular area represents the area of the image covered by vessels expressed as a percentage (%) of the total retinal area in the circular FA image. To avoid selection bias, the same image was used to measure vessel width and tortuosity. Veins appear larger than the arteries in all animals imaged. For retinal vein width, semi-automated calibrations were used to select two points aligned horizontally at either edge of the vein (the largest and least tortuous vessel in the image) to delineate a width measurement. Subsequent width measurements were selected in the same vessel starting from the optic nerve base to a validated distance of 275 ± 25 μm in RA and OIR mice (Fig. 1C). For tortuosity measurements, branch points were selected along the artery using a cursor, from the base of the optic nerve up to a validated distance of 175 ± 25 μm for RA mice and 275 ± 25 μm for OIR mice. A linear projection was drawn automatically by the software program to connect the first and last points (Fig. 1D). Retinal arterial tortuosity was calculated as the ratio of actual vessel length to the projected linear length. A value of 1 showed absence of tortuosity, whereas more than 1 signified the degree of tortuosity in an artery. The customized MATLAB software program is available for free download at www.quantbv.com.
FIGURE 1.
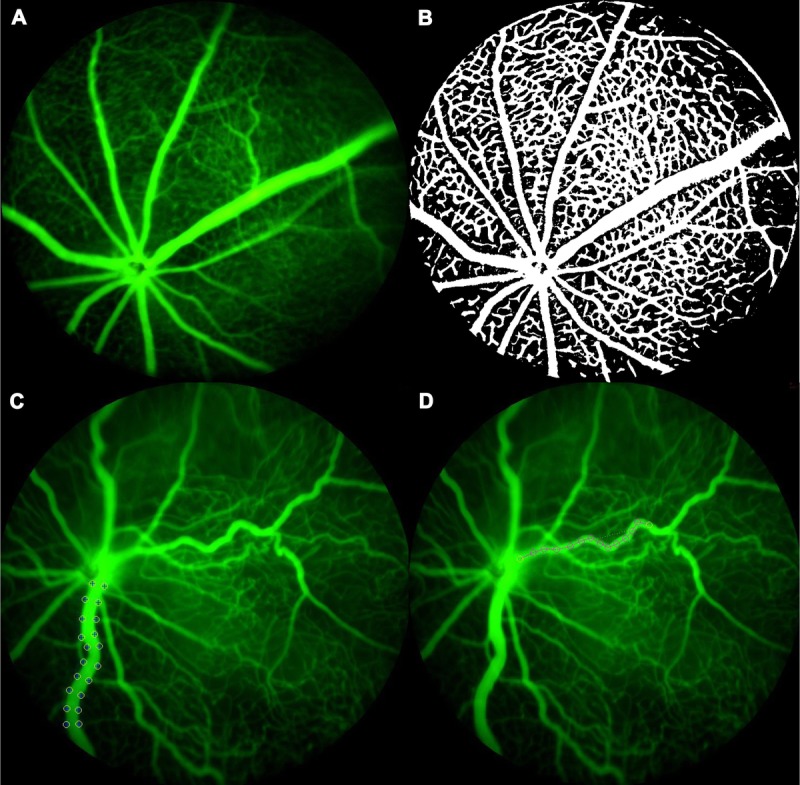
Methodology of vascular analysis. (A) FA image from a P19 RA mouse. (B) A binary Image from the same mouse. Once uploaded to the MATLAB program, the FA image is automatically converted to a grayscale and then binary image which depicts all vessels in the image as “white” on a “black” retinal background. The retinal vascular area is calculated as percentage of areas in “white” to the “total area” in the same FA image. The retinal vascular area calculated in this P19 RA mouse is 47%. (C) Retinal vein width in this P25 OIR mouse is 49 μm. (D) The retinal artery tortuosity index in the same P25 OIR mouse is 1.099. RA, room air.
Validation of Methods
Statistical validation analysis was conducted using SAS version 9.3 (SAS Institute, Cary, NC.). The measured distance along the vessel for arterial tortuosity and venous width was determined. The distance from the optic nerve to the point of first bifurcation of the artery was selected as a reference point. Measuring beyond that point would overestimate the arterial tortuosity due to the physiologically normal phenotype of repeated bifurcations along the length of the arteries (away from the optic nerve head). The point of first bifurcation was noted to range between 184 and 398 μm in arteries at P33 (n = 6). These arteries were each measured successively at 150, 200, 250, 300, and 350 μm, and their values for retinal artery tortuosity used to determine the optimal point of bifurcation. Specifically, the optimal point of bifurcation was defined as the point which resulted in the smallest coefficient of variation (CV) and highest intra class correlation (ICC) coefficient between measurements. The smallest coefficient of variation and highest ICC coefficient was found between 250 and 300 μm for both retinal artery tortuosity (CV = 0.003) (ICC = 0.967, 95% CI: 0.789–0.995) and retinal vein width (CV = 0.015) (ICC = 0.958, 95% CI: 0.775–0.994) measurements in OIR mice and retinal vein width (CV = 0.018) (ICC = 0.957, 95% CI: 0.751–0.994) measurements in RA mice, hence 275 ± 25 μm was selected as the target reference distance. The smallest coefficient of variation was found between 150 and 200 μm for retinal artery tortuosity measurement (CV = 0.001) (ICC = 0.843, 95% CI: 0.331–0.976) in RA mice only, hence a separate target reference distance of 175 ± 25 was set.
RESULTS
Qualitative FA Features in the Phases of Retinal Vascular Development
Early Phase (P16 to P20)
From P16 to P20, OIR mice had markedly more dilated veins and more tortuous arteries than RA mice. There was near circumferential obliteration of capillaries in between the major vessels in central, mid-peripheral, and peripheral retinal areas, with increasing peripheral neovascularization (most likely due to vascular regeneration) (Fig. 2A(ii) to 2E(ii)). A central hyperfluorescence existed around the optic nerve at P16, likely from increased vascular permeability and abnormal barrier function after hyperoxia, which decreased in prominence from P17 to P20. Perivascular neovascularization appeared earlier in veins than arteries of OIR mice, whereas arteries in OIR mice had surrounding peri-arteriolar capillary free zones. Maximal neovascularization and venous beading were observed at P18 and P19 with decrease in patchy central retinal avascularity. In some mice, there was an initial appearance of arteriovenous (AV) shunts (Fig. 3B) and vascular loops. RA mice in the early phase showed complete capillary coverage with increasing density of capillary network from P16 to P20 (Fig. 2A(i) to 2E(i)).
FIGURE 2.
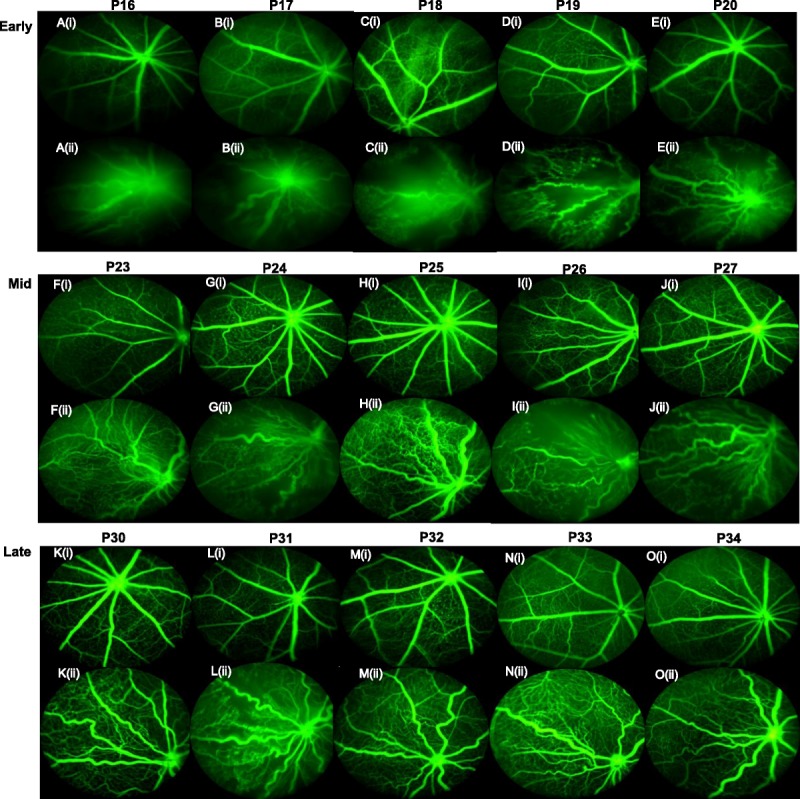
Phases of retinal vascular development and abnormal vascularization with OIR recovery. (A) to (E) denotes early phase (P16–20). (A(i)) to (E(i)) shows FA in RA mice, whereas (A(ii)) to (E(ii)) shows FA in OIR mice: (A(i)) is a representative image from a P16 RA mouse, whereas (A(ii)) is a representative image from a P16 OIR mouse. (F) to (J) denotes mid-phase (P23–27): (F(i)) is a representative image from a P23 RA mouse, whereas (F(ii)) is a representative image from a P23 OIR mouse. (K) to (O) denotes late phase: (K(i)) is a representative image from a P30 RA mouse, whereas (K(ii)) is a representative image from a P30 OIR mouse. RA, room air; OIR, oxygen-induced retinopathy; FA, fluorescein angiography; (i) represents RA FA image, (ii) represents OIR image.
FIGURE 3.
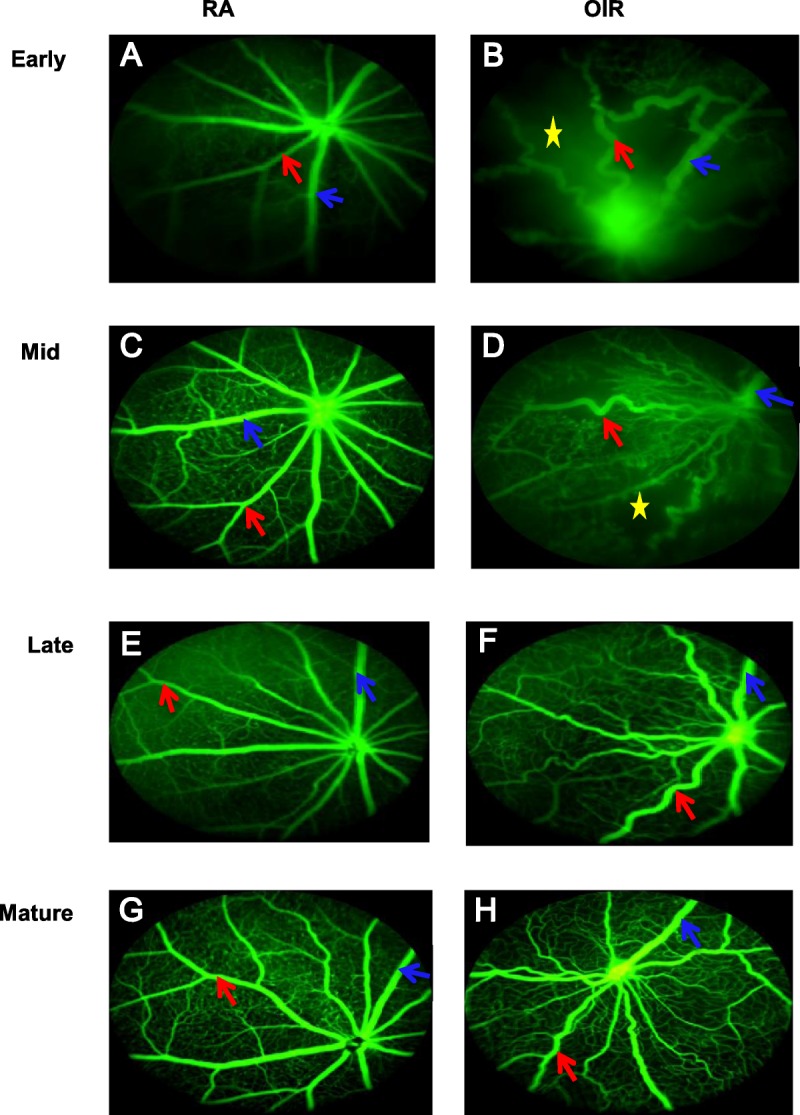
FA differentiation of arteries from veins in RA and OIR during the phases of retinal vascular development. In the figure, P16, P24, P34, and P47 denote early, mid, late, and mature phases, respectively. (A) shows P16 RA; (B) shows P16 OIR; (C) shows P24 RA; (D) shows P24 OIR; (E) shows P34 RA; (F) shows P34 OIR; (G) shows P47RA; (H) shows P47 OIR. All veins are larger than arteries in both RA and OIR mice. Largest vein in image is shown in blue arrow. RA arteries are uniform and straight with dichotomous branching. The white arrow in (B) shows an AV shunt between an artery and vein in a P16 OIR mouse. Neobuds are seen on capillary tips of P47 RA (E, G) image, but absent in P47 OIR images (F, H). RA, room air; OIR, oxygen-induced retinopathy; FA, fluorescein angiography; (A) represents RA FA image, (B) represents OIR image; red arrows show arteries; blue arrows indicate veins; yellow stars denote avascular areas; white arrow shows arteriovenous (AV) shunt.
Mid-Phase (P23 to P27)
In OIR mice, peak arterial tortuosity occurred from P23 to P27, with intense neovascularization and more capillary coverage with less central avascularity than in the previous phase (Fig. 2F(ii) to 2J(ii)). Neovascularization progressed centrally and peripherally with a patchy distribution of mid-peripheral avascularity. There were also vascular loops, AV malformations, and shunts (Fig. 3B). One prominent vein is seen in each mouse compared to other sparse, thin venules. Veins had a delay in vascularization compared to arteries. RA mice, in contrast, had uniform, straight vessels with a dense capillary networks with no avascular areas (Fig. 2F(i) to 2J(i)).
Late Phase (P30 to P34)
The late phase OIR mice showed persistent tortuosity and significantly sparser capillary network than the dense lattice-like capillary network in RA mice. OIR mice also had absent neovascular buds on the capillary tips, unlike the RA mice with numerous neovascular buds on capillary tips. Vascular loops and AV shunting were still seen in late phase up to P33, though inconsistently. P33 and P34 OIR mice, though completely vascularized, still had significantly more tortuous arteries than their RA counterparts (Fig. 2K(i,ii) to 2O(i,ii)).
Mature Phase (P47)
At P47, the arteries in OIR mice were less tortuous than in late phase, but still more tortuous than RA mice of the same age (Fig. 3G, H). The RA mice maintained a very dense lattice-like capillary network in between major vessels with neovascular buds at capillary tips (Fig. 4A, C), unlike the sparse capillary network of OIR mice with vascular pruning and absent neovascular buds despite full vascularization (Fig. 4B, D).
FIGURE 4.
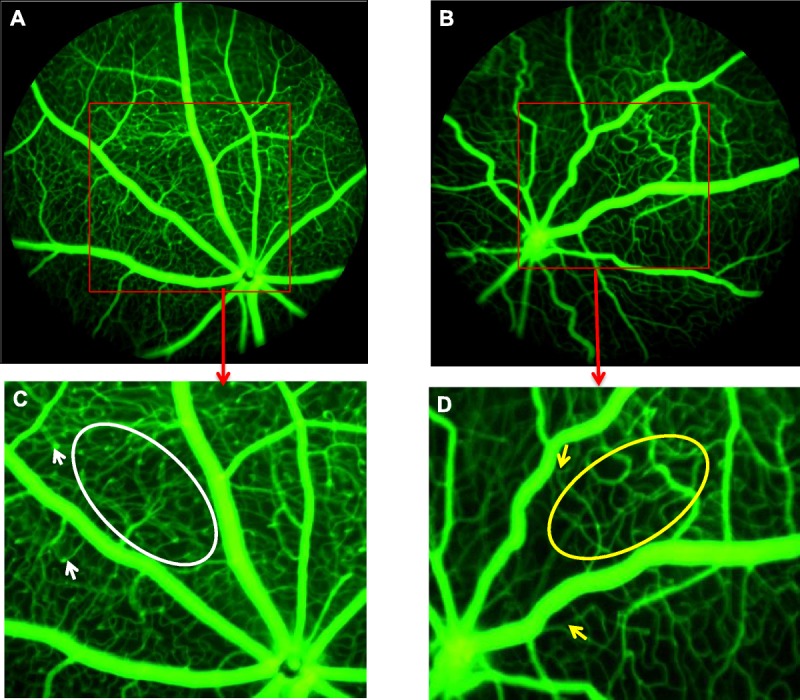
Absent neovascular buds and reduced capillary density in adult OIR mice. (A) shows the FA of a RA mouse at P47. (B) shows FA of an OIR mouse at P47. The red box insert in each image projects a magnified view of a selected retinal area. (C) shows select retinal area of RA mouse. White arrowheads show neovascular buds on capillaries. White oval shows dense capillary network in between major vessels. (D) shows select retinal area of OIR mouse. Yellow arrowheads show absent neovascular buds on capillaries. Yellow oval shows reduced or sparse capillary network in between major vessels.
Quantitative Analysis of Vascular Appearance and Vessel Caliber
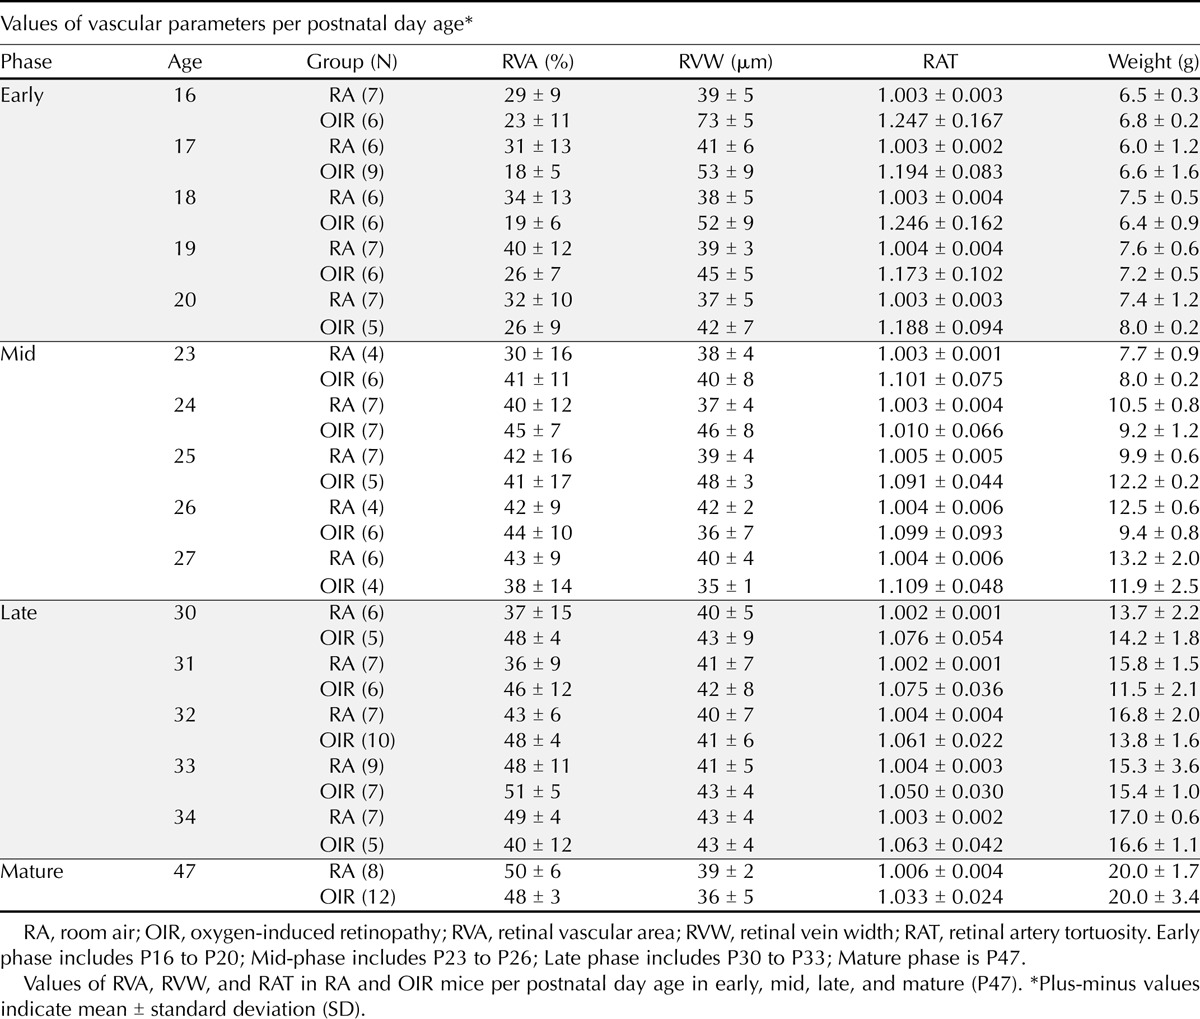
Table 1 shows the values for retinal vascular area, retinal vein width, and retinal artery tortuosity in RA and OIR mice in postnatal days from P16 to P20 (early phase), P23 to P27 (mid-phase), P30 to P34 (late phase), and P47 (mature phase). Apart from variability in retinal vein widths in OIR mice, there was no intra-phase difference (within phases) in retinal vascular area, retinal vein width, and retinal artery tortuosity in either RA or OIR mice. The retinal vascular area in early phase at P16 was not significantly different from the mean percent retinal coverage at P17 (p > 0.9), P18 (p > 0.9), P19 (p > 0.7), and P20 (p > 0.9). However, retinal vein width showed more variability in the early phase with larger vein widths in P16 compared to P17 through P20 (p < 0.001), and in mid-phase, P25 OIR were significantly wider than P26 OIR (p = 0.03). In early phase, both RA and OIR mice at P17 had no significant difference in vascular area, width, or tortuosity compared to mice at P18, P19, or P20 (p > 0.05 for all comparisons). In mid-phase, mice at P23 had no significant difference in vascular area, width, or tortuosity compared to mice at P24, P25, P26, or P27 (p > 0.5 for all comparisons). Likewise, P30 mice in the late phase were no different in vascular area, width, or tortuosity than mice at P31, P32, P33, or P34 (p > 0.5 for all comparisons). However, there were interphase differences (between phases) for retinal vascular area, retinal vein width, and retinal artery tortuosity such that mice at any day in early phase (P16–20) had a significant difference in vascular area, width, or tortuosity than mice in mid-phase (P23–27).
TABLE 1.
Values of vascular parameters in RA and OIR mice per postnatal day age
Retinal Vascular Area Increased in Both OIR and RA Mice from Early to Mid-Phase
Mean retinal vascular area values per phase in OIR mice showed an increase in vessel coverage per FA image from early (23 ± 8%, n = 32) to mid-phase (42 ± 11%, n = 28 p < 0.0001), with no difference from mid to late phase (47 ± 8%, p = 0.23, n = 33), and from late to mature phase (48 ± 3%, n = 12, p = 0.98), despite increasing capillary coverage in vaso-obliterated areas. Though there was a trend towards developmental increase in vessel coverage, retinal vascular area in RA mice did not change significantly from early (33 ± 11%, n = 33) to mid-phase (40 ± 13%, n = 28, p = 0.05) because the major vessels in RA mice were fully formed with a complete capillary coverage and no vaso-obliterated areas were found in the early and mid-phase. The retinal vascular area increased from early to late phase with developmental maturity (43 ± 11%, n = 36, p < 0.001) as capillary density increased, but then remained similar from mid to late phase (p = 0.56), and from late to mature phase (50 ± 6%, n = 8, p = 0.33). Retinal vascular area was significantly decreased in RA compared to OIR mice in early phase (p < 0.0001), but was similar in both RA and OIR mice in mid (p = 0.50), late (p = 0.1), and mature (p = 0.43) phases (Fig. 5A).
FIGURE 5.
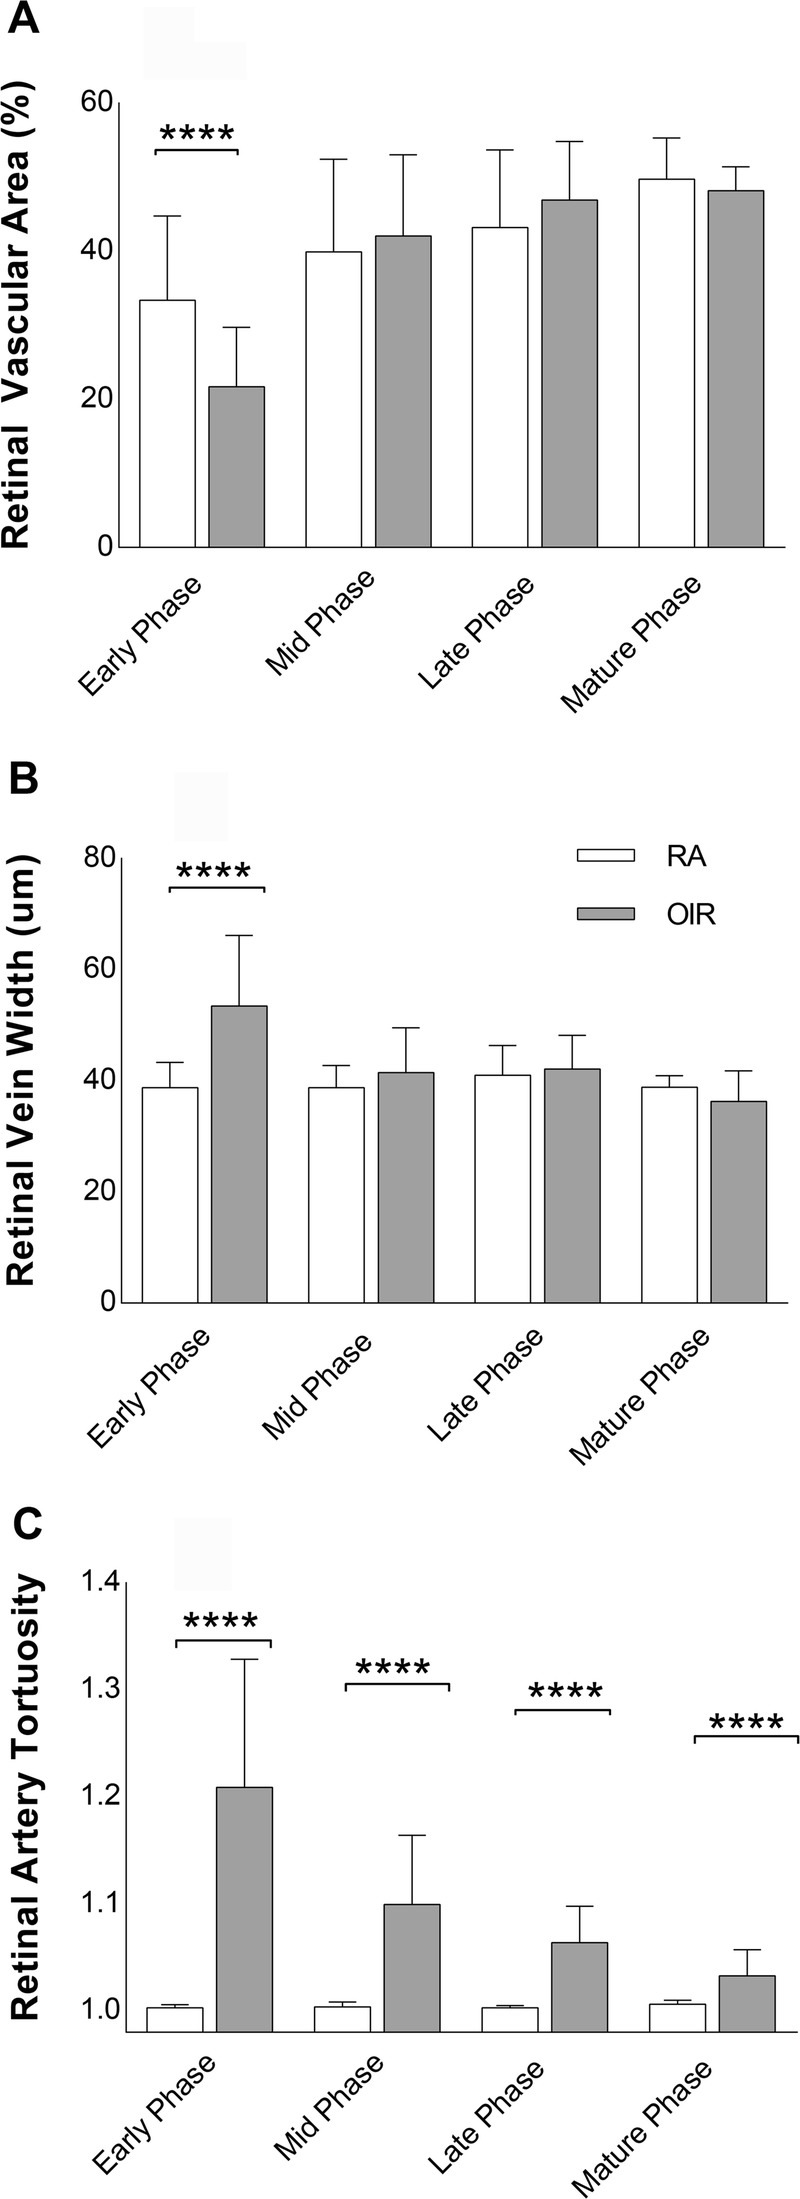
Vascular parameters per phase. (A) to (C) shows interphase comparison of vascular parameters RA and OIR mice per phase: RVA (A), RVW (B), and RAT (C) in the early, mid, late, and mature. Error bars indicate standard deviations (±SD). Values are in mean ± standard deviation (SD). **** denotes p < 0.0001. (D) shows mean weight of mice in each postnatal day. Weight is expressed in grams (g). RA, room air; OIR, oxygen-induced retinopathy; FA, fluorescein angiography; RVA, retinal vascular area; RVW, retinal vein width; RAT, retinal artery tortuosity. Early phase includes P16 to P20; mid-phase includes P23 to P26; late phase includes P30 to P33; mature phase is P47.
Retinal Vein Width (RVW) Was Higher in OIR Than RA Mice in Early Phase
The veins of the OIR mice were larger in the early phase just days after hyperoxia exposure with more variable width between postnatal days, but as the mice matured, the retinal vein width in OIR mice decreased from early (54 ± 13 μm, n = 32) to mid-phase (41 ± 8 μm, n = 28, p < 0.001). Subsequently, retinal vein width remained equivalent with stable vein widths from mid to late phase (42 ± 6 μm, n = 33, p = 0.98), and from late to mature phase (48 ± 3 μm, n = 12, p = 0.08). RA mice had uniform width and caliber from early (39 ± 5 μm, n = 33) to mid (39 ± 4 μm, n = 28, p > 0.99), but remained unchanged from mid to late (41 ± 5 μm, n = 36, p = 0.61), and from late to mature (36 ± 5 μm, n = 8, p = 0.87) phases of retinal vascular development. OIR mice had more dilated retinal veins in early phase compared to RA mice (p < 0.0001), but there was no difference in venous width between OIR and RA mice at mid (p = 0.12), late (p = 0.41), and mature phases (p = 0.24) (Fig. 5B).
Retinal Artery Tortuosity (RAT) Was Higher in OIR Than RA Mice At All Phases
Arteries of OIR mice were seen to be most tortuous during the early phase after hyperoxia exposure. Retinal artery tortuosity then decreased in OIR mice from early (1.21 ± 0.12, n = 32) to mid-phase (1.1 ± 0.065, n = 28, p < 0.001), but their arterial tortuosity was equivalent from mid to late phase (1.064 ± 0.034, n = 33, p = 0.06), and from late to mature phase (1.03 ± 0.024, n = 12, p = 0.34). Therefore, the longer OIR mice recovered from the earlier hyperoxia in room air, the less tortuous their arteries became. Arteries in RA mice were non-tortuous throughout developmental maturity and maintained a stable tortuosity index from early (1.003 ± 0.003, n = 33) to mid (p > 0.1), and from mid (1.004 ± 0.004, n = 28) to late phase (1.003 ± 0.002, n = 36, p > 0.1), and from late to mature phase (1.006 ± 0.004, n = 8, p = 0.1). The arteries of OIR mice despite decreasing in tortuosity with increasing age were significantly more tortuous than the arteries of RA mice at all developmental phases: early (p < 0.0001), mid (p < 0.0001), late (p < 0.0001), and mature (p = 0.007) (beyond sexual maturity) (Fig. 5C).
Postnatal Weight Correlates with Vascular Parameters
There was a strong positive correlation between postnatal body weight and retinal vascular area in OIR mice (r = 0.62, p < 0.0001) (Fig. 6B) so that as the mice got bigger, the area of vessel coverage increased, whereas retinal vein width (r = −0.42, p < 0.0001) (Fig. 6D) and RAT (r = −0.53, p < 0.0001) (Fig. 6F) had a strong negative correlation with weight displaying decreasing width and tortuosity as the mice increased in body weight. In RA mice, there is no significant correlation between body weight and retinal artery tortuosity (p = 0.3) (Fig. 6E) or retinal vein width (p = 0.2) (Fig. 6C), but as the retinal vascular area increased, weight increased in RA mice (r = 0.41, p < 0.0001) (Fig. 6A).
FIGURE 6.
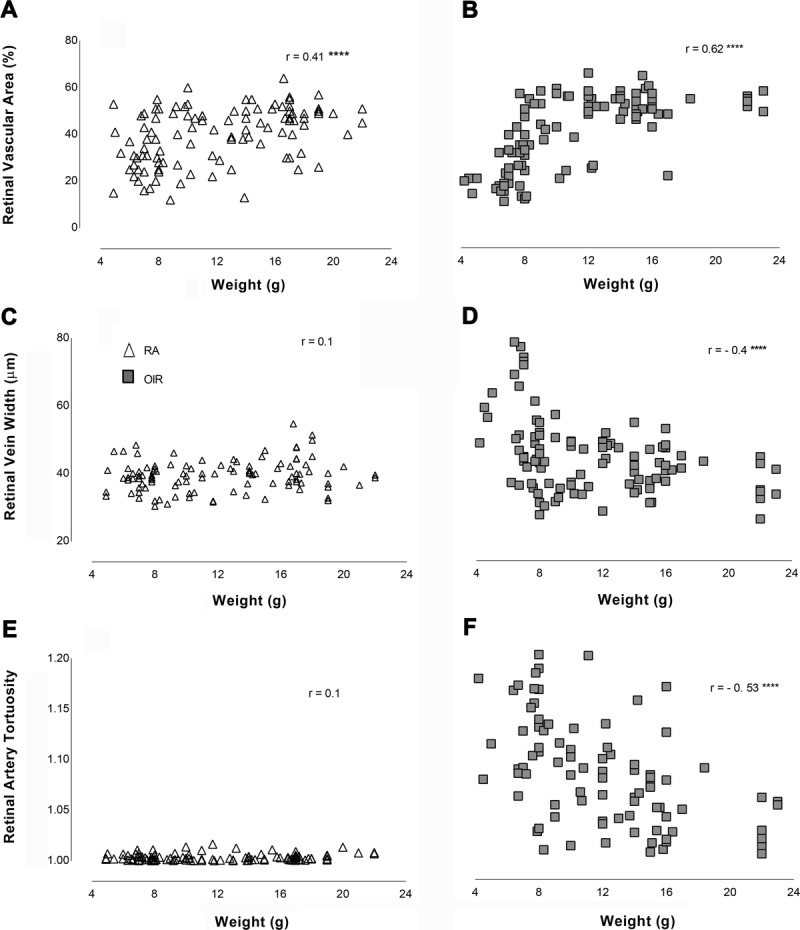
Correlation of postnatal weight with vascular parameters (retinal vascular area, retinal vein width, and retinal artery tortuosity). Triangles are RA and squares are OIR. r = Pearson’s coefficient of correlation. **** denotes p < 0.0001, otherwise result was not significant. RA, room air; OIR, oxygen-induced retinopathy.
DISCUSSION
ROP is a potentially blinding disease in premature infants. Lack of a standardized method for quantifying severity like vessel dilation and tortuosity causes marked variability in diagnosis, which may lead to delayed treatment and poor visual outcomes. This study used real-time in vivo FA to distinguish retinal arteries from veins and quantify vascular features before (P16 to P34) and after (beyond P35) sexual maturity of the mouse, well past the traditionally studied P17. This study demonstrates the simultaneous use of vascular parameters in the objective assessment of retinal FA images, namely, extent of vessel coverage or retinal vascular area (similar to ROP zone of peripheral vascular coverage), retinal venous dilation, and retinal arterial tortuosity (features seen in plus disease in humans). Sparse capillary network and absent neovascular buds at capillary tips persisted in adult OIR mice despite full retinal vascularization. Closer subjective and objective monitoring of retinal vascular patterns during this interval could allow earlier detection of abnormal vascular recovery and prevent permanent visual sequelae. In contrast to human ROP, OIR in mice is characterized by a central vaso-obliteration and subsequent neovascularization. This should be considered in adopting retinal imaging techniques to quantify peripheral retinal vascular anomalies in clinical practice.
OIR Mice Showed Aberrant Recovery in All Phases
Early Phase displayed the most dilated veins, most tortuous arteries, and least vascular area of coverage in OIR compared to RA mice. These early phase findings are similar to our previous finding of vaso-obliteration, vessel tortuosity, and dilation in vivo from P17 to P19 in OIR mice.21 However, our previous differentiation of arteries from veins was limited visually due to a smaller field of view (30 degrees vs. 50 degrees with the current instrument) and was done by superimposing vascular oxygen tension imaging onto FA images. In the current study, there was a physiological increase in retinal vascular area from early to mid-phase (OIR mice) and from early to late phase (RA mice), which appeared to be an increase in capillary density in RA mice and a regeneration of both major vessels and obliterated capillaries in OIR mice. It seems that the increased retinal veins in OIR mice in early phase counterbalanced the reduction in capillary density in OIR mice, such that there was invariably no difference in calculated retinal vascular area in early phase between OIR and RA. It is noteworthy that the hyperfluorescent optic nerves in P16 OIR mice are due to central pooling of fluorescein by leaky vessels, most likely contributed to the calculation of retinal vascular area in OIR mice. Despite a lack of difference in retinal vascular area in both RA and OIR mice in mid, late, and mature phases, OIR mice had sparser vessels without neovascular buds at their capillary tips, signifying abnormal recovery from the previous hyperoxia exposure.
Retinal veins were largest in the early phase in OIR mice more than was observed in RA mice, but they decreased in mid-phase and thereafter maintained comparable widths to RA mice through sexual maturity. Arterial tortuosity was most prominent in early phase in OIR mice, just days after capillary obliteration after the 5 days of hyperoxia exposure from P7 to P12. RA mice maintained uniformly stable retinal vein width and tortuosity throughout development, having been spared from the hyperoxia exposure and the ensuing relative hypoxia (in room air) unlike their OIR counterparts. This likely resulted in stable tissue metabolic demands from consistently adequate arterial oxygen content and uniform oxygen extraction, leading to preservation of vascular architecture in RA mice. In a previous study of in vivo vascular oxygen tension in mice with OIR from P17 to P19, the arterial oxygen tension was similar in both RA and OIR mice, whereas venous oxygen tension was much lower in OIR mice than RA mice, resulting in an increased difference in arteriovenous (AV) PO2 in OIR mice.21 This increased difference in AV PO2 from P17 to P19 falls within the “early phase” and reflects increased oxygen extraction by the surrounding avascular hypoxic retinal areas. Retinal artery tortuosity was significantly increased in OIR mice compared to RA mice throughout retinal vascular development and thus may be a more reliable and consistent marker for monitoring OIR severity than retinal vein width or retinal vascular area. It may be important to consider that angiogenic cytokines like vascular endothelial growth factor (VEGF) may have a role in the relationship between tortuosity and disease regression, but were beyond the scope of this study.
FA Shows Permanently Altered Capillaries and Arteries in Adult Mice with OIR
This in vivo study provides novel evidence of abnormal vascular recovery in OIR mice using FA. These changes are not easily appreciated with ex vivo OIR techniques likely from inadvertent loss of morphology during the processing of devitalized retinal tissues. Previously published ex vivo studies describe maximal pathological neovascularization at P17, full regeneration of retinal vascular networks from P19 to P21,23 complete vascularization of the central avascular area by P25 in OIR mice,17 and complete regression of neovascularization by P25.17,24,25 Real-time retinal FA imaging in this current study shows maximal neovascularization at P18 to P19, peripheral retinal avascularity up to P31, full regeneration of retinal vascular network from P33, and significant arterial tortuosity and reduced capillary density persisting beyond sexual maturity of the mice. Mice continue undergoing transformation and growth until the age of sexual maturity (P35); accordingly, one might argue that the observed vascular phenotype in early, mid, and late phases could be a result of sexual differentiation and somatic maturity. However, the permanently altered vascular phenotype in these mice beyond P35 (tortuosity, decreased capillary density, and absent neovascular buds on capillary tips seen at P47) indicates that these changes are pathologic and not maturational. This raises concerns about long-standing effects of oxidative stress on developing retinal vasculature. Retinal angiogenesis has been shown to be related to neurogenesis and delayed retinal vascularization may result in incomplete neural retinal tissue development,26,27 disruption of normal coordination of neurovascular pathways,26 and diminished function of the neural retina;28,29 therefore, the functional consequences of the observed persistent vascular abnormalities in this study need to be further evaluated.
Arteriovenous Abnormalities Seen in OIR Are Similar to FA Features in Clinical ROP
The current study demonstrates arteriovenous abnormalities in OIR mice using FA (arterial tortuosity, venous dilation, vascular loops, venous beading, arterial neobuds, micro- and macro-aneurysms). These FA findings are similar to clinical phenotypes seen in FA of ROP infants such as AV shunts, decreased branch vessels, loss of arcade pattern, and insufficient vasculature post-laser treatment, even after regression of ROP—features which were not evident with ophthalmoscopy.30,31 FA may have some potential value in showing finer details in select clinical cases over indirect ophthalmoscopy and digital retinal images without contrast. Arterial tortuosity and venous dilation are believed to occur due to a reduction in capillary resistance with increased blood flow to the developing retinal AV shunts.3 Retinal veins lack pericyte sheaths allowing for dilation, whereas the presence of pericyte sheaths in arteries restricts expansion and causes tortuosity.32 AV malformations are likely due to the redirection or shunting of blood towards avascular or more hypoxic areas with increased retinal metabolic demand. Reliable distinction of arterial tortuosity from venous dilation using objective methods, as shown in this study, may reduce the discrepancies in clinical diagnosis of ROP.
Long-term vascular sequelae of oxidative stress may include altered retinal vascular phenotypes (arterial tortuosity, reduced capillary density, and neovascular buds), as depicted in this study. This suggests that post-ROP vasculature, despite full vascularization to zone 3, may still be vulnerable to systemic physiological instability due to ongoing presence of active medical comorbidities that cause fluctuating systemic oxygenation and altered local retinal metabolic needs, such as prolonged assisted ventilation for chronic lung disease, intraventricular hemorrhage, sepsis, necrotizing enterocolitis, and severe gastroesophageal reflux disease. There may be a benefit to considering extended ROP monitoring of a select cohort of at-risk patients in the NICU.
Study Limitations
This study was performed in real time in each mouse, and subsequent imaging was not repeated longitudinally in the same mouse to enable establishment of baseline vascular characteristics without the bias of variables such as animal health, fatigue, or altered metabolic state. A limitation in the automated measurement for retinal vascular area included varying intensity of fluorescein dye during imaging which could overestimate (too much fluorescein flush in late angiography) or underestimate (too little fluorescein from a dark image or too early in angiography). To minimize this limitation, the image brightness was optimized until a distinct edge around each image with minimal flush was obtained. This is consistent with Hui et al.’s demonstration of a possible bias in the interpretation of increased fluorescein pooling, during video FA of spatial and temporal differences in retinal vessel flow dynamics in adult rats post-laser photocoagulation, as an area of vascular injury or a reflection of fluorescein spreading from adjacent areas.33 Therefore, images used for analysis of retinal vascular area should be taken early in angiography before significant fluorescein pooling occurs to avoid overestimation of retinal vascular area. Increased fluorescence has a negligible effect on vessel caliber in the assessment of retinal vein width and arterial tortuosity.
The limitation in the semi-automated measurements of retinal vein width and retinal artery tortuosity would be related to the user consistency in image selection, vessel identification, and measurement. It is important to select arteries and veins next to each other for measurement to avoid errors in vessel identification. The user should adhere to a uniform starting point close to the optic nerve for vessel measurement and maintain consistency with the validated vessel length for both RA and OIR mice. To ensure consistency, the FA images used for automatic quantification of retinal vascular area were those with the optic nerve in the center. FA images with off-center optic nerves were selected for semi-automated measurements of vessel tortuosity and width to optimize differentiation of arteries from veins and ensure adequate length for vessel measurement up to the validated distance for RA and OIR mice.
CONCLUSIONS
In conclusion, this study presents the first values for retinal vascular area, retinal vein width, and retinal arterial tortuosity in RA and OIR mice using FA obtained from P16 through P47. Although retinal artery tortuosity decreased with maturity, OIR mice remained significantly more tortuous than their RA counterparts at all phases of retinal vascular development. Tortuosity may be a more reliable vascular parameter to monitor in clinical ROP, when determining presence or regression of disease, than venous dilation or extent of peripheral vascular coverage. The discovery of permanently impaired vascular remodeling in live OIR mice using in vivo methods in this study has advanced the methods of studying OIR and highlights important clinical features to consider in human ROP. Monitoring the progression of distinctive abnormalities in arteries and veins may be a useful clinical diagnostic marker in ROP detection, treatment, and recovery. Future in vivo studies are needed to elucidate the biological, structural, and functional effects of abnormal vascularization in OIR, correlate the relevance of these findings to human ROP, and aid translation of therapies to preserve vision.
Olachi J. Mezu-Ndubuisi
600 Highland Ave, H4-415
Madison, WI 53792
e-mail: olachimezu@pediatrics.wisc.edu
ACKNOWLEDGMENTS
The author thanks Dr. Nader Sheibani (UW Ophthalmology), Dr. Ellen Wald (UW Pediatrics), and Dr. De-Ann Pillers (Neonatology, UW Pediatrics) for their review of the manuscript, and Qianqian Zhao and Jens Eickhoff for statistical consultations. This research was supported by the Department of Pediatrics, University of Wisconsin, Madison.
REFERENCES
- 1.Smith LE. IGF-1 and retinopathy of prematurity in the preterm infant. Biol Neonate 2005;88:237–44. [DOI] [PubMed] [Google Scholar]
- 2.Good WV. Final results of the Early Treatment for Retinopathy of Prematurity (ETROP) randomized trial. Trans Am Ophthalmol Soc 2004;102:233–48. [PMC free article] [PubMed] [Google Scholar]
- 3.Davitt BV, Wallace DK. Plus disease. Surv Ophthalmol 2009;54:663–70. [DOI] [PubMed] [Google Scholar]
- 4.Fierson WM, Saunders RA, Good W, Palmer EA, Phelps D, Reynolds J, Chiang MF, Ruben JB, Granet DB, Blocker RJ. Screening examination of premature infants for retinopathy of prematurity. Pediatrics 2013;131:189–95. [DOI] [PubMed] [Google Scholar]
- 5.Palmer EA, Hardy RJ, Dobson V, Phelps DL, Quinn GE, Summers CG, Krom CP, Tung B. 15-year outcomes following threshold retinopathy of prematurity: final results from the multicenter trial of cryotherapy for retinopathy of prematurity. Arch Ophthalmol 2005;123:311–8. [DOI] [PubMed] [Google Scholar]
- 6.Capone A, Jr., Ells AL, Fielder AR, Flynn JT, Gole GA, Good WV, Holmes JM, Holmstrom G, Katz X, McNamara JA, et al. Standard image of plus disease in retinopathy of prematurity. Arch Ophthalmol 2006;124:1669–70. [DOI] [PubMed] [Google Scholar]
- 7.Hewing NJ, Kaufman DR, Chan RV, Chiang MF. Plus disease in retinopathy of prematurity: qualitative analysis of diagnostic process by experts. JAMA Ophthalmol 2013;131:1026–32. [DOI] [PMC free article] [PubMed] [Google Scholar]
- 8.Repka MX, Palmer EA, Tung B. Involution of retinopathy of prematurity. Cryotherapy for Retinopathy of Prematurity Cooperative Group. Arch Ophthalmol 2000;118:645–9. [DOI] [PubMed] [Google Scholar]
- 9.Fielder A, Blencowe H, O'Connor A, Gilbert C. Impact of retinopathy of prematurity on ocular structures and visual functions. Arch Dis Child Fetal Neonatal Ed 2015;100:F179–84. [DOI] [PubMed] [Google Scholar]
- 10.Fulton AB, Hansen RM. Electroretinogram responses and refractive errors in patients with a history of retinopathy prematurity. Doc Ophthalmol 1995;91:87–100. [DOI] [PubMed] [Google Scholar]
- 11.Mintz-Hittner HA, Kennedy KA, Chuang AZ, Group B-RC. Efficacy of intravitreal bevacizumab for stage 3+ retinopathy of prematurity. N Engl J Med 2011;364:603–15. [DOI] [PMC free article] [PubMed] [Google Scholar]
- 12.Gilbert C. Retinopathy of prematurity: a global perspective of the epidemics, population of babies at risk and implications for control. Early Hum Dev 2008;84:77–82. [DOI] [PubMed] [Google Scholar]
- 13.Hartnett ME. Pathophysiology and mechanisms of severe retinopathy of prematurity. Ophthalmology 2015;122:200–10. [DOI] [PMC free article] [PubMed] [Google Scholar]
- 14.Gyllensten LJ, Hellstrom BE. Experimental approach to the pathogenesis of retrolental fibroplasia. I. Changes of the eye induced by exposure of newborn mice to concentrated oxygen. Acta Paediatr Suppl 1954;43:131–48. [DOI] [PubMed] [Google Scholar]
- 15.Gu X, Samuel S, El-Shabrawey M, Caldwell RB, Bartoli M, Marcus DM, Brooks SE. Effects of sustained hyperoxia on revascularization in experimental retinopathy of prematurity. Invest Ophthalmol Vis Sci 2002;43:496–502. [PubMed] [Google Scholar]
- 16.Saito Y, Geisen P, Uppal A, Hartnett ME. Inhibition of NAD(P)H oxidase reduces apoptosis and avascular retina in an animal model of retinopathy of prematurity. Mol Vis 2007;13:840–53. [PMC free article] [PubMed] [Google Scholar]
- 17.Lange C, Ehlken C, Stahl A, Martin G, Hansen L, Agostini HT. Kinetics of retinal vaso-obliteration and neovascularisation in the oxygen-induced retinopathy (OIR) mouse model. Graefes Arch Clin Exp Ophthalmol 2009;247:1205–11. [DOI] [PubMed] [Google Scholar]
- 18.Nakamura S, Imai S, Ogishima H, Tsuruma K, Shimazawa M, Hara H. Morphological and functional changes in the retina after chronic oxygen-induced retinopathy. PLoS One 2012;7:e32167. [DOI] [PMC free article] [PubMed] [Google Scholar]
- 19.Wang L, Shi P, Xu Z, Li J, Xie Y, Mitton K, Drenser K, Yan Q. Up-regulation of VEGF by retinoic acid during hyperoxia prevents retinal neovascularization and retinopathy. Invest Ophthalmol Vis Sci 2014;55:4276–87. [DOI] [PubMed] [Google Scholar]
- 20.Mezu-Ndubuisi OJ, Wanek J, Chau FY, Teng PY, Blair NP, Reddy NM, Raj JU, Reddy SP, Shahidi M. Correspondence of retinal thinning and vasculopathy in mice with oxygen-induced retinopathy. Exp Eye Res 2014;122:119–22. [DOI] [PMC free article] [PubMed] [Google Scholar]
- 21.Mezu-Ndubuisi OJ, Teng PY, Wanek J, Blair NP, Chau FY, Reddy NM, Raj JU, Reddy SP, Shahidi M. In vivo retinal vascular oxygen tension imaging and fluorescein angiography in the mouse model of oxygen-induced retinopathy. Invest Ophthalmol Vis Sci 2013;54:6968–72. [DOI] [PMC free article] [PubMed] [Google Scholar]
- 22.Smith LE, Wesolowski E, McLellan A, Kostyk SK, D'Amato R, Sullivan R, D'Amore PA. Oxygen-induced retinopathy in the mouse. Invest Ophthalmol Vis Sci 1994;35:101–11. [PubMed] [Google Scholar]
- 23.Miloudi K, Dejda A, Binet F, Lapalme E, Cerani A, Sapieha P. Assessment of vascular regeneration in the CNS using the mouse retina. J Vis Exp 2014:e51351. [DOI] [PMC free article] [PubMed] [Google Scholar]
- 24.Stahl A, Connor KM, Sapieha P, Chen J, Dennison RJ, Krah NM, Seaward MR, Willett KL, Aderman CM, Guerin KI, et al. The mouse retina as an angiogenesis model. Invest Ophthalmol Vis Sci 2010;51:2813–26. [DOI] [PMC free article] [PubMed] [Google Scholar]
- 25.Hartmann JS, Thompson H, Wang H, Kanekar S, Huang W, Budd SJ, Hartnett ME. Expression of vascular endothelial growth factor and pigment epithelial-derived factor in a rat model of retinopathy of prematurity. Mol Vis 2011;17:1577–87. [PMC free article] [PubMed] [Google Scholar]
- 26.James JM, Gewolb C, Bautch VL. Neurovascular development uses VEGF-A signaling to regulate blood vessel ingression into the neural tube. Development 2009;136:833–41. [DOI] [PMC free article] [PubMed] [Google Scholar]
- 27.Downie LE, Pianta MJ, Vingrys AJ, Wilkinson-Berka JL, Fletcher EL. Neuronal and glial cell changes are determined by retinal vascularization in retinopathy of prematurity. J Comp Neurol 2007;504:404–17. [DOI] [PubMed] [Google Scholar]
- 28.Tokunaga CC, Mitton KP, Dailey W, Massoll C, Roumayah K, Guzman E, Tarabishy N, Cheng M, Drenser KA. Effects of anti-VEGF treatment on the recovery of the developing retina following oxygen-induced retinopathy. Invest Ophthalmol Vis Sci 2014;55:1884–92. [DOI] [PubMed] [Google Scholar]
- 29.Harris ME, Moskowitz A, Fulton AB, Hansen RM. Long-term effects of retinopathy of prematurity (ROP) on rod and rod-driven function. Doc Ophthalmol 2011;122:19–27. [DOI] [PMC free article] [PubMed] [Google Scholar]
- 30.Purcaro V, Baldascino A, Papacci P, Giannantonio C, Molisso A, Molle F, Lepore D, Romagnoli C. Fluorescein angiography and retinal vascular development in premature infants. J Matern Fetal Neonatal Med 2012;25(Suppl. 3):53–6. [DOI] [PubMed] [Google Scholar]
- 31.Yokoi T, Hiraoka M, Miyamoto M, Yokoi T, Kobayashi Y, Nishina S, Azuma N. Vascular abnormalities in aggressive posterior retinopathy of prematurity detected by fluorescein angiography. Ophthalmology 2009;116:1377–82. [DOI] [PubMed] [Google Scholar]
- 32.Guaiquil VH, Hewing NJ, Chiang MF, Rosenblatt MI, Chan RV, Blobel CP. A murine model for retinopathy of prematurity identifies endothelial cell proliferation as a potential mechanism for plus disease. Invest Ophthalmol Vis Sci 2013;54:5294–302. [DOI] [PMC free article] [PubMed] [Google Scholar]
- 33.Hui F, Nguyen CT, Bedggood PA, He Z, Fish RL, Gurrell R, Vingrys AJ, Bui BV. Quantitative spatial and temporal analysis of fluorescein angiography dynamics in the eye. PLoS One 2014;9:e111330. [DOI] [PMC free article] [PubMed] [Google Scholar]