. 2016 Oct 4;5:e16921. doi: 10.7554/eLife.16921

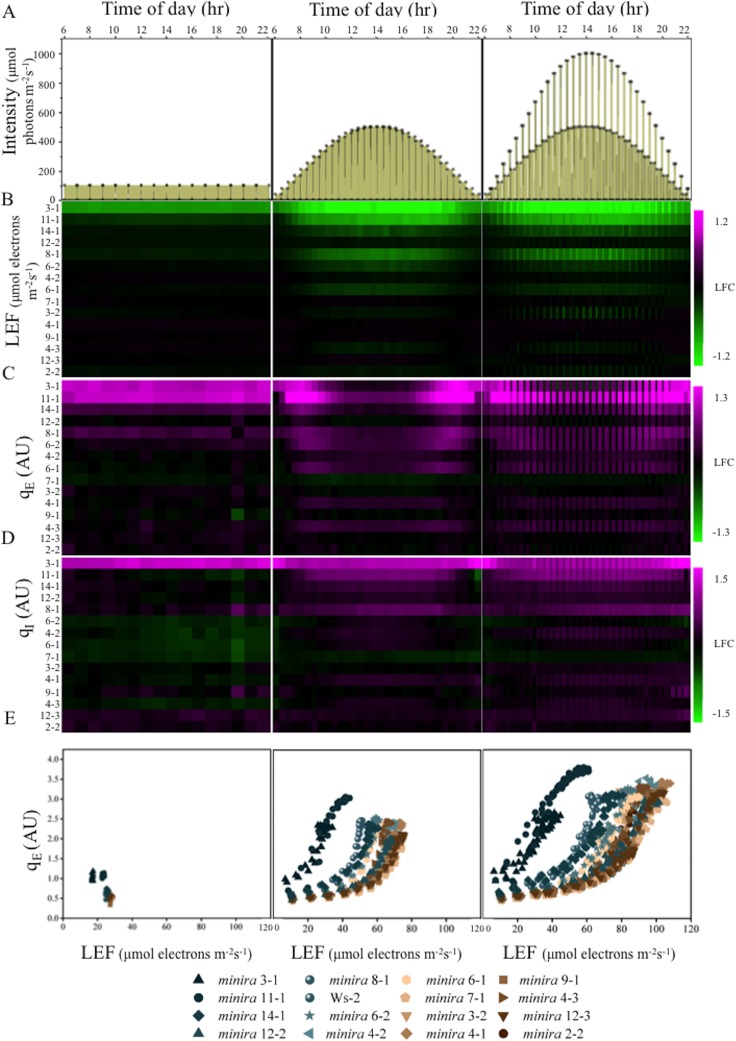
Figure 2. Dynamic light conditions enhance pmf dependent phenotypes.

Whole plant fluorescent images were captured over three days under the illumination conditions displayed in Panel A and listed in Supplementary file 2. Plants were illuminated over the 16-hr photoperiod, shown as yellow filled areas representing the light intensity when present in A, under either a constant light intensity (day one), a sinusoidal photoperiod (day two), or a sinusoidal photoperiod interrupted by fluctuations in light intensity (day three). Square symbols in Panel A indicate each light intensity change. Steady-state fluorescence parameters were captured for each plant at the end of each light condition. Panels B,C and D represent the responses of LEF, qE and qI respectively (n ≥ 3). Data are shown as log2-fold changes compared to the wild type. Kinetic data including wild type are shown in Figure 2—figure supplements 1–15. The rows were sorted in order of ascending gH+ values measured as in Figure 1C. Panel E plots the dependence of the mean (n ≥ 3) of qE against the linear electron flow (LEF) for each time point measured for the day. For visualization purposes the error bars have been omitted from E.

DOI: http://dx.doi.org/10.7554/eLife.16921.003

Figure 2.

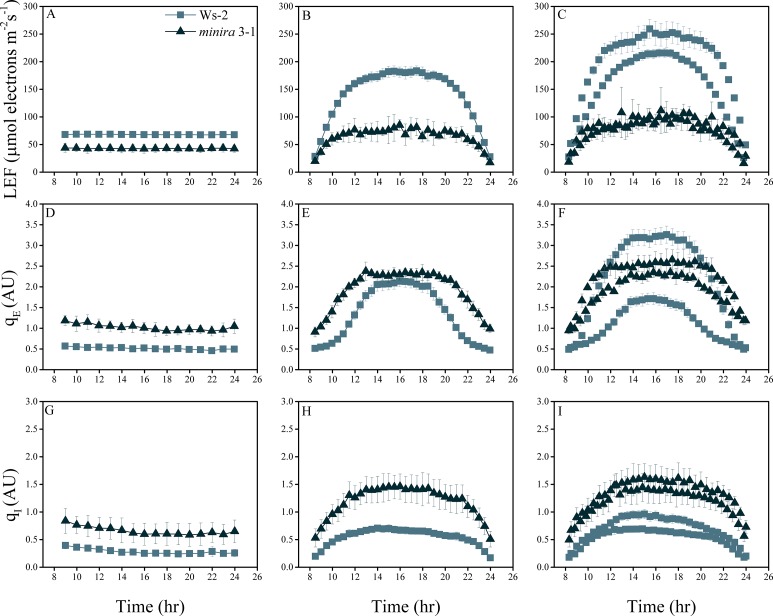
Figure 2—figure supplement 1. Whole plant fluorescence imaging phenotyping of minira 3–1 mutant.

Figure 2—figure supplement 1.

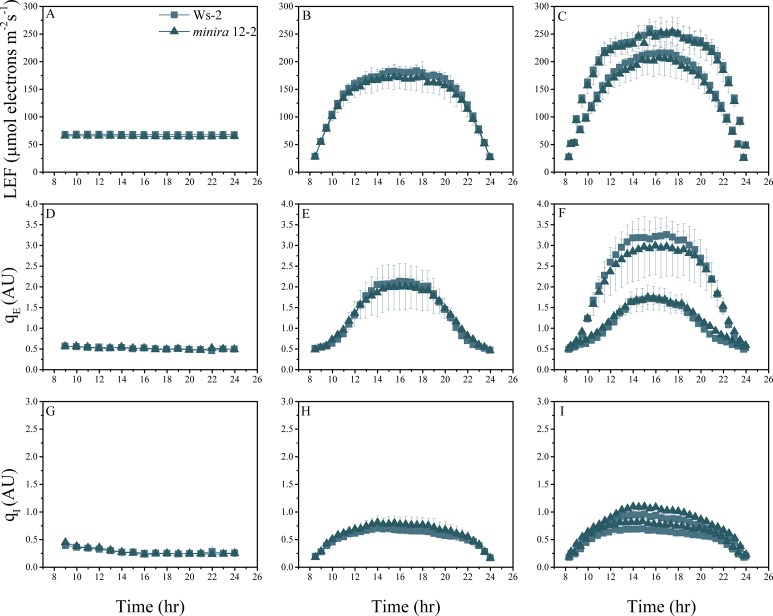
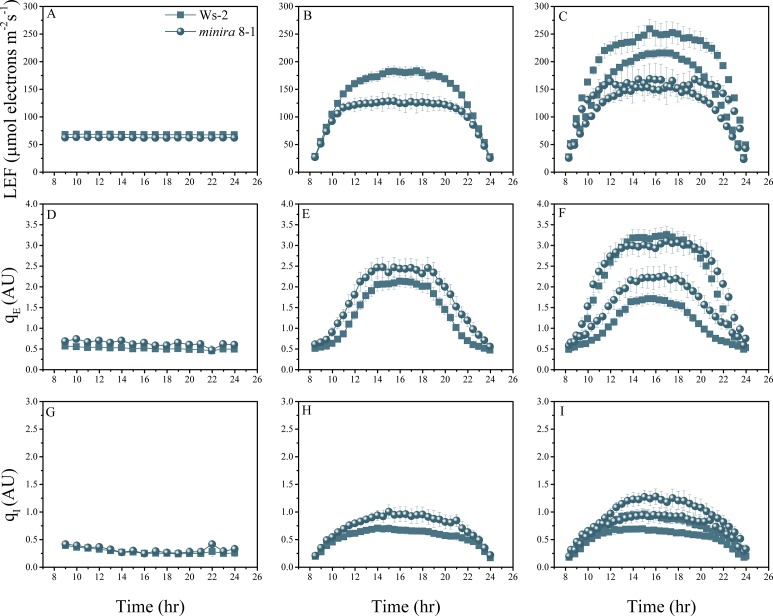
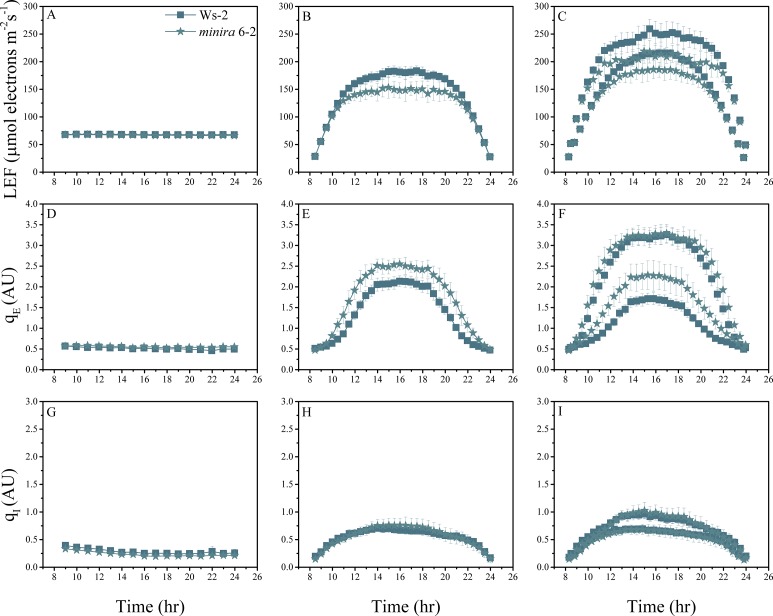
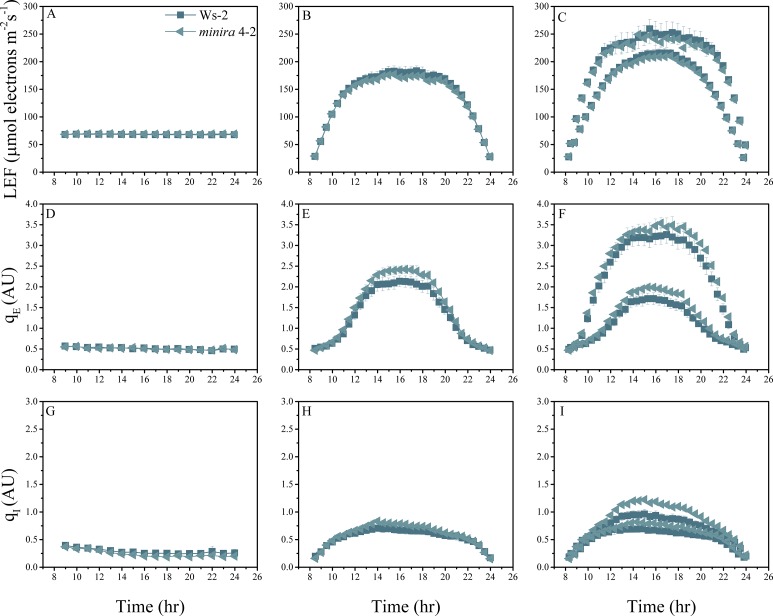
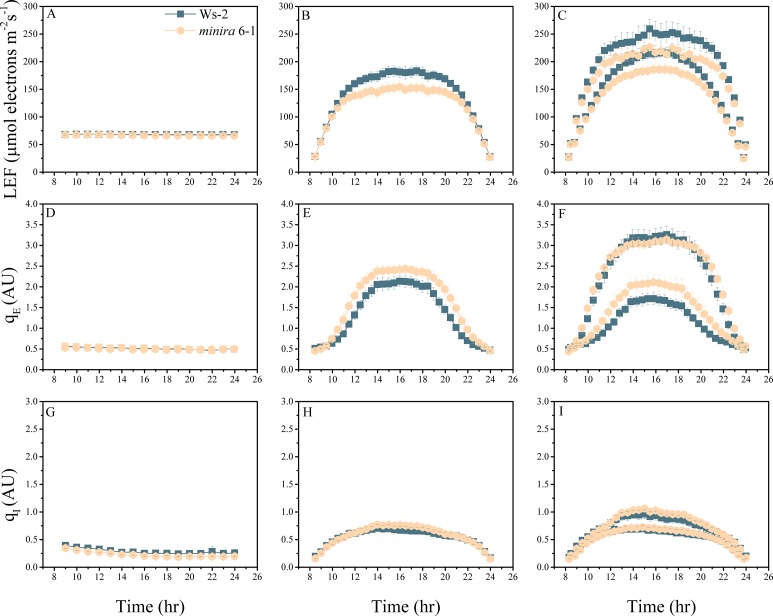
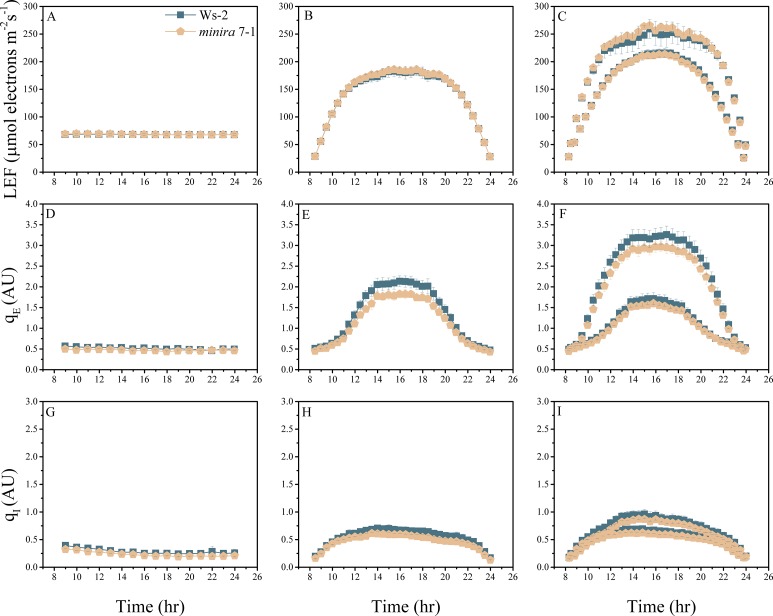
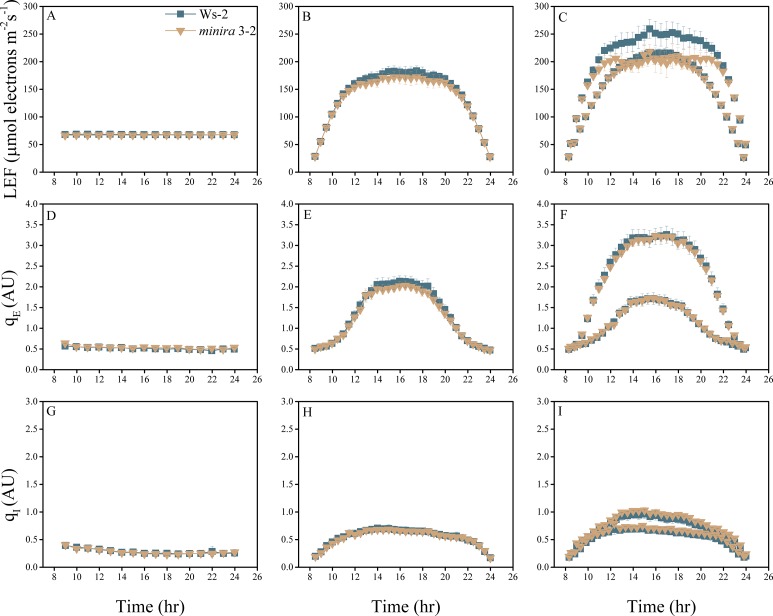
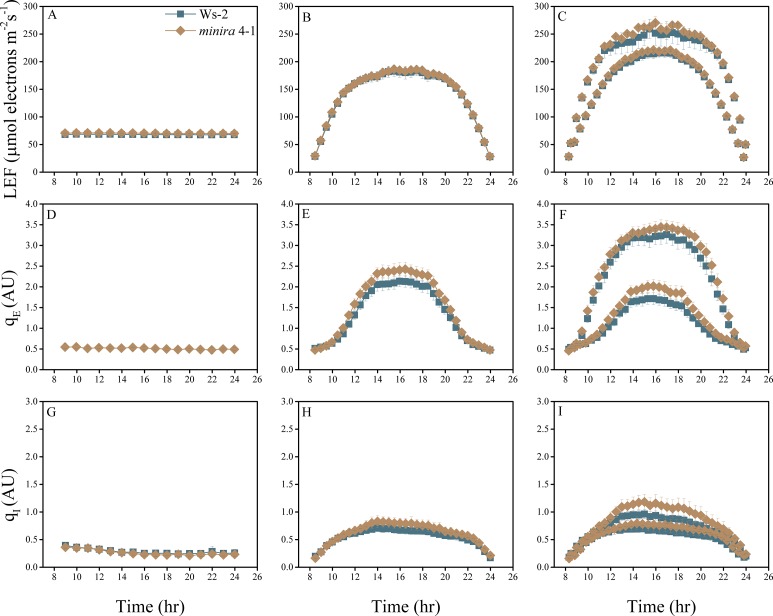
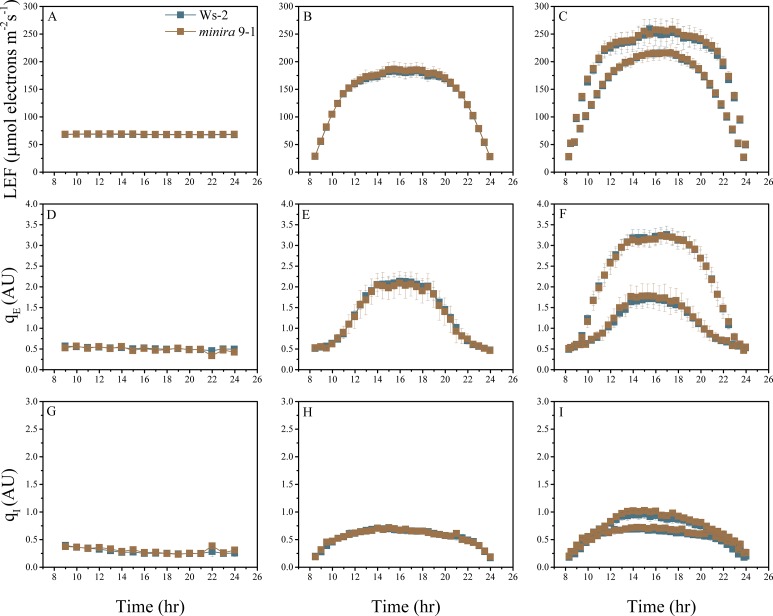
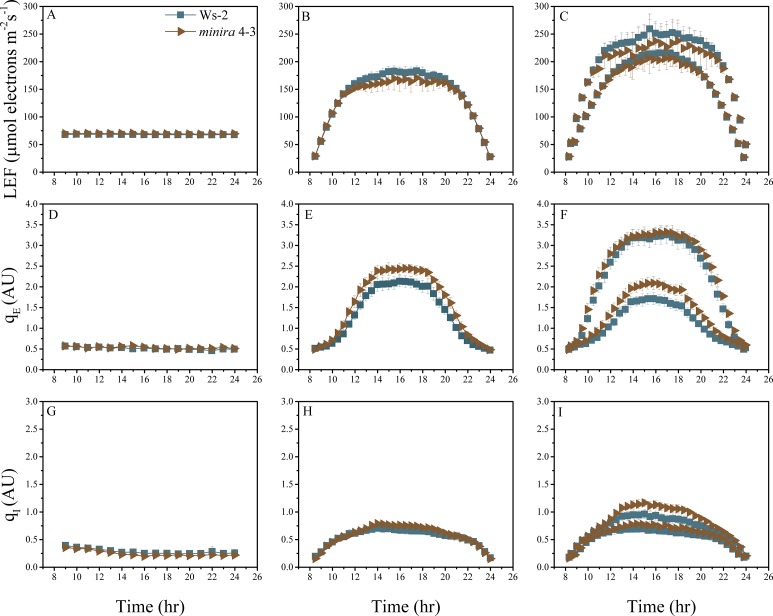
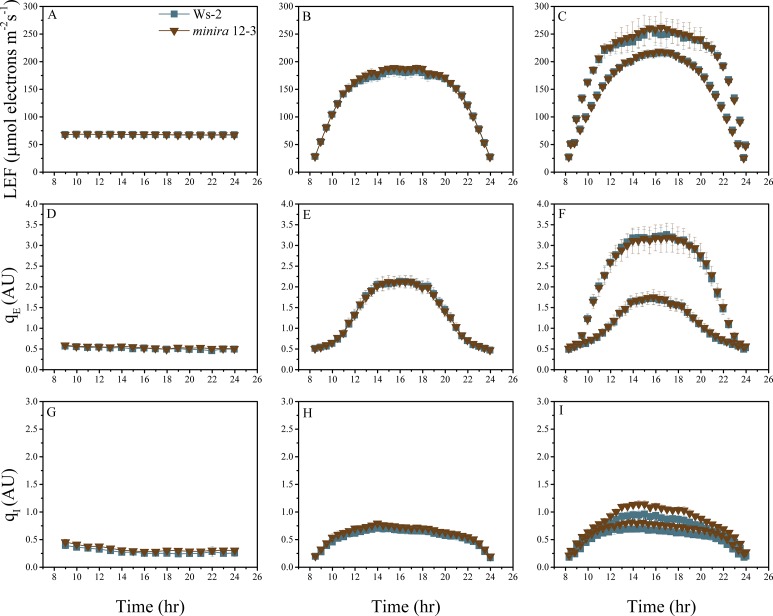
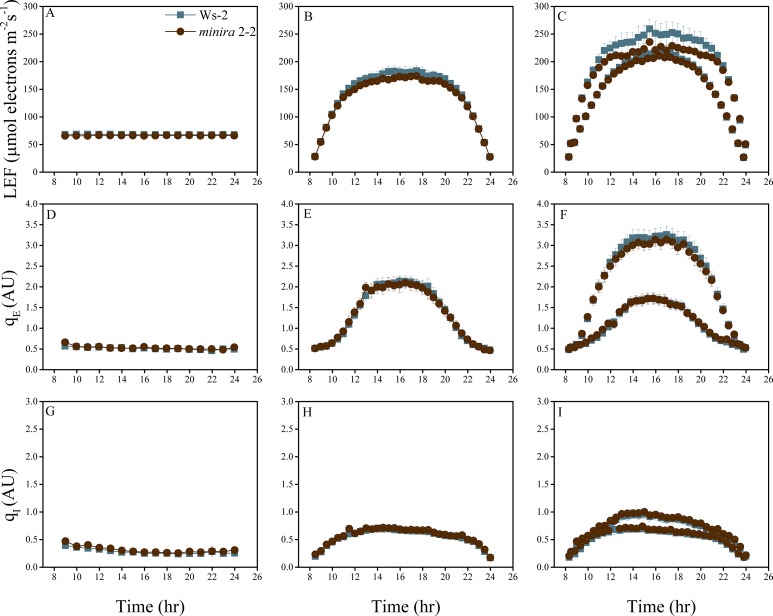
Three week old plants were imaged over three consecutive 16-hr photoperiods and fluorescent measurements taken at the end of each light transition for LEF (AC), qE (DF), and qI (GI) for Ws-2 and minira 3–1. Values represent mean of n ≥ 3 ± s.d., all of which were imaged in the same experiment. Timing and illumination are the same as Figure 2 and are detailed in Supplementary files 2a–c.

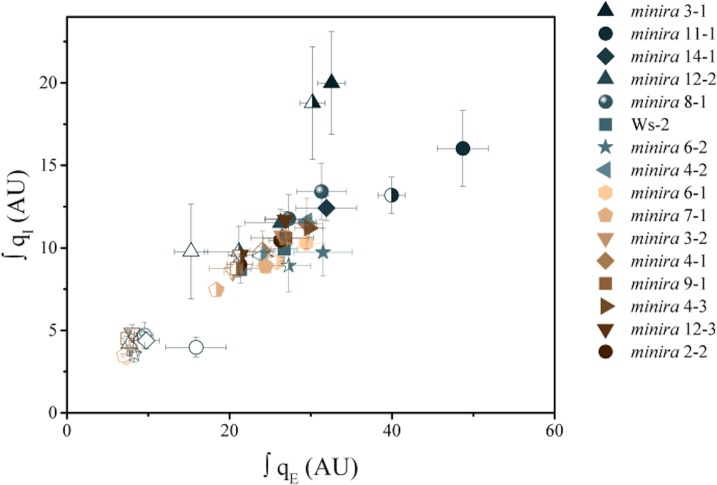
Figure 2—figure supplement 2. Increased pH-dependent quenching correlates with increased photoinhibitory quenching.

Figure 2—figure supplement 2.

Whole plant fluorescent phenotypes were measured over three consecutive photoperiods. Day one consisted of a single irradiance level (open symbols), day two of sinusoidal irradiance (half filled symbols), and day three of sinusoidal irradiance interrupted by bright fluctuations (closed symbols). The pH-dependent fluorescence quenching (qE) and photoinhibitory quenching (qI) were integrated over time for each plant for each photoperiod to determine how prolonged exposure to an increased pmf influences the extent of photoinhibition. Data represent the integrated total for each day (n ≥ 3, ± s.d).

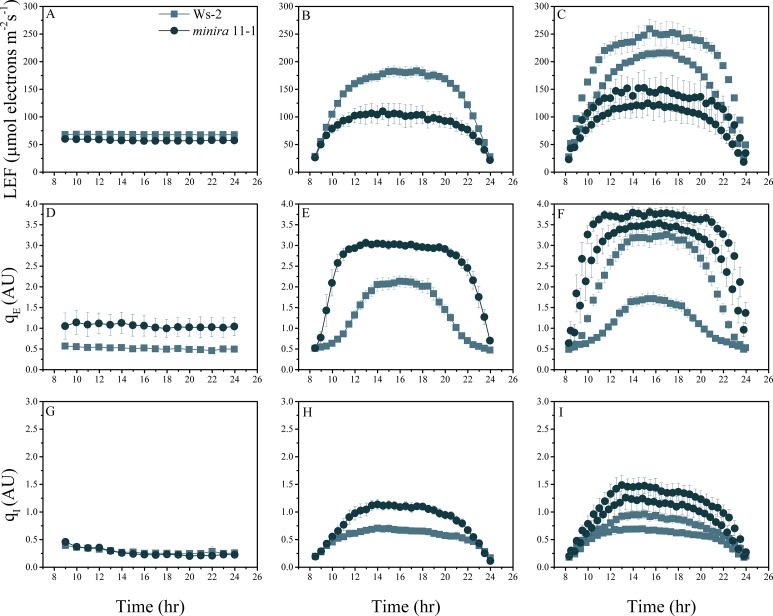
Figure 2—figure supplement 3. Whole plant fluorescence imaging phenotyping of minira 11–1 mutant.

Figure 2—figure supplement 3.

For details, please refer to the legend of Figure 2—figure supplement 1.

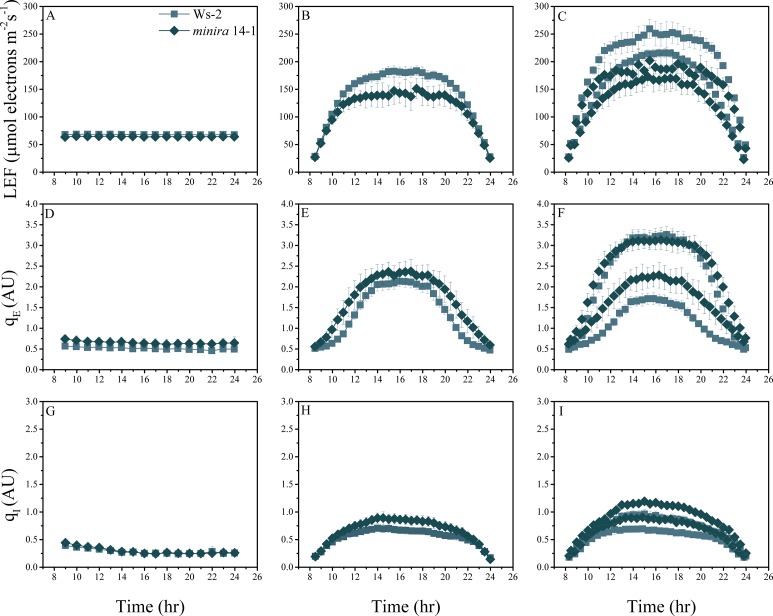
Figure 2—figure supplement 4. Whole plant fluorescence imaging phenotyping of minira 14–1 mutant.

Figure 2—figure supplement 4.

For details, please refer to the legend of Figure 2—figure supplement 1.

Figure 2—figure supplement 5. Whole plant fluorescence imaging phenotyping of minira 12–2 mutant.

Figure 2—figure supplement 5.

For details, please refer to the legend of Figure 2—figure supplement 1.

Figure 2—figure supplement 6. Whole plant fluorescence imaging phenotyping of minira 8–1 mutant.

Figure 2—figure supplement 6.

For details, please refer to the legend of Figure 2—figure supplement 1.

Figure 2—figure supplement 7. Whole plant fluorescence imaging phenotyping of minira 6–2 mutant.

Figure 2—figure supplement 7.

For details, please refer to the legend of Figure 2—figure supplement 1.

Figure 2—figure supplement 8. Whole plant fluorescence imaging phenotyping of minira 4–2 mutant.

Figure 2—figure supplement 8.

For details, please refer to the legend of Figure 2—figure supplement 1.

Figure 2—figure supplement 9. Whole plant fluorescence imaging phenotyping of minira 6–1 mutant.

Figure 2—figure supplement 9.

For details, please refer to the legend of Figure 2—figure supplement 1.

Figure 2—figure supplement 10. Whole plant fluorescence imaging phenotyping of minira 7–1 mutant.

Figure 2—figure supplement 10.

For details, please refer to the legend of Figure 2—figure supplement 1.

Figure 2—figure supplement 11. Whole plant fluorescence imaging phenotyping of minira 3–2 mutant.

Figure 2—figure supplement 11.

For details, please refer to the legend of Figure 2—figure supplement 1.

Figure 2—figure supplement 12. Whole plant fluorescence imaging phenotyping of minira 4–1 mutant.

Figure 2—figure supplement 12.

For details, please refer to the legend of Figure 2—figure supplement 1.

Figure 2—figure supplement 13. Whole plant fluorescence imaging phenotyping of minira 9–1 mutant.

Figure 2—figure supplement 13.

For details, please refer to the legend of Figure 2—figure supplement 1.

Figure 2—figure supplement 14. Whole plant fluorescence imaging phenotyping of minira 4–3 mutant.

Figure 2—figure supplement 14.

For details, please refer to the legend of Figure 2—figure supplement 1.

Figure 2—figure supplement 15. Whole plant fluorescence imaging phenotyping of minira 12–3 mutant.

Figure 2—figure supplement 15.

For details, please refer to the legend of Figure 2—figure supplement 1.

Figure 2—figure supplement 16. Whole plant fluorescence imaging phenotyping of minira 2–2 mutant.

Figure 2—figure supplement 16.

For details, please refer to the legend of Figure 2—figure supplement 1.