SUMMARY
Background & aims
Significant biological variation in macronutrient content of breast milk is an important barrier that needs to be overcome to meet nutritional needs of preterm infants. To analyze macronutrient content, commercial infrared milk analyzers have been proposed as efficient and practical tools in terms of efficiency and practicality. Since milk analyzers were originally developed for the dairy industry, they must be validated using a significant number of human milk samples that represent the broad range of variation in macronutrient content in preterm and term milk. Aim of this study was to validate two milk analyzers for breast milk analysis with reference methods and to determine an effective sample pretreatment. Current evidence for the influence of (i) aliquoting, (ii) storage time and (iii) temperature, and (iv) vessel wall adsorption on stability and availability of macronutrients in frozen breast milk is reviewed.
Methods
Breast milk samples (n = 1188) were collected from 63 mothers of preterm and term infants. Milk analyzers: (A) Near-infrared milk analyzer (Unity SpectraStar, USA) and (B) Mid-infrared milk analyzer (Miris, Sweden) were compared to reference methods, e.g. ether extraction, elemental analysis, and UPLC-MS/MS for fat, protein, and lactose, respectively.
Results
For fat analysis, (A) measured precisely but not accurately (y = 0.55x + 1.25, r2 = 0.85), whereas (B) measured precisely and accurately (y = 0.93x + 0.18, r2 = 0.86). For protein analysis, (A) was precise but not accurate (y = 0.55x + 0.54, r2 = 0.67) while (B) was both precise and accurate (y = 0.78x + 0.05, r2 = 0.73). For lactose analysis, both devices (A) and (B) showed two distinct concentration levels and measured therefore neither accurately nor precisely (y = 0.02x + 5.69, r2 = 0.01 and y = −0.09x + 6.62, r2 = 0.02 respectively). Macronutrient levels were unchanged in two independent samples of stored breast milk (−20 °C measured with IR; −80 °C measured with wet chemistry) over a period of 14 months.
Conclusions
Milk analyzers in the current configuration have the potential to be introduced in clinical routine to measure fat and protein content, but will need major adjustments.
Keywords: Fat, Protein, Lactose, Validation study, Freeze thaw cycle, Stability
1. Introduction
International guidelines on nutrition of preterm infants recommend breast milk for enteral nutrition. Its unique combination of essential nutrients leads to a wide range of benefits for the health, growth, immunity, and development of the infant [1,2]. However, feeding breast milk does not guarantee a sufficient nor standard nutrient intake due to inter- and intra-individual variation in the nutrient content of human breast milk, particularly with regards to protein and fat [3–6]. Caloric and macronutrient content of breast milk samples can vary by a factor of up to four and is influenced by many factors such as: frequency of breastfeeding, time of day, early vs. late lactation, parity, maternal diet and age, and the technique used to pump milk [7–9]. To meet the nutritional requirements, breast milk is commonly enriched with a standard milk fortifier. However, this approach is not able to compensate for nutritional deficiencies in cases where native breast milk composition is below average. Newer fortification methods aim to reduce macronutrient deficits in breast milk by individually adjusting protein and/or fat content [10,11].
To make the target fortification strategy feasible in the NICU, a simple and rapid method to measure macronutrient content at bedside is required. Several commercially-available point-of-care milk analyzer devices have been adopted from their use in dairy industry (Unity, Miris, Esetek, Calais, and Advanced Instruments). However, due to differences between cow milk and human milk, IR analyzers must first be validated for analysis of human milk before being implemented in clinical routine. Some of the differences between cow’s milk and human milk include: changes in the ratio of casein to lactalbumin concentration, absence of oligosaccharides in cow milk and different fatty acid profiles. Since milk analyzers use infrared analysis, which is highly influenced by the matrix of milk, differences between the matrices of cow milk vs. human milk may impact the accuracy and precision of the device. Thus, in order to account for variations in the matrix of human milk, validation needs to cover the whole range of available milk samples (i.e. fore, mid, and hind milk; early/late lactation period; various gestational ages). Additionally, the matrix is determined not only by macro-nutrients but also by pre-analytical treatment such as the degree of homogenization, a factor that has been paid very little attention so far.
Recently, several validation studies on commercially available milk analyzers have been published, however with inconsistent results [12–16]. The studies used small numbers of samples of selected populations (term or late lactation only), various reference methods, and different sample pretreatments.
Thus, the aim of this study was to validate commercially available milk analyzers using the full spectrum of variation of human milk including early and mature milk from mothers of both preterm and term infants, as well as to investigate the influence of sample homogenization on the analysis of breast milk.
2. Materials and methods
2.1. Study design and sample collection
In the present study, milk analyzers were validated against chemical reference methods for the quantification of macronutrient content (i.e. fat, protein, and lactose) in breast milk. Of all commercially available milk analyzers, only those devices were included that utilized 1 mL of breast milk or less, which is an acceptable amount to obtain in clinical practice.
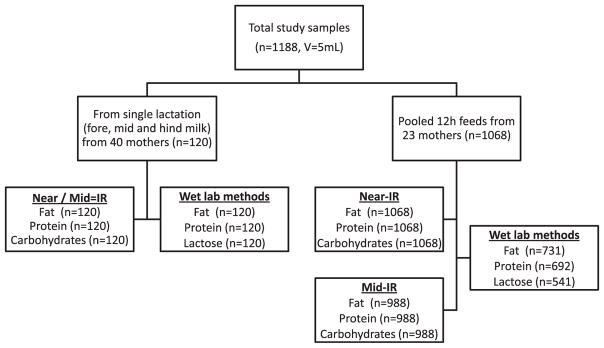
A total of 1188 breast milk samples were collected on two different occasions in order to cover different time points of lactation and various gestational ages at the time of sample collection. The first set of samples was a cross-sectional collection from 40 voluntary donors (term and preterm pregnancies; gestational age: 31.4 ± 5.6 weeks; days of life: 38 ± 36 days). Each donor provided 5 mL of each fore, middle, and hind milk during a single lactation leading to a total of 120 samples. An experienced lactation consultant assisted in collecting fore, middle, and hind milk according to the following scheme: immediately after the start of pumping (foremilk), after 5 min of pumping (middle milk), and 5 min before the expected end of lactation (hind milk). The second set of milk samples was derived from a longitudinal study of 23 volunteers (preterm pregnancies: gestational age 26.4 ± 1.7 weeks, ClinicalTrials.gov: NCT01305642) as reported recently [17]. Samples (5 mL; n = 1068) were taken from daily 12-h feeds that were prepared twice a day over a period of 27 ± 18 days and consisted of pooled aliquots of pumped breast milk (fresh and/or stored). Only mothers, who were producing sufficient amounts of breast milk for their infants, were included in the study. All samples were collected in the NICU (level 3) at the McMaster Children’s Hospital in Hamilton, Ontario, Canada. The study protocols were approved by the Research Ethics Board at McMaster University. All mothers gave informed written consent.
2.2. Sample treatment
Initially, all breast milk samples (volume of 5 mL) were homogenized for 3 × 10 s using an ultrasonic vibrator (VCX 130; Chemical Instruments AB; Sollentuna, Sweden) and divided into five 1 mL aliquots. Aliquots were subsequently used for two infrared (IR) methods (Near- and Mid-IR spectroscopy; for fat, protein, and total carbohydrates) and three chemical methods (for fat, protein, and lactose). Near-IR spectroscopy was measured immediately (according to the study protocol) using the fresh milk aliquot. Remaining samples were stored at −80 °C for latter analysis using Mid-IR spectroscopy and chemical analyses. Prior to analysis, the stored milk samples were warmed to 37 °C in a water bath and homogenized for 3 × 10 s to ensure constant quality of the samples. Figure 1 depicts the origin of samples and corresponding chemical and IR measurements.
Fig. 1.
Flow chart depicting the origin of the analyzed samples and corresponding chemical and IR measurements.
2.3. Analysis of milk samples using commercially available milk analyzers
The devices used for infrared analysis were SpectraStar (Near-IR, Model 2400 RTW, Unity Scientific, Brookfield, Connecticut, USA) and HMA (Mid-IR, MIRIS, Uppsala, Sweden) using the following software: Unity InfoStar version 3.9.0 for SpectraStar and XMA-SW version 2.0.1 for HMA. The measured IR spectra were recorded in the range from 1200 to 2400 nm (Near-IR) and from 3500 to 9600 nm (Mid-IR) for fat, protein, and carbohydrates. All samples were measured three times for Near-IR and twofold for Mid-IR without replacement. Mean values for fat, protein, and carbohydrates were used for latter analysis. The test–retest variability was 0.10, 0.16, and 0.08 g/dL for Near-IR fat, carbohydrates, and protein; and 0.07, 0.10, and 0.04 g/dL for Mid-IR respectively.
2.4. Near-IR milk analyzer
The homogenized sample (1 mL) was directly poured from the vial into the sample cup and covered with the reflector. The transparent bottom of the sample cup was visually checked to ensure there were no air bubbles. The sample cup was positioned on the instrument and scanned for 60 s. Reference scans were automatically performed to check calibration every 30 min. Daily quality controls were performed as described [18,19].
2.5. Mid-IR milk analyzer
The HMA milk analyzer was operated using the homogenized sample mode according to the manufacturer’s recommendations. Prior to analysis, a daily calibration check was performed using the calibration solution (MIRIS check), which was provided by the supplier. The homogenized milk sample (1 mL) was injected into the flow cell and measured 60 s.
2.6. Chemical methods for fat, protein, and lactose in breast milk
Chemical analyses of milk samples were performed using validated micro-methods, which required less than 1.5 mL of sample volume. The methods were based on a modified ether Mojonnier extraction (1.0 mL) for fat, elemental analysis (260 μL) for protein, and UPLC-MS/MS (100 μL) for lactose with corresponding CV’s of 1.7, 1.8, and 2.3% respectively. These micro-methods were recently published [18].
2.7. Influence of homogenization on the analytical accuracy
To investigate the effect of duration of homogenization on the accuracy of the milk analysis, two sets of experiments were performed. In the first set, three breast milk samples (6 mL each) were mixed with a stir bar for 3 min, divided into six aliquots of 1 mL each, and frozen in order to achieve equal starting conditions for the experiment. After thawing, the samples were homogenized using different approaches: In four of them, the durations of homogenization were varied (5, 10, 15, and 30 s). The fifth sample was gently shaken by hand and the sixth sample was vortexed for 60 s. The samples were then measured with the Near-IR milk analyzer (Unity) in triplicates, longitudinally every 10 min for 90 min. The average of each triplicate measurement at each time point was used for latter analysis. The Mid-IR analyzer was not used to assess the long-term stability after homogenization on the analytical accuracy, because according to the manufacturer’s instructions the device does not allow resting times of the sample within the flow cell longer than 5 min. Resting times greater than 5 min of the milk sample would result in deposition of the milk in the optical cell, which would subsequently affect the measurement and require intensive cleaning.
In the second set, milk samples were divided into 6 aliquots and homogenized using the same procedure described above, and repeated 10 times. Data was collected at 5 min using the Near-IR, and Mid-IR device and at 10 min using the Near-IR device, in order to visualize the initial changes in concentration during the most critical first minutes following homogenization.
2.8. Imaging of fat globules in breast milk
To quantify the effectiveness of homogenization of breast milk, we measured fat globule size using a standard light microscope (Olympus, model BX41TF, Tokyo, Japan). Samples were pretreated as mentioned above. After homogenization for 5, 15 or 30 s, additional images were taken after 20 and 90 min to examine any temporal changes in fat globule size. Digital images were recorded and fat globule size was measured using QCapture Pro version 6.0 software (Media Cybernetics Inc. and QImaging).
2.9. Statistical analysis
To compare results of IR devices with chemical methods, correlation analysis was performed that included the calculation of Pearson correlation coefficient using Microsoft Excel 2010 (Redmond, WA, USA). Additionally, linear regression analysis was computed. Mean precision over the whole regression range was calculated as RSS (residual sum of squares). For the Bland–Altman plot, the differences between two methods were graphed against the reference method instead of using the mean value of both methods. This approach is more appropriate from a methodological point of view if one of the methods is a reference or gold standard [18,20].
3. Results
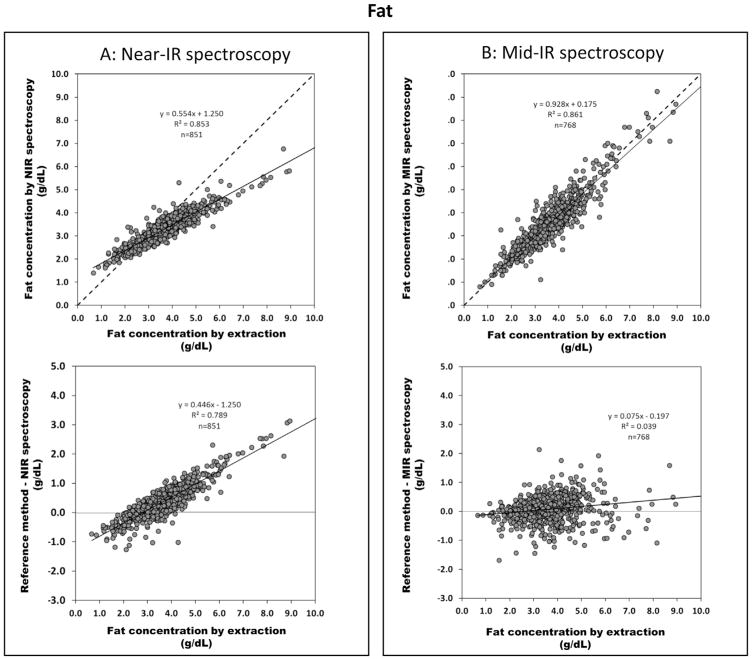
Figure 2 shows the correlation of both IR devices with the reference method for fat content (upper panel). Only the Mid-IR device is in good agreement with the reference method whereas the Near-IR device deviates considerably from the line of identity. Bland–Altman plots (lower panel) illustrate that the mean precision, given as residual sum of squares (RSS), for fat measurement is ±0.25 g/dL (Near-IR) and ±0.42 g/dL (Mid-IR). However, the Near-IR device measures precisely but lacks accuracy (i.e. it deviates from the line of identity) and considerably underestimates the true fat content. There was no difference found in the correlation between the two sets of samples (different time points of lactation vs. 12 h batches, data not shown).
Fig. 2.
Validation of IR methods for fat content: upper panel correlates fat content analyzed from reference method (ether extraction) with (A) Near-IR spectroscopy (n = 851) and (B) Mid-IR spectroscopy (n = 768) (dash line indicates line of identity); lower panel shows Bland–Altman plots indicating the difference between fat values obtained by the reference method (x-axis) and Near-IR spectroscopy or Mid-IR spectroscopy represented in y-axis.
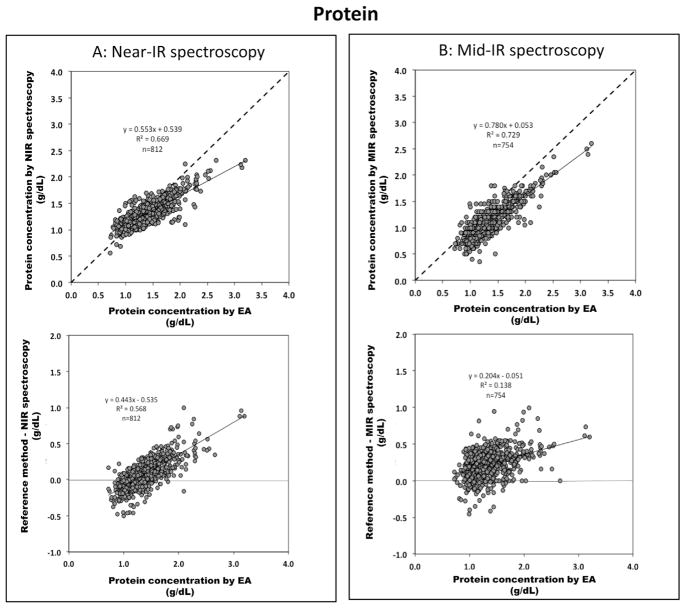
Data for protein is shown in Fig. 3. The mean precision of protein determination is ±0.14 g/dL for the Near-IR and ±0.18 g/dL for the Mid-IR. However the Mid-IR device systematically underestimates the protein content by 0.2 g/dL. In contrast, the Near-IR device has a tendency to overestimate samples with low protein content (typically <1 g/dL) and underestimates samples with higher protein content by 25%. No differences were found for protein in the correlation between the subgroups (different time points of lactation vs. 12 h batches, data not shown).
Fig. 3.
Validation of IR methods for protein content: upper panel correlates true protein content analyzed from reference method (elemental analysis) with (A) Near-IR spectroscopy (n = 812) and (B) Mid-IR spectroscopy (n = 754) (dash line indicates line of identity); lower panel shows Bland–Altman plots indicating the difference between protein values obtained by the reference method (x-axis) and Near-IR spectroscopy or Mid-IR spectroscopy represented in y-axis.
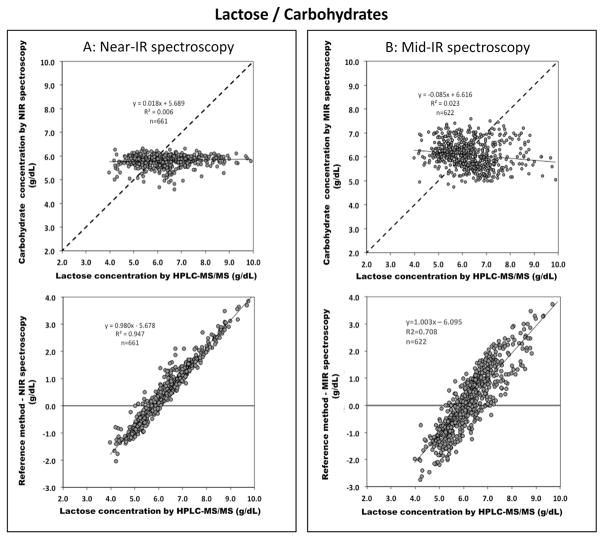
Lactose levels (Fig. 4) are poorly correlated between chemical analysis and both IR methods (r2 of 0.006 and 0.002 for Near-IR and Mid-IR, respectively). Both milk analyzers measure the variation of lactose concentration only in a small range – Near-IR and Mid-IR values vary only between 5.5–6.5 g/dL and 5.5–7 g/dL – which does not seem to reflect the true variation (chemical analysis: 4 and 8 g/dL). There was no difference was found in the correlation between the two sets of samples (different time points of lactation vs. 12 h batches, data not shown).
Fig. 4.
Validation of IR methods for lactose content: upper panel correlates lactose content analyzed from the reference method (UPLC-MS/MS) with (A) Near-IR spectroscopy (n = 661) and (B) Mid-IR spectroscopy (n = 622) (dash line indicates line of identity); lower panel is Bland–Altman plots showing the difference between lactose values obtained by the reference method (x-axis) and Near-IR spectroscopy or Mid-IR spectroscopy represented in y-axis.
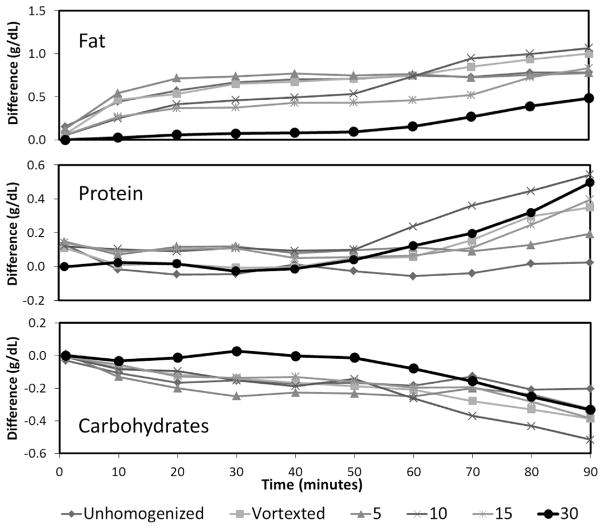
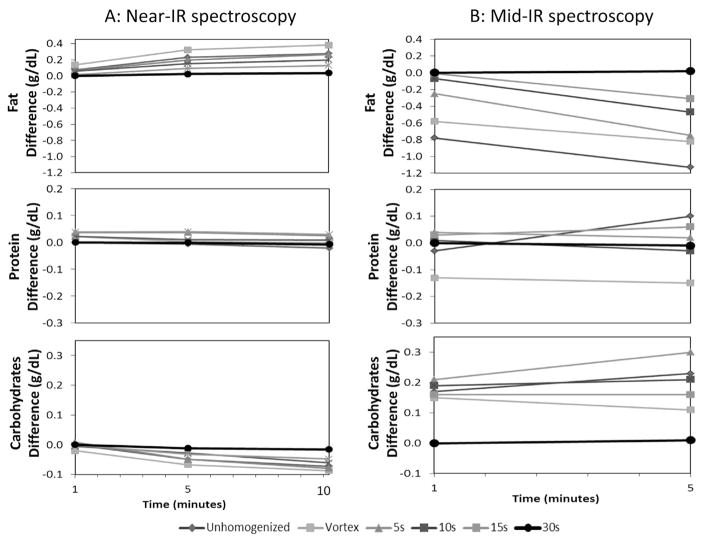
The effect of homogenization (0–30 s) and read-out interval (1–90 min, shown only for Near-IR as Mid-IR does not allow readout intervals >5 min, see Methods) on the accuracy of the measurement is demonstrated in Fig. 5. Compared to the reference point (i.e. 30 s homogenization and immediate read-out) a less intense homogenization procedure as well as a delayed readout interval (up to 90 min) significantly distorts the analysis. Especially, the measurement of lactose and fat are inversely affected by the degree of homogenization. This finding impressively illustrates how the matrix of milk influences the determination of the individual macronutrients. Figure 6 is an expanded plot showing the dynamics during the initial 10 min after homogenization for both the Near-IR (1–10 min; left panel) as well as for the Mid-IR device (1–5 min; right panel).
Fig. 5.
Change in fat, protein, and lactose readings in breast milk samples (n = 3) over 90 min that have been homogenized at different settings (i.e. homogenized for 5, 10, 15, and 30 s, shaken by hand, and vortex for 1 min) using Near-IR spectroscopy. The average of the differences between each measurement and the initial (1 min) measurement (homogenized for 30 s) was calculated.
Fig. 6.
Change in fat, protein, and lactose readings in breast milk (n = 10) over 10 min and 5 min analyzed by Near-IR and Mid-IR spectroscopy, respectively. Samples obtained from the same procedure of (A). (Measurement at 1 min mark is considered as immediate measurement due to the fact that it takes about 1 min to generate the data).
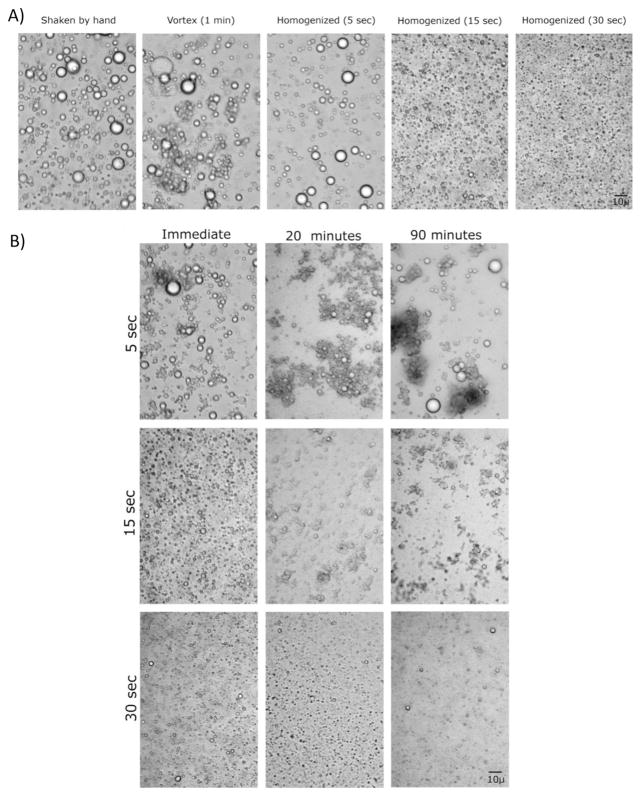
The distribution of fat globules in breast milk after different intensities of homogenization is displayed in Fig. 7. Part B demonstrates that fat globules re-aggregate during the read-out interval. This reformation of droplets is slowest in samples which have been homogenized for 30 s. These findings nicely parallel the changes of measured values shown in Fig. 5.
Fig. 7.
(A) Imaging the change in fat droplet sizes of breast milk samples that correspond to different homogenization procedures; i.e. homogenized for. 5, 15, and 30 s, shaken by hand, and vortexed for 1 min, (B) Time-course analysis of change in fat droplet size (i.e. 0, 20, and 90 min) after homogenization for 5, 15, and 30 s.
4. Discussion
The present paper evaluates two commercially available IR devices against chemical reference methods for the analysis of macronutrient content in breast milk. We showed that the tested milk analyzers have a high reproducibility of measured macronutrient content; however the lack of accuracy is of major concern. We feel that further improvement is needed before these devices can be recommended in clinical routine.
To date, four studies have evaluated the two infrared milk analyzers investigated in the present study [12,13,15,16,21]. These two devices uniquely require only 1 mL of breast milk, making them feasible for use at bedside. The studies presented inconsistent conclusions and found varying correlations between IR measurement and chemical analysis, likely due to differences in the sample composition that resulted from using selected samples or a limited subpopulation (Table 1). Our study differs from the previously mentioned studies by (i) using published reference methods that were validated for breast milk [18,19], (ii) analyzing a large number of samples that span the whole range of gestational age and lactation periods, and (iii) using appropriate pretreatment (homogenization) of the sample (Table 1). These features are key to an optimal validation of the IR devices.
Table 1.
Summary of previously published articles on commercially available human milk analyzers.
| Device | IR-method | Reference methods | Sample size (n) and milk type | Mean or range gestational age [weeks] (Mean birth weight [g]) | Mean day of the first sample or day of full enteral feeding [days] | Milk treatment prior to analysis (Homogenization) | |||||
|---|---|---|---|---|---|---|---|---|---|---|---|
| Menjo (2008) | Miris | Mid-IR | F: modified Folch P: Kjeldahl L: HPLC |
32 | preterm milk | N/A | N/A | warmed to 37 °C, stirred the milk | |||
| Casadio (2010) | Miris | Mid-IR | F: spectroscopic esterified fatty acid (EFA) method | 30 | various stages of lactation (milk bank) | N/A | N/A | warmed to 40 °C, homogenized (1.5 s per 1 mL) | |||
| P: modified Bradford (colorimetric) L: enzymatic |
samples at 4 different dilutions | ||||||||||
| Silvestre (2012) | Miris | Mid-IR | F: Gerber (volumetric) P: Bradford (colorimetric) L: chloramine-T (colorimetric) |
39 | mature milk | 37–41 | N/A | warmed to 40 °C, homogenized (1.5 s per 1 mL) | |||
| Corvaglia (2008) | Esetek | Near-IR | F: Gerber (volumetric) P: Kjeldahl |
124 | preterm milk, n = 55term milk, n = 69 | 26–32 37–41 |
N/A | N/A | |||
| Sauer (2010) | Unity | Near-IR | F: Mojonnier (gravimetric) | 52 | calibr | valid | calibr 32 (1780) |
valid 35 (2380) |
calibr 734 |
valid 102 |
warmed to 40 °C gently shaken by hand |
| n = 32 morning | n = 6 morning | ||||||||||
| P: Kjeldahl | n = 5 evening | n = 0 evening | |||||||||
| L: HPLC | n = 3 hind-milk | n = 1 hind-milk | |||||||||
| n = 2 fore-milk | n = 3 fore-milk | ||||||||||
| Smilowitz (2014) | Advanced Instruments | FT-Mid-IR | F: Mojonnier (gravimetric) | 116 | calibr | valid | N/A | 2–368 | Diluted 1:10 (H2O) | ||
| P: Kjeldahl L: HPLC |
n = 14 term & preterm milk | n = 84 term & n = 32 preterm milk | warmed to 38 °C, vortexed (20 s) | ||||||||
| Present study | Unity & Miris | Near-IR & Mid-IR | F: Mojonnier P: Dumas L: UPLC-MS/MS |
1188 | term & preterm milk early & late lactation | 30 ± 5 | 30 ± 25 | warmed to 40 °C, homogenized 30 s (1.5 mL) | |||
F: fat, P: protein, L: lactose.
The composition of breast milk is highly variable and using selected samples or limited subpopulations can introduce errors which are explained by principles of IR spectroscopy: IR spectroscopy measures vibrations of bonded atoms and functional groups within a molecule. Molecules that possess the same functional groups show absorption bands at similar frequencies. The IR spectrum of milk shows considerable spectral overlap within both, the same class of substances (e.g. mono-, di-, and oligosaccharides), and also between different classes of substances that show similar C–C swings, such as in carbohydrates and fat. This fact explains why accuracy and precision of a calibration is influenced by the matrix and why a qualitative change in the principal composition may alter results. The composition of cow and breast milk is significantly different, thus each matrix needs its specific calibration to yield reliable results. Consequently, a calibration of preterm milk or milk of early lactation might also differ from term milk or milk from late lactation and may lead to errors if the differences in the matrix are not mirrored in the model used for calibration. Hence, it is beneficial to perform the calibration including the full range of the expected variation in breast milk content.
The major advantage of our study lays in sample size and composition. Our samples, approximately 900, include milk of preterm and term infants ranging from early to late lactation periods. This data set allows a more robust calibration compared to an average of 38 samples used in previous evaluations of the two IR-devices.
Another important factor that contributes to the diverging findings in literature is a pre-analytical error caused by inappropriate homogenization. Previous work done in cow milk found a strong impact of homogenization on the quality of IR measurements [22,23]. Our study is the first to address in detail the influence of homogenization on precision and accuracy of macronutrient measurement in human milk using IR. We visualized how quality and duration of homogenization affect size and distribution of fat droplets and its influence on the spectral response of human milk. Several researchers suggested that homogenization should reduce fat globule diameters to less than 3 μm to limit light scattering [24,25]. Figure 7 shows that we could achieve the appropriate droplet size after 30 s of homogenization. We therefore conclude that for a sample volume of 1 mL, a homogenization time of 30 s is needed for both methods.
Measurement of protein content
In our study we identified an overall imprecision of ±0.14 and 0.18 g/dL for both IR-devices. This translates into a random error of 15–20% which is more than one order of magnitude higher than the chemical method (CV < 2.0%) [18]. Additionally, Mid-IR systematically underestimates true protein concentration by −0.2 g/dL whereas Near-IR seems to use an inappropriate scaling factor. Previous studies had already identified significant imprecisions for IR protein measurement and also deviations from the line of identity (i.e. accuracy). In these studies, however, smaller sample sizes and a selective composition of samples (Table 1) led to significant scattering of data points so that the reported trends were not homogeneous [13,16]. In contrast, our study spans a wide range of protein contents (i.e. 0.6–2.6 g/dL) from different lactation periods. We believe that this high data density minimizes the effect of outliers and provides a basis to recalibrate the devices.
For use in daily routine, both imprecision and inaccuracy of the IR methods need to be discussed in clinical context. In our recent trial about target fortification of breast milk, we could predict weight gain from the ingested milk volume (r = 0.83) [17]. On average 0.7 ± 0.2 g/dL of extra protein was added to routinely fortified breast milk (average protein concentration of 1.2 g/dL plus additional 1 g/dL from routine fortifier) to achieve ESPGHAN recommendations (3 g/dL). Assuming a milk intake of 150 mL/d, this practice led to an extra protein intake of 1.1 g/kg/d and increased weight gain by up to 6 g/kg/d (e.g. from 12 to 18 g/kg/d) [26]. Consequently, a random error ±0.2 g/dL would lead to a random deviation from ESPGHAN guidelines of ±0.3 g/kg/d protein which may translate to a random deviation of ±1–2 g/kg/d in weight gain (e.g. targeted weight gain would rise from 12 to somewhere between 16 and 20 g/kg/d). Although analysis of protein content in the current setting seems to be superior to the current practice of not measuring breast milk levels at all, we feel that manufacturers should spend more efforts in increasing the precision of the measurement (e.g. by repeating the number of scans, etc.).
Measurement of fat content
Along with protein, to achieve appropriate growth, the energy intake must match growth [27]. Since fat is a major source of calories, accurate and precise measurement of fat is of equal importance to determining protein content. In our study, fat content ranged from 1.0 to 8.0 g/dL and impressively confirms that fat shows the highest variability of all macronutrients. Assuming a milk intake of 150 mL/kg/d and an enteral fat absorption of 85%, a variation of 7 g fat/dL translates to a variation of caloric intake of 75 kcal/kg/d. These figures illustrate why growth rates vary amongst infants even if protein intake is optimized (Fig. 2).
The random error (imprecision) of the IR-measurement of fat content is roughly ±0.5 g/dL. Despite the corresponding blur of ±7 kcal/kg/d, this value may be acceptable for use in clinical routine. In terms of systematic error, Mid-IR measures fat content accurately (slope 0.93), in contrast the Near-IR device which considerably deviates from the line of identity (slope 0.55). Similar deviations have been reported by others [13,16].
Measurement of lactose content
Lactose content of breast milk will also influence the quality of growth and weight gain [28,29]. It has been shown that a more fat-dominated composition of non-protein calories favors protein oxidation, an unwanted metabolic pathway for a growing organism. In contrast, higher carbohydrate intakes facilitate protein accretion and thus growth. A targeted fortification strategy therefore will also require accurate and precise measurement of lactose content of breast milk at bedside. Lactose content in our samples spanned a range of 4.0–8.0 g/dL indicating that lactose content is quite variable in human breast milk – a finding which is in line with data from previous studies [18,19,30–34]. According to our data, IR devices are not able to measure lactose content in breast milk with an acceptable precision and accuracy. This result is confirmed by all, but one previous IR evaluation study [12,13,15,16].
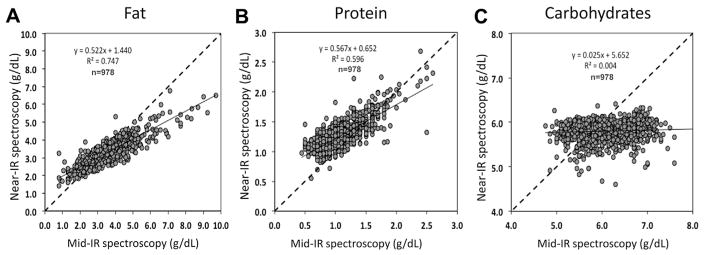
The inability to precisely and accurately quantify lactose content in human milk may be explained by the presence of large amounts of oligosaccharides in breast milk that are only found in minimal amounts in cow milk. This poses a problem because all oligosaccharides contain a terminal lactose molecule and its spectral absorption cannot be differentiated from that of free metabolizable lactose. Coppa et al. delineated that during lactation, secretion of oligosaccharides and lactose in breast milk behave inversely i.e. increasing lactose concentration is paralleled by decreasing oligosaccharide concentration [30]. Thus the sum of both constituents is constant to a certain extent. Unfortunately not all published literature differentiates between these two different major carbohydrate components. This might also explain why recent papers reported “lactose” content measured by Mid-IR to have little variation [35,36]. Figure 8 depicts that – different from protein and fat – no correlation was found between both devices in measuring “lactose”, thereby highlighting a consistent systematic error between both IR-methods.
Fig. 8.
Correlation of the Mid-IR (Miris) and Near-IR (Unity) devices for fat (A), protein (B) and carbohydrates (C).
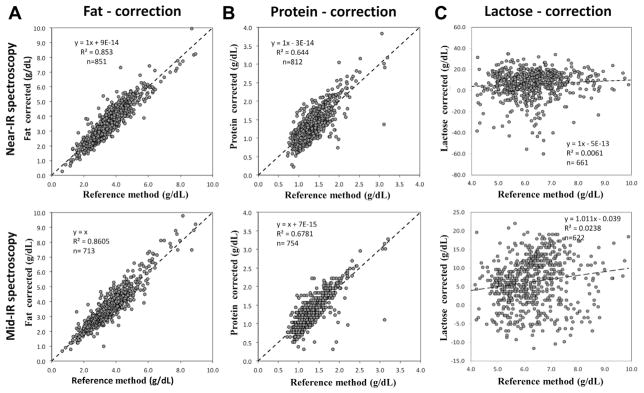
We suggest several approaches to improve the low accuracy (i.e. deviation from the line of identity) of both devices in measuring protein and fat content. A correction can be made almost immediately by transforming the regression equation used for protein and fat measurement by the Near-IR device. Figure 9 (upper panel) shows the effect of this correction: accuracy has greatly improved for both devices without compromising precision. Another approach would be to fully recalibrate the IR devices using an extended data set, however this would be time and effort-intensive and also require buy-in and cooperation of the manufacturers. These steps will improve both precision and accuracy for protein and fat but they are not capable to eliminate the error observed for lactose measurements. In fact, infrared spectroscopy does possess the potential to selectively determine lactose content, but this will require significant adjustments in the analytical setup, such as adding additional filters or analyzing additional spectral regions. Very recently, a paper by Smilowitz et al. describes the first-time use of Fourier Transform Mid-IR (FT-IR) technology [21]. Different from fixed filter technology, FT-IR generates the whole Mid-IR spectrum thus allowing to expand the number of analytes provided that adequate sensitive wavelength regions can be identified.
Fig. 9.
Recalibration of the Mid-IR (Miris) and Near-IR (Unity) devices for fat (A), protein (B) and carbohydrates (C) using the linear regression approach.
5. Conclusion
We have presented a complex and elaborate study to evaluate bedside milk analyzers, using a wide range of macronutrient contents and standardized procedures. Our results suggest that IR measurement of protein and fat may yield acceptable results for clinical use in target fortification strategies. Further improvements of accuracy can be achieved by the manufacturers through implementation of our suggested refinement. However, our results also indicate that the accuracy and precision for the measurement of lactose, as a major contributor of energy in human milk, is insufficient. To allow measurement of all three macronutrients at bedside major revision of the milk analyzers is needed, such as adding additional spectral information and modification of the optical unit. With the newly-emerging concept of target fortification, bedside devices are needed to tailor breast milk composition for optimal postnatal growth. We hope the manufacturers of these devices will invest in research in order to provide the required accuracy and precision.
Addendum: The influence of storage temperature, storage time and vessel wall adsorption on stability and availability of macronutrients in frozen breast milk
During the review process of this paper the relevant question came up how freezing and storage of breast milk impacts the stability of macronutrients. As currently there is confusion due to inconsistent data published in the literature, we have reviewed the available literature and added the following paragraph.
Milk is not a simple liquid, but a fat-in-water emulsion that additionally contains soluble and cellular components. If unprocessed, this rather complex composition spontaneously tends to separate and inherent bioactive substances may alter some of its components. Common problems faced when handling milk samples are (i) creaming, (ii) adherence of fat to container walls, (iii) the impact of freeze–thaw cycles on substrate stability, and (iv) loss of substance during storage/freezing due to residual enzymatic activity or other mechanisms leading to bio-degradation. If not adequately addressed, samples might not represent the composition of the batch of interest for analysis (i) or levels of nutrients may be falsely measured (ii–iv). Sample treatment and storage, however, is not a new problem: there are numerous papers from various epochs on cows and human milk assessing these four factors, thereby using different chemical and physical methods [37–45].
In order to properly assess breast milk composition, elaborate pre-analytical procedures thus are required. In summary, the following has been shown:
Appropriate homogenization is crucial and minimizes the risk to draw a non-representative sample and was recently also emphasized by Garcia-Lara [44]. However, we feel that the recommendations given by the manufacturers are not sufficient and need to be modified (see also Figs. 5 and 6).
The absorption of fat onto container walls mainly affects fat/lipids levels and is influenced by the surface-to-volume ratio of containers used. It is more pronounced in smaller vials compared to larger ones. This “loss” of material is a one-time effect due to milk coming into contact with the container surface and should not be confounded with an ongoing loss of material due to bio-degradation while frozen. When reviewing all available literature the average losses seem to be in the range of 5–10% [41–44]. This is compatible with fat losses reported for tube feedings [46]. The magnitude of this adsorption can be reduced using an appropriate homogenization procedure [47].
The process of freezing and thawing may break down structural integrity and also reduce bio-activity of functional proteins (like enzymes, etc.). However, it has not been shown that the nutritional value of macronutrients is significantly affected. Vieira et al. reported a 2% loss for protein and fat, but not for lactose, after one cycle of freezing and subsequent thawing (measured with Mid-IR). However, Berkow et al. did not report a loss after 3 repeated cycles [43,39].
There is no significant bio-degradation of lipids provided that nutritional samples are stored at −70 °C or below [38,39]. It has been shown in three out of four studies (all using Mid-IR) that there is no loss of protein over time [43–45]. Interestingly the fourth study found a 4–8% increase (!) during a 48 h freezing interval, a result which however was not fully understood [41].
For lactose, the results of all four studies are not conclusive: Garcia and Vieira found no effect up to 7 days of storage, and only a 2% loss after 3 months, while Chang found a 1% increase (!) during 48 h of storage [41,43,44]. Strikingly, the study of Lev claimed an almost linear loss of up 30% during the 3-month interval [42], which is in contrast to all other studies. It is of interest to note that this study is the only one using −80 °C freezing, thus expecting reduced bio-activity. It is more likely that this finding is due to some poor control of experimental conditions. If these findings were correct lactose would be almost completely degenerated after a storage interval of 160–200 days which is in contrast with common understanding.
In our own studies we were unable to confirm such substrate losses and we would like to illustrate this with two data sets.
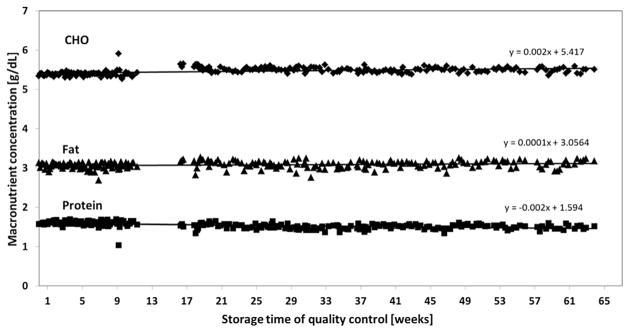
To longitudinally assess the quality of our IR milk analyses we have generated a quality control sample according to GCP guidelines by aliquoting a high-volume breast milk sample and stored the vials at −20 °C. On each day milk analyses were performed one of the aliquots was thawed and measured as quality control. Figure 10 depicts the consecutive results obtained during a series of 200 analyses. No significant loss of either of the macronutrients occured over a period of more than 400 days (Fig. 10).
We also compared our macronutrient data with respect to time lag between both the Near-IR and the wet lab analysis. As described in the “Methods” chapter, Near-IR was performed immediately after 12-h feed were prepared – whereas chemical analysis was performed later as a batch. By comparing the data according to their time difference between IR and wet lab, this measurement will allow us to assess the impact of storage time. If indeed a major loss of substrate would occur over time at −80 °C it would be expected that samples with the longer intervals would project down-shifted in the wet lab-IR scatter plots. Figure 11 depicts the respective scatter plot for all three macronutrients. It can be easily seen that there is no such left shift and thus a sig-nificant loss of substrate is not very likely.
Fig. 10.
Stability of human milk samples (quality control, −20 °C storage temperature) over 400 days.
Fig. 11.
Impact of storage time: correlation of Near-IR (uncorrected readings) and wet lab methods for fat, lactose. Data are grouped by the lag of time between Near-IR and wet lab methods as indirect measure of nutritional degradation.
In summary, we feel confident to conclude that storage at −80 °C does not have a significant influence on macronutrient levels in human breast milk. With respect to the influence of wall adhesion we feel that we sufficiently control for its influence by the elaborate homogenization approach we used and validated.
Acknowledgments
This paper is dedicated to Dr. John (Jack) Sinclair, Professor Emeritus, McMaster University and founding director of the Neonatal Intensive Care Unit at McMaster Children’s Hospital, with great respect for his outstanding life work that established the basis for evidence-based practice in neonatal intensive care.
We would like to thank Dr. J. Jansen for producing microscopic images of fat globules in breast milk samples, Shahana Hirji, and Nazina Awi for facilitating the Near-IR, lactose, and protein measurements, respectively.
Funding source
Christoph Fusch holds the Hamilton Health Sciences Foundation–Jack Sinclair Chair in Neonatology at McMaster University, Faculty of Health Sciences. The study was supported by Unity Scientific Inc.The sponsor was notinvolvedin the study design, inthe collection, analysis and interpretation of data; in the writing of the manuscript; and in the decision to submit the manuscript for publication.
Abbreviations
- UPLC-MS/MS
ultra performance liquid chromatography-tandem mass spectroscopy
- EA
Elemental analyzer
Footnotes
Previous presentations: Rochow N, Fusch G, Choi A, Fusch C. Human Lac-toengineering (II): Validation of Breast Milk Analyzers. Poster presentation at the Annual Meeting of the Pediatric Academic Societies, 2012, Boston, USA, Abstract: E-PAS2012:4512.147.
Statement of authorship
CF, GF, and NR designed the study; AC, AOU, GF, SF, SP, and SYL carried out the sample analyses; GF and CF analyzed data; GF, CF, AC, and PR wrote the paper; CF had primary responsibility for final content. All authors read and approved the final manuscript.
Conflict of interest
The authors have no potential conflicts of interest.
References
- 1.Lucas A, Cole TJ. Breast milk and neonatal necrotising enterocolitis. Lancet. 1990;336:1519–23. doi: 10.1016/0140-6736(90)93304-8. [DOI] [PubMed] [Google Scholar]
- 2.Maggio L, Costa S, Gallini F. Human milk fortifiers in very low birth weight infants. Early Hum Dev. 2009;85:S59–61. doi: 10.1016/j.earlhumdev.2009.08.018. [DOI] [PubMed] [Google Scholar]
- 3.Lemons JA, Moye L, Hall D, Simmons M. Differences in the composition of preterm and term human milk during early lactation. Pediatr Res. 1982;16:113–7. doi: 10.1203/00006450-198202000-00007. [DOI] [PubMed] [Google Scholar]
- 4.Polberger S. New approaches to optimizing early diets. Nestle Nutr Workshop Ser Pediatr Program. 2009;63:195–208. doi: 10.1159/000209982. [DOI] [PubMed] [Google Scholar]
- 5.Lonnerdal B. Personalizing nutrient intakes of formula-fed infants: breast milk as a model. Nestle Nutr Workshop Ser Pediatr Program. 2008;62:189–203. doi: 10.1159/000146272. [DOI] [PubMed] [Google Scholar]
- 6.Weber A, Loui A, Jochum F, Buhrer C, Obladen M. Breast milk from mothers of very low birthweight infants: variability in fat and protein content. Acta Paediatr. 2001;90:772–5. [PubMed] [Google Scholar]
- 7.Kent JC, Mitoulas LR, Cregan MD, Ramsay DT, Doherty DA, Hartmann PE. Volume and frequency of breastfeedings and fat content of breast milk throughout the day. Pediatrics. 2006;117:e387–95. doi: 10.1542/peds.2005-1417. [DOI] [PubMed] [Google Scholar]
- 8.Lonnerdal B. Effects of maternal dietary intake on human milk composition. J Nutr. 1986;116:499–513. doi: 10.1093/jn/116.4.499. [DOI] [PubMed] [Google Scholar]
- 9.Nasser R, Stephen AM, Goh YK, Clandinin MT. The effect of a controlled manipulation of maternal dietary fat intake on medium and long chain fatty acids in human breast milk in Saskatoon, Canada. Int Breastfeed J. 2010;5:3. doi: 10.1186/1746-4358-5-3. [DOI] [PMC free article] [PubMed] [Google Scholar]
- 10.Arslanoglu S, Moro GE, Ziegler EE. Adjustable fortification of human milk fed to preterm infants: does it make a difference? J Perinatol. 2006;26:614–21. doi: 10.1038/sj.jp.7211571. [DOI] [PubMed] [Google Scholar]
- 11.de Halleux V, Close A, Stalport S, Studzinski F, Habibi F, Rigo J. Advantages of individualized fortification of human milk for preterm infants. Arch Pediatr. 2007;14(Suppl 1):S5–10. doi: 10.1016/s0929-693x(07)80004-2. [DOI] [PubMed] [Google Scholar]
- 12.Menjo A, Mizuno K, Murase M, Nishida Y, Taki M, Itabashi K, et al. Bedside analysis of human milk for adjustable nutrition strategy. Acta Paediatr. 2009;98:380–4. doi: 10.1111/j.1651-2227.2008.01042.x. [DOI] [PubMed] [Google Scholar]
- 13.Casadio YS, Williams TM, Lai CT, Olsson SE, Hepworth AR, Hartmann PE. Evaluation of a mid-infrared analyzer for the determination of the macro-nutrient composition of human milk. J Hum Lact. 2010;26:376–83. doi: 10.1177/0890334410376948. [DOI] [PubMed] [Google Scholar]
- 14.Corvaglia L, Battistini B, Paoletti V, Aceti A, Capretti MG, Faldella G. Near-infrared reflectance analysis to evaluate the nitrogen and fat content of human milk in neonatal intensive care units. Arch Dis Child Fetal Neonatal Ed. 2008;93:F372–5. doi: 10.1136/adc.2007.133280. [DOI] [PubMed] [Google Scholar]
- 15.Sauer CW, Kim JH. Human milk macronutrient analysis using point-of-care near-infrared spectrophotometry. J Perinatol. 2011;31:339–43. doi: 10.1038/jp.2010.123. [DOI] [PubMed] [Google Scholar]
- 16.Silvestre D, Fraga M, Gormaz M, Torres E, Vento M. Comparison of mid-infrared transmission spectroscopy with biochemical methods for the determination of macronutrients in human milk. Matern Child Nutr. 2012 doi: 10.1111/j.1740-8709.2012.00431.x. http://dx.doi.org/10.1111/j.1740-8709.2012.00431.x [Published online July 9] [DOI] [PMC free article] [PubMed]
- 17.Rochow N, Fusch G, Choi A, Chessell L, Elliott L, McDonald K, et al. Target fortification of breast milk with fat, protein, and carbohydrates for preterm infants. J Pediatr. 2013;163:1001–7. doi: 10.1016/j.jpeds.2013.04.052. [DOI] [PubMed] [Google Scholar]
- 18.Choi A, Fusch G, Rochow N, Sheikh N, Fusch C. Establishment of micromethods for macronutrient contents analysis in breast milk. Matern Child Nutr. 2013 doi: 10.1111/mcn.12053. http://dx.doi.org/10.1111/mcn.12053 [Published online June 18] [DOI] [PMC free article] [PubMed]
- 19.Fusch G, Choi A, Rochow N, Fusch C. Quantification of lactose content in human and cow’s milk using UPLC-tandem mass spectrometry. J Chromatogr B Anal Technol Biomed Life Sci. 2011;879:3759–62. doi: 10.1016/j.jchromb.2011.09.053. [DOI] [PubMed] [Google Scholar]
- 20.Krouwer JS. Why Bland-Altman plots should use X, not (Y + X)/2 when X is a reference method. Stat Med. 2008;27:778–80. doi: 10.1002/sim.3086. [DOI] [PubMed] [Google Scholar]
- 21.Smilowitz JT, Gho DS, Mirmiran M, German JB, Underwood MA. Rapid measurement of human milk macronutrients in the neonatal intensive care unit: accuracy and precision of Fourier transform mid-infrared spectroscopy. J Human Lact – Off J Int Lact Consult Assoc. 2014 doi: 10.1177/0890334413517941. http://dx.doi.org/10.1177/0890334413517941. [DOI] [PubMed]
- 22.Barbano DM, Clark JL. Infrared milk analysis – challenges for the future. J Dairy Sci. 1989;72:1627–36. [Google Scholar]
- 23.Remillard N, Robin O, Martel R, Paquin P. Influence of homogenization efficiency on milk fat content determination by infrared analysis. Int Dairy J. 1993;3:197–208. [Google Scholar]
- 24.van de Voort FR, Elkashef AA, Mills BL. Dry calibration milks for infrared milk analyzers. J Assoc Off Anal Chem. 1990;73:688–92. [Google Scholar]
- 25.Grappin R, Jeunet R. Essais de l’appareil MilkoScan 300 utilisé pour le dosage en série de la matière grasse et des protéines du lait. Le Lait. 1976;558:498–519. [Google Scholar]
- 26.Embleton ND. Optimal protein and energy intakes in preterm infants. Early Hum Dev. 2007;83:831–7. doi: 10.1016/j.earlhumdev.2007.10.001. [DOI] [PubMed] [Google Scholar]
- 27.Ziegler EE, Thureen PJ, Carlson SJ. Aggressive nutrition of the very low birthweight infant. Clin Perinatol. 2002;29:225–44. doi: 10.1016/s0095-5108(02)00007-6. [DOI] [PubMed] [Google Scholar]
- 28.Kashyap S, Ohira-Kist K, Abildskov K, Towers HM, Sahni R, Ramakrishnan R, et al. Effects of quality of energy intake on growth and metabolic response of enterally fed low-birth-weight infants. Pediatr Res. 2001;50:390–7. doi: 10.1203/00006450-200109000-00015. [DOI] [PubMed] [Google Scholar]
- 29.Kashyap S, Towers HM, Sahni R, Ohira-Kist K, Abildskov K, Schulze KF. Effects of quality of energy on substrate oxidation in enterally fed, low-birth-weight infants. Am J Clin Nutr. 2001;74:374–80. doi: 10.1093/ajcn/74.3.374. [DOI] [PubMed] [Google Scholar]
- 30.Coppa GV, Gabrielli O, Pierani P, Catassi C, Carlucci A, Giorgi PL. Changes in carbohydrate composition in human milk over 4 months of lactation. Pediatrics. 1993;91:637–41. [PubMed] [Google Scholar]
- 31.Gabrielli O, Zampini L, Galeazzi T, Padella L, Santoro L, Peila C, et al. Preterm milk oligosaccharides during the first month of lactation. Pediatrics. 2011;128:e1520–31. doi: 10.1542/peds.2011-1206. [DOI] [PubMed] [Google Scholar]
- 32.Kunz C, Rudloff S. Biological functions of oligosaccharides in human milk. Acta Paediatr. 1993;82:903–12. doi: 10.1111/j.1651-2227.1993.tb12597.x. [DOI] [PubMed] [Google Scholar]
- 33.Lonnerdal B, Forsum E, Hambraeus L. A longitudinal study of the protein, nitrogen, and lactose contents of human milk from Swedish well-nourished mothers. Am J Clin Nutr. 1976;29:1127–33. doi: 10.1093/ajcn/29.10.1127. [DOI] [PubMed] [Google Scholar]
- 34.Wack RP, Lien EL, Taft D, Roscelli JD. Electrolyte composition of human breast milk beyond the early postpartum period. Nutrition. 1997;13:774–7. doi: 10.1016/s0899-9007(97)00187-1. [DOI] [PubMed] [Google Scholar]
- 35.Zachariassen G, Fenger-Gron J, Hviid MV, Halken S. The content of macro-nutrients in milk from mothers of very preterm infants is highly variable. Dan Med J. 2013;60:A4631. [PubMed] [Google Scholar]
- 36.Cooper AR, Barnett D, Gentles E, Cairns L, Simpson JH. Macronutrient content of donor human breast milk. Arch Dis Child Fetal Neonatal Ed. 2013 doi: 10.1136/archdischild-2013-304422. http://dx.doi.org/10.1136/archdischild-2013-304422 [Published online July 18] [DOI] [PubMed]
- 37.Lawrence RA. Storage of human milk and the influence of procedures on immunological components of human milk. Acta Paediatr. 1999;88:14–8. doi: 10.1111/j.1651-2227.1999.tb01295.x. [DOI] [PubMed] [Google Scholar]
- 38.Bitman J, Wood DL, Mehta NR, Hamosh P, Hamosh M. Lipolysis of triglycerides of human milk during storage at low temperatures: a note of caution. J Pediatr Gastroenterol Nutr. 1983;2:521–4. doi: 10.1097/00005176-198302030-00021. [DOI] [PubMed] [Google Scholar]
- 39.Berkow SE, Freed LM, Hamosh M, Bitman J, Wood DL, Happ B, et al. Lipases and lipids in human milk: effect of freeze-thawing and storage. Pediatr Res. 1984;18:1257–62. doi: 10.1203/00006450-198412000-00006. [DOI] [PubMed] [Google Scholar]
- 40.Friend BA, Shahani KM, Long CA, Vaughn LA. The effect of processing and storage on key enzymes, B vitamins, and lipids ofmaturehumanmilk.I. Evaluationoffresh samples and effects of freezing and frozen storage. Pediatr Res. 1983;17:61–4. doi: 10.1203/00006450-198301000-00012. [DOI] [PubMed] [Google Scholar]
- 41.Chang YC, Chen CH, Lin MC. The macronutrients in human milk change after storage in various containers. Pediatr Neonatol. 2012;53:205–9. doi: 10.1016/j.pedneo.2012.04.009. [DOI] [PubMed] [Google Scholar]
- 42.Lev HM, Ovental A, Mandel D, Mimouni FB, Marom R, Lubetzky R. Major losses of fat, carbohydrates and energy content of preterm human milk frozen at −80 degrees C. J Perinatol – Off J Calif Perinat Assoc. 2014 doi: 10.1038/jp.2014.8. http://dx.doi.org/10.1038/jp.2014.8. [DOI] [PubMed]
- 43.Vieira AA, Soares FV, Pimenta HP, Abranches AD, Moreira ME. Analysis of the influence of pasteurization, freezing/thawing, and offer processes on human milk’s macronutrient concentrations. Early Human Dev. 2011;87:577–80. doi: 10.1016/j.earlhumdev.2011.04.016. [DOI] [PubMed] [Google Scholar]
- 44.Garcia-Lara NR, Escuder-Vieco D, Garcia-Algar O, De la Cruz J, Lora D, Pallas-Alonso C. Effect of freezing time on macronutrients and energy content of breastmilk. Breastfeed Med – Off J Acad Breastfeed Med. 2012;7:295–301. doi: 10.1089/bfm.2011.0079. [DOI] [PMC free article] [PubMed] [Google Scholar]
- 45.Jensen RG, Jensen GL. Specialty lipids for infant nutrition. I. Milks and formulas. J Pediatr Gastroenterol Nutr. 1992;15:232–45. doi: 10.1097/00005176-199210000-00002. [DOI] [PubMed] [Google Scholar]
- 46.Narayanan I, Singh B, Harvey D. Fat loss during feeding of human milk. Arch Dis Child. 1984;59:475–7. doi: 10.1136/adc.59.5.475. [DOI] [PMC free article] [PubMed] [Google Scholar]
- 47.Martinez FE, Desai ID, Davidson AG, Nakai S, Radcliffe A. Ultrasonic homogenization of expressed human milk to prevent fat loss during tube feeding. J Pediatr Gastroenterol Nutr. 1987;6:593–7. doi: 10.1097/00005176-198707000-00018. [DOI] [PubMed] [Google Scholar]


