

Abstract
A primary purpose of the lymphatic system is to transport fluid from peripheral tissues to the central venous system in order to maintain tissue fluid balance. Failure to perform this task results in lymphedema marked by swelling of the affected limb as well as geometric remodeling and reduced contractility of the affected lymphatic vessels. The mechanical environment has been implicated in the regulation of lymphatic contractility, but it is unknown how changes in the mechanical environment are related to loss of contractile function and remodeling of the tissue. The purpose of this paper is to introduce a new theoretical framework for acute and long-term adaptations of lymphatic vessels to changes in mechanical loading. This theoretical framework combines a simplified version of a published lumped parameter model for lymphangion function and lymph transport, a published microstructurally-motivated constitutive model for the active and passive mechanical behavior of isolated rat thoracic ducts, and novel models for acute mechanically-mediated vasoreactive adaptations and long-term volumetric growth to simulate changes in muscle contractility and geometry of a single isolated rat thoracic duct in response to a sustained elevation in afterload. The illustrative examples highlight the potential role of the mechanical environment in the acute maintenance of contractility and long-term geometric remodeling, presumably aimed at meeting fluid flow demands while also maintaining mechanical homeostasis. Results demonstrate that contractility may adapt in response to shear stress to meet fluid flow demands and show that pressure-induced long-term geometric remodeling may attenuate these adaptations and reduce fluid flow. This modeling framework and illustrative simulations help suggest relevant experiments that are necessary to accurately quantify and predict the acute and long term adaptations of lymphangions to altered mechanical loading.
Keywords: Lymphatics, fluid transport, growth and remodeling, lymphedema, lumped parameter model, contractility
INTRODUCTION
The lymphatic system serves multiple functions including immune cell trafficking, lipid transport from the gut to the bloodstream, and tissue fluid balance, which depend explicitly on the ability of lymphatic vessels to spontaneously and rhythmically contract to transport fluid against a negative pressure gradient (Dixon 2010). Primary and secondary lymphedema affect 130 million people worldwide and are characterized by the inability of the lymphatic system to adequately transport lymph from the tissues to the venous system, resulting in tissue swelling of the affected limb. Loss of vessel function is believed to contribute to the progression of lymphedema due to the reduction or elimination of lymph transport manifested by either loss of contractility (active transport) or vessel obstruction or collapse (passive transport). Mechanical factors such as magnitude and direction of flow, inlet and outlet pressure, and pressure gradient are all known contributors to lymphatic function (Koller, Mizuno et al. 1999, Gashev, Davis et al. 2002, Gasheva, Zawieja et al. 2006, Davis, Scallan et al. 2012, Scallan, Wolpers et al. 2012, Kornuta, Nepiyushchikh et al. 2015). However, the relationship between these mechanical factors, long-term lymphatic function, and progression of lymphedema remain unknown.
Mechanically-mediated growth and remodeling is a well-documented phenomenon in biological tissue; however, growth and remodeling data relating to the lymphatic vasculature are strikingly absent. Correlation between geometric changes in collecting lymphatic vessels and progression of lymphedema have only recently been reported in cancer patients (Mihara, Hara et al. 2012), but the mechanisms driving this growth remain under-characterized. In the arterial wall, flow-induced wall shear stress and pressure-induced intramural hoop stress correlate well with growth and remodeling responses and are thought to be critical mediators of the process (Taber 1998, Gleason, Taber et al. 2004, Humphrey 2008, Valentín, Cardamone et al. 2009). Computational models have been published that predict flow patterns (and consequently wall shear stress) in lymphatic vessels (Reddy, Krouskop et al. 1977, Quick, Venugopal et al. 2007, Rahbar and Moore 2011, Bertram, Macaskill et al. 2014). We have recently published a constitutive model that captures the mechanical response of the vascular wall of rat thoracic ducts to circumferential and axial loading in the framework of finite elasticity using a model that accounts for the microstructure of the tissue (Caulk, Nepiyushchikh et al. 2015). In this paper, we describe a mathematical model for lymphatic function and adaptation that incorporates (i) the ‘immediate’ constitutive model for the lymphatic wall, (ii) a lumped parameter model for ‘immediate’ changes in the fluid flow using Poiseuille flow assumptions, (iii) a model for the mechanically-mediated ‘acute’ vasoactive response and (iv) a volumetric growth model for the ‘long-term’ mechanically-mediated geometric adaptations of a single lymphangion. These illustrations motivate the need for specific experimental data that are absent from the literature but required to accurately quantify the role of mechanical loading in acute and long-term adaptations of lymphatic vessels, which may play a role in the development and progression of lymphedema.
METHODS
The response of lymphatic vessels to changes in mechanical loading may be considered to occur over three distinct time-scales (Figure 1). The first is a nearly immediate mechanical response to an altered mechanical loading that occurs within seconds and is governed by principles of solid and fluid mechanics. The second is an acute vasoreactive response that is driven by an acute mechano-biological response to changes in the local mechanical environment; e.g., shear stress mediated changes in the release of vasoreactive molecules such as nitric oxide and endothelin-1 by lymphatic endothelial cells, which changes the contractile response of smooth muscle cells, which occurs over minutes to hours. The third is a tissue growth and remodeling response to changes in the local mechanical environment, which typically occurs over the course of days or longer. The theoretical framework for each time-scale is described below.
Figure 1.
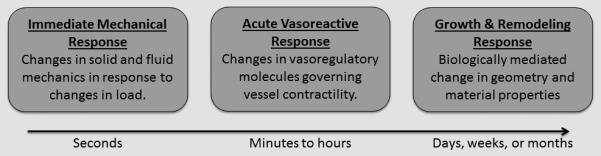
Visual representation of the time course of lymphatic adaptation events.
A. IMMEDIATE MECHANICAL RESPONSES
Solid mechanics model
Lymphatic vessels are loaded circumferentially due to a transmural pressure and external tissue pressure and are under axial extension in vivo. The radius-to-thickness ratio of lymphatic vessels is typically 7-8 (Caulk, Nepiyushchikh et al. 2015); thus, it is appropriate to use a two-dimensional (thin-wall) modeling framework, thereby neglecting transmural variations in wall stresses. In this framework, the average circumferential and axial stresses can be written as
| (1) |
where P is the transmural pressure, ri is the inner radius in the loaded configuration, h is the wall thickness in the loaded configuration, and f is the axial force. Note that the addition of in the numerator of Equation (1) accounts for the end cap pressure experienced in the vessel with ‘capped’ ends; i.e., as seen when valves are closed or in ex vivo biaxial testing. Note, too, that in this thin-wall framework Trr << Tππ and Trr << Tzz Trr ≅ 0.
We will model both the active (contractile) and passive mechanical behavior. We will let the total Cauchy stress be given as T = Tpas + Tact. The passive mechanical behavior will be modeled in the framework of finite elasticity. Assuming incompressibility, the Cauchy stress is,
| (2) |
where Fe is the elastic deformation gradient, W is the strain energy density function, Ce is the right Cauchy-Green strain tensor defined as Ce = FeT Fe, I is the identity tensor, and p is the Lagrange multiplier. For inflation and extension of a thin cylinder (assuming material symmetry), the deformation gradient is , where , and , where h and H are the loaded and unloaded thickness, dm and Dm are the loaded and unloaded midwall diameter, and ℓ and L are the loaded and unloaded length of the lymphangion, respectively. In this framework, the passive circumferential and axial components of the Cauchy stress are
| (3) |
where are the mean principal components of the right Cauchy-Green strain tensor (i = r, π, z).
We previously quantified the passive biaxial mechanical properties of rat thoracic ducts using the four-fiber family strain energy density function of Baek et al. (Baek, Gleason et al. 2007) which was adapted from the original function described by Holzapfel et al. (Holzapfel, Gasser et al. 2000); namely,
| (5) |
where are material parameters, is the first invariant of Ce, and, for inflation and axial extension (assuming material symmetry), .
The active contractile behavior was modeled following Rachev and Hayashi (Rachev and Hayashi 1999) as
| (6) |
where Tact is a parameter dependent on the activation of the smooth muscle, is the circumferential stretch of the vessel, λM is the stretch at which the contraction is maximum, and λ0 is the stretch at which force generation ceases. This model has been modified to include two active parameters, and , that regulate the magnitude of maximum spontaneous contraction and the basal tone, and consequently the end systolic and end diastolic diameter, respectively. In order to capture the cyclic contractile feature of the lymphangion, we prescribed a time-varying value of the parameter as an adaptation of the prescribed motion published by Bertram et al. (Bertram, Macaskill et al. 2013) such that,
| (7) |
where t is the current time, and tc is the duration of the active contraction, ts is the starting time of contraction, and an additional parameter tr is defined as the refractory period or time separating contractile phases. The model assumes that isobaric conditions drive contractility (i.e. muscle activation is not dependent on instantaneous changes in strain during pumping) and thus requires the concept of a “pumping pressure.” In this case, we are defining the pumping pressure as being equal to the inlet pressure because in ex vivo experiments, the outlet valve remains closed until the transmural pressure exceeds the afterload, and the inlet valve remains open until the transmural pressure drops below the inlet pressure, thus necessitating a homeostatic value equal to the inlet pressure. As we do not expect the basal tone to change during contraction, the inlet pressure defines a constant value of basal tone according the equation where the parameters a and c have previously been experimentally determined (Caulk, Nepiyushchikh et al. 2015), and ppump is the “pumping pressure” which is prescribed here as the preload.
Since frequency of lymphatic contraction has been shown to depend on transmural pressure (McHale and Roddie 1976, Davis, Scallan et al. 2012), frequency was prescribed based on the average basal transmural pressure and was defined based on equation (8),
| (8) |
where pa and pb are the inlet and outlet pressure of the vessel, respectively, and m and n are parameters governing the shape and intercept of the curve, respectively. These values were determined by digitizing data from Figure 2C in a study by Davis et al. (Davis, Scallan et al. 2012) and performing a regression of the data according to equation (8). The calculated values for m and n were 1.59 cmH2O−1/2 • min−1 and 4.28 min−1, respectively. Although we generally consider the immediate mechanical response to be governed by solid and fluid mechanics, this ‘immediate’ change in contractility has been observed and may be due in part to a rate sensitivity of the pacemaking activity in lymphatics to changes in circumferential stretch (Davis, Davis et al. 2009). Note that the total contractile frequency can be defined as the inverse of the sum of tc and tr, and thus alteration of the frequency requires manipulation of either the duration of contraction, the refractory time, or both. In this study, we have assumed that the duration of contraction is constant, and thus the refractory time is the value adjusted in order to calculate the correct frequency, which is in agreement with observations reported on collecting rat lymphatics in vivo (Zawieja, Davis et al. 1993, Dixon, Zawieja et al. 2005).
Figure 2.
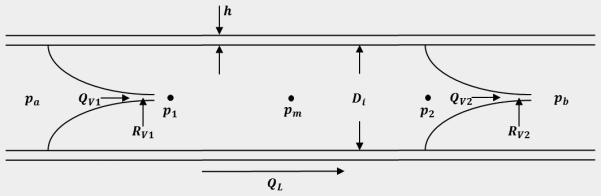
Model of the relationship between pressure, flow, and diameter in a single lymphangion pump. Pressure and diameter are calculated using a constitutive relationship together with previously obtained experimental data. Conservation of mass ensures that flow across the valves (determined by pressure drop) must equal the flow through the vessel (determined by change in diameter). All other parameters are prescribed.
Lymph propulsion through a lymphangion
Lymph flow is modeled using a lumped parameter model following an approach adapted and simplified from a previously published model (Bertram, Macaskill et al. 2013). The vessel can be considered a cylindrical, distensible tube with a valve at the inlet and outlet of the tube and fixed inlet and outlet pressures pa and pb, respectively (Figure 2). Pressure within the vessel is divided into three nodes: p1, pm, and p2 which are the transmural pressures immediately following the inlet valve, halfway down the length of the vessel, and immediately preceding the outlet valve, respectively. Lymph propulsion through the tube was modeled as steady, fully-developed, unidirectional, axisymmetric flow such that the pressure drop across the length of the tube can be defined by Equation (9),
| (9) |
where ΔP is the pressure drop across the length of the vessel, μ is the dynamic viscosity of the fluid, λz is the axial stretch of the vessel, L is the unloaded length of the vessel, QL is the flow through the vessel, and ri is the inner radius of the vessel. The assumption of Poiseuille flow from Equation (9) has been demonstrated to be a reasonable approximation of the flow profile in areas away from the valves (Dixon, Greiner et al. 2006, Rahbar and Moore 2011). If contraction of the vessel is assumed to be uniform throughout the vessel wall and the fluid is considered incompressible, bulk flow through the vessel can be defined as the change in volume per unit of time as seen in Equation (10),
| (10) |
The absolute value of the volume change simplifies the model to include only forward flow and thus assumes correct behavior of the valves. A condition was manually coded in which flow is negative if the vessel contracts without successfully opening the outlet valve.
We assume that the pressure drop across the vessel is linear such that the pressures p1 and p2 can be approximated by Equation (11).
| (11) |
In this model, the transmural pressure pm is calculated from the constitutive model previously described (Caulk, Nepiyushchikh et al. 2015) using the time-dependent Tact term in Equation (7) and the pressure/diameter relationship defined by Equation (1). Taken together, we can calculate the entire pressure profile of a single lymphangion. Using these pressures, the flow across the inlet and outlet valves can then be calculated using Equation (12),
| (12) |
where pin is the pressure on the proximal side of the valve, pout is the pressure on the distal side of the valve, and RV is the resistance of the valve defined as,
| (13) |
where RVn is the resistance when the valve is fully open, RVx is the resistance when the valve is fully closed, So is a parameter governing the rate at which a valve opens, ΔpV is the pressure drop across the valve (defined as pin – pout), and po is the pressure drop at which the valve opens and closes. Davis et al. demonstrated that this value is a function of transmural pressure and differs depending on whether the valve is opening or closing (Davis, Rahbar et al. 2011); however, here we set the opening and closing parameters as a fixed value equal for opening and closing and independent of pressure.
Conservation of mass dictates that
| (14) |
where dVL is the change in volume in the lumen of the vessel for a fixed time step dt, dVv,in is the volume of fluid taken in through the inlet valve for a fixed time step, and dVV,out is the volume of fluid expelled through the outlet valve for a fixed time step.
Characteristic flow parameters have been used to quantify changes in lymphatic function (Davis, Scallan et al. 2012). These metrics can be defined by the following equations:
| (15) |
| (16) |
| (17) |
where EF is the ejection fraction, EDD is the end diastolic diameter, ESD is the end systolic diameter, AMP is the contraction amplitude, SV is the stroke volume, EDV is the end diastolic volume, and ESV is the end systolic volume where the volume at any point in time is calculated as .
B. ACUTE VASOREACTIVE RESPONSE
Biological systems are known to adapt in order to maintain a homeostatic mechanical environment (e.g. shear stress); however, these systems must also work to maintain an output that meets the physiologic demand. Given the physiologic role of the lymphatic system in maintaining tissue fluid balance, we hypothesize that the vessels acutely adapt spatial and temporal contractile properties in response to perturbations in the mechanical environment to meet fluid flow demands. To simulate this scenario, a homeostatic value of fluid shear stress (and consequently, fluid flow and radius) must also exist for the system to have a target value to approach. Simulations are based on our previous experimental work in which vessels were excised from normal, healthy rats and tested immediately; we consider the target mechanical environment to be the “instantaneous” results for conditions of pa = 3 cmH2O and pB = 4 cmH2O using passive and active mechanical data for sample 1 from our previous study (Caulk, Nepiyushchikh et al. 2015).
The lumped parameter model simulates active pumping function of a lymphangion; specifically, pumping function is predicted for varying magnitudes of adverse pressure gradient. However, this framework alone does not capture the acute mechano-biological response of lymphatics that exist to restore function and a homeostatic environment (Dongaonkar, Nguyen et al. 2013, Scallan, Wolpers et al. 2013); e.g., a change in adverse pressure gradient leads to functional changes that perturb the local mechanical loads (e.g., shear stress). A change in shear stress will lead to altered release of vasoactive substances (e.g., nitric oxide, endothelin-1), which will further alter pumping function on the time-scale of seconds to minutes; we refer to such changes as an ‘acute’ response.
The proposed model contains multiple parameters that influence the flow parameters in equations (15) - (17). Specifically, temporal parameters such as frequency affect bulk flow for a given time interval, and spatial parameters such as and directly influence the stroke volume. We propose that frequency and systolic contraction are dependent on the time-averaged shear stress on the endothelium over a contraction cycle (i.e., contraction period plus refractory period) and are adjusted in order to maintain a homeostatic mechanical environment following acute perturbations of the system. Such an assumption is not unreasonable as it has been recently demonstrated in isolated vessels that shear stress alone can coordinate lymphatic contractile function by synchronizing the contraction with the fluid flow (Kornuta, Nepiyushchikh et al. 2015). These relationships can be defined by the following equations,
| (18) |
| (19) |
where ηf and ηTs are the time constants governing the rate of change for the contractile frequency and the parameter , respectively, fh and are the initial parameter values prior to mechanical perturbation (note that these are parameters and not explicitly calculated values of active stress), which we define as the ‘homeostatic’ values, dtg is the time step during adaptation, and τ and τh are the current and homeostatic shear stress on the endothelium, respectively. For Poiseuille flow through a tube, the shear stress is,
| (20) |
where μ is the dynamic viscosity, Q is the volumetric flow rate for a fixed change in time as calculated by equation (10), and ri is the inner radius. The physiological range of spatial parameters was restricted to 150% of the initial value, and temporal parameters were restricted to values below 150% of the initial value. Note that the adaptation equations governing behavior of the contractile parameters dictate that frequency and systolic contractility decrease when shear stress is increased beyond the homeostatic value, which agrees with the literature (Gashev, Davis et al. 2002). Previous studies have shown that shear stress also regulates basal tone (Gasheva, Zawieja et al. 2006); however, acute adaptations in basal tone are not considered here.
C. GROWTH & REMODELING RESPONSE
The constitutive model describing the solid mechanical behavior of the vessel wall can be extended to include volumetric growth following previously proposed models (Rodriguez, Hoger et al. 1994, Taber 1998), wherein the deformation gradient is defined as F = Fe · Fg where Fe is the kinematic deformation gradient tensor describing the deformation from the local stress-free reference configuration at the current time-point of interest to a loaded grown state (i.e. the current state), and Fg is the growth deformation gradient describing the deformation from the original local stress-free reference configuration to the current or grown local stress-free reference configuration. For a thick-walled axisymmetric cylinder, the deformation gradient is described by equation (21),
| (21) |
where is the ratio of the current loaded dimension to the current unloaded dimension (for r, τ, z)), and is the ratio of the current unloaded length to the original unloaded length, H0, D0, and L0 are the unloaded thickness, unloaded midwall diameter, and unloaded axial length at the initial, reference time-point prior to growth, respectively. H, D, and are the unloaded thickness, unloaded midwall diameter, and unloaded axial length at the current time-point of interest during growth, respectively.
To model the growth behavior of the tissue with this framework, a growth law must be prescribed for each growth stretch. However, data motivating lymphatic growth is largely absent in the literature. However, it is well documented in the blood vasculature that the transmural components of the Cauchy stress (e.g., Tππ and Tzz) and the wall shear stress (τw) mediate radial and circumferential growth (Wolinsky 1970, Liu and Fung 1989, Langille 1993, Matsumoto and Hayashi 1994, Humphrey 2008). We postulate here that circumferential Cauchy stress mediates both radial and circumferential growth. For the illustrative simulations presented herein, changes in the growth ratios are defined as,
| (22) |
where Tππh is the homeostatic time-averaged total circumferential stress, ηr and ηπ are the time constants governing the rate of growth in the radial and circumferential directions due to sustained changes in total circumferential stress, respectively, and dtg is the fixed change in time during growth. To our knowledge, no data exist regarding the axial growth of lymphatic vessels, thus, for these illustrative simulations, is prescribed as zero noting that future simulations may incorporate axial growth. As contractile behavior is highly dependent on axial stretch (Caulk, Nepiyushchikh et al. 2015), even small adaptations in axial length could have a significant effect on contractile behavior. Thus, there is a pressing need to quantify axial growth of lymphangions, in parallel to circumferential and radial growth.
To proceed, we must assign time constants and homeostatic stress values that govern the growth behavior. The lymphatic vasculature experiences variable circumferential and shear stress due to the spontaneous and rhythmic contraction of the muscle cells and changes in the transmural pressure (despite constant inlet and outlet pressures) due to flow and valve resistance. Given this and the lack of experimental data motivating the concept of lymphatic growth and remodeling, time-averaged stress values are considered here such that growth is calculated from equation (22) using the average circumferential stresses experienced over the course of a single contractile cycle (including systole and diastole) of a lymphangion, and the homeostatic values are assigned as the average stress values calculated prior to applying a step change to the system.
D. SOLVING ROUTINE
Three iterative loops were required to perform these analyses – one loop to calculate geometric and mechanical profiles over a single contractile cycle (corresponding to equations governing immediate mechanical responses), another loop which executes the first to calculate time averaged mechanical profiles (corresponding to equations governing acute responses), and a third loop which determines geometric changes and executes the acute loop to maintain homeostasis (see Figure 3 for flow chart). For the immediate mechanical response, an iterative loop was employed for each time step such that pressure, radius, and flow conditions were calculated at each point in time. During each iteration, the time-dependent active contraction was prescribed following Equation (7). A MATLAB subscript was written to calculate the pressure and flow conditions given a known radius and contractile state. In this script, a fully developed pressure profile was calculated based on the radius and contractility, and flow across the inlet and outlet valves was calculated based on the pressure drop across each valve. Flow through the vessel was then determined by the change in radius from the previous time step, and the error was defined as the difference between the change in volume in the vessel and the total volume accumulated (or lost) across the inlet (or outlet) valve according to Equation (14). The MATLAB subroutine lsqnonlin was then utilized with the Levenberg-Marquardt algorithm to determine a radius that minimizes the error defined by Equation (14) for a given value of contractility. Note that the first iteration was performed by prescribing a known transmural pressure equal to the preload such that minimization was not necessary. Given that multiple transmural pressure versus radius solutions may exist along a curve for a single value of Tact, a guessing method was employed in which the initial guess was determined using a 4th order Runge Kutta method and the following equation,
| (23) |
Parameter constraints were imposed such that an increasing value of Tact necessitates a constant or decreasing radius and constant or increasing transmural pressure.
Figure 3.

Process flow diagram depicting the solving routine for long-term mechanically-mediated growth and remodeling. The loop for calculating instantaneous processes is contained in red and the acute adaptation process is contained in red. Note that the instantaneous process is solved in the acute process, and the acute process is solved in the long-term process. Simulation initiation begins in the instantaneous loop and is denoted by “index = 1”.
For acute adaptation processes, another loop was employed that updated the parameters and f based on the local shear stress environment according to Equations (18) and (19). At each time step in this loop, the entire loop calculating the immediate mechanical response was executed following the update of the contractile parameters. For long-term growth processes, a third loop was employed that calculated the immediate mechanical response following a growth step that adapted the geometry based on the mechanical environment according to Equations (21) and (22). Because acute adaptations occur over significantly smaller time scales than growth processes, each time step in the growth loop was executed after at least 4 iterations of the acute adaptation loop to model a scenario in which acute contractility continually adapts as the geometry changes.
Material parameters
Active and passive mechanical properties of isolated rat thoracic ducts were quantified previously, and the estimated values are used here to govern the mechanical behavior during simulation. All simulations utilized parameters calculated for sample 1 in our previous study (Caulk, Nepiyushchikh et al. 2015). A list of constants associated with the constitutive and lumped parameter models can be seen in Table 1. Time constants associated with acute lymphatic contractile adaptation have not been previously reported; thus, these time constants were based on available literature data (Davis, Scallan et al. 2012). Time constants for long-term growth were taken from a previous study modeling aortic growth (Taber 1998) due to a lack of long-term lymphatic remodeling data. Note that pressure-induced thickening of the aorta has been documented to occur on much shorter time scales than shear-induced diameter changes (Fung and Liu 1989, Liu and Fung 1989). Growth constants associated with acute and long-term adaptation can be seen in Table 2.
Table 1.
Table of constants associated with the constitutive and lumped parameter models.
| Constant | Units | Value | Reference |
|---|---|---|---|
| R0 | cm | 252 | Caulk et al., 2015 |
| H0 | cm | 33.7 | Caulk et al., 2015 |
| b | dyne/cm2 | 0.00018 | Caulk et al., 2015 |
| dyne/cm2 | 2253 | Caulk et al., 2015 | |
| dyne/cm2 | 0.869 | Caulk et al., 2015 | |
| dyne/cm2 | 4629 | Caulk et al., 2015 | |
| dyne/cm2 | 2.214 | Caulk et al., 2015 | |
| dyne/cm2 | 427.7 | Caulk et al., 2015 | |
| dyne/cm2 | 4.094 | Caulk et al., 2015 | |
| α 1 | degrees | 90 | Caulk et al., 2015 |
| α 2 | degrees | 0 | Caulk et al., 2015 |
| α 3 | degrees | 27.7 | Caulk et al., 2015 |
| T act,max | dyne/cm2 | 118620 | Caulk et al., 2015 |
| a | unitless | 13.1 | Caulk et al., 2015 |
| c | dyne/cm2 | −4574 | Caulk et al., 2015 |
| λ M | unitless | 1.7636 | Caulk et al., 2015 |
| λ 0 | unitless | 0.6119 | Caulk et al., 2015 |
| λ z | unitless | 1.3 | Caulk et al., 2015 |
| RVx | dyne·s/(cm2·mL) | 12 (107) | Bertram et al., 2011 (adapted) |
| RVn | dyne·s/(cm2·mL) | 600 | Bertram et al., 2011 |
| so | cm2/dyne | 0.03 | Bertram et al., 2011 (adapted) |
| p0 | cmH2O | −0.25 | Bertram et al., 2011 (adapted) |
| μ | cP | 1 | Bertram et al., 2011 |
| L | cm | 0.335 | Caulk et al., 2015 |
| t c | s | 2 | Bertram et al., 2011 |
Table 2.
Table of growth constants corresponding to all time points during adaptation and remodeling.
| Constant | Units | Instantaneous | Acute | Long-term | Contractile Fatigue | Parameter Analysis | Reference |
|---|---|---|---|---|---|---|---|
| η r | days | ∞ | ∞ | 5 | 5 | 5,10,20,30 | Taber et al., 1998 |
| η θ | days | ∞ | ∞ | 60 | 60 | 60 | Taber et al., 1998 |
| η Ts,fail | days | ∞ | ∞ | ∞ | 20 | ∞ | New |
| η f,jail | days | ∞ | ∞ | ∞ | 20 | ∞ | New |
| η Ts | minutes | ∞ | 5 | 5 | 5 | 5 | New |
| η f | minutes | ∞ | 5 | 5 | 5 | 5 | New |
RESULTS
We let the initial loading be characterized by a preload pa = 3 cmH2O and an afterload pb = 4 cmH2O and consider a step change in afterload to 10 cmH2O. The following simulations report an immediate mechanical response of the vessel wall via equations (1) – (8) and the lymph flow via equations (9) – (14), an acute vasoreactive response that alters active contractile parameters ( and f) via equations (18) and (19), and a growth response via equations (21) and (22). These results are described in detail below.
A. IMMEDIATE MECHANICAL RESPONSE
Under the initial loading of pa = 3 cmH2O and pa = 4 cmH2O the time-course of Tact, radius, pressure, and flow (Figure 4) illustrate that positive forward flow occurs under two conditions: 1) pm > pb such that QL = QV2 and Qv1 = 0 (corresponding to systolic expulsion), and 2) p1 > pa such that QL = QV1 and QV2 = 0 (corresponding to diastolic filling). This simulation was re-run for pa = 3 cmH2O and pb = [4,10] cmH2O, at intervals of 0.5 cmH2O. Because of the tendency for valves to remain open even under a small adverse pressure gradient, there exists a small retrograde flow during the refractory period that is too small to see in Figure 4D. Functional flow parameters such as ejection fraction, contractile amplitude, and time-averaged outflow decreased as afterload increases (Figure 5). Note that average outflow (QV2) is reported because forward propulsion of lymph is considered here to be the most important metric in quantifying lymphatic function. These data are similar to published data (Davis, Scallan et al. 2012), noting that published results were collected from rat mesenteric lymphatics, with the inlet pressure equal to 1 cmH2O, whereas our simulations use a constitutive model fit to rat thoracic duct and we simulate an inlet pressure of 3 cmH2O. Despite these differences, the changes in functional flow parameters as a function of afterload reflect well the experimental results previously reported.
Figure 4.

Simulation results depicting time-varying geometric and mechanical waveforms for a single contractile cycle of an isolated rat thoracic duct. (A) The contractile parameter consists of a contractile and refractory period and drives geometric changes in the isolated vessel. (B) Diameter decreases during contraction to a minimum value (defined as end systolic diameter) and returns to the maximum value (end diastolic diameter). (C) Pressure increases during contraction to exceed the afterload and drive fluid expulsion and reduces below the preload during relaxation to facilitate filling. Blue ‘o’ denotes p1, black line denotes pm, and red ‘x’ denotes p2. (D) Flow experiences two distinct peaks during a contraction cycle, the first corresponding to systolic expulsion during which p2 > pb and QL = QV2, the second corresponding to diastolic filling during which p1 < pa and QL = QV1. Blue ‘o’ denotes QV1, black line denotes QL, and red ‘x’ denotes QV2.
Figure 5.

Functional flow metrics and mechanical conditions for a single pumping lymphangion as a function of increasing afterload. (A) Time-averaged shear stress increases as a function of afterload. (B) Time-averaged circumferential stress on the endothelium decreases as a function of afterload. (C) Ejection fraction decreases as afterload increases. (D) Contractile amplitude decreases as a function of afterload. (E) Contractile frequency increases as a function of afterload. (F) Average flow rate decreases as afterload increases.
Figure 6 shows the model-generated transmural pressure versus diameter relationship of a single isolated lymphangion (inlet pressure pa = 3 cmH2O), which contains curves representing the passive relationship (i.e. no contribution from smooth muscle cells, solid line), diastolic relationship (i.e. sustained tonic contraction, dashed line), and systolic relationship (i.e. spontaneous, rhythmic contraction, dotted line). The diastolic and systolic conditions are governed by the parameters and , respectively. During a single contraction, the parameter Tact is determined by equation (7) such that the value of the parameter ranges from to at any given time point. Figure 6 depicts the pressure vs. inner radius loop for afterloads of 4 (green) and 10 (blue) cmH2O as they relate to the diastolic and systolic pressure vs. diameter curves. An additional simulation was performed for an afterload of 11.9 cmH2O (magenta) to demonstrate the theoretical maximum afterload at which flow can no longer occur. This figure makes clear the relationship that the spatial contractile parameters have with the pressure vs. volume curve under instantaneous conditions. With an initial afterload of 4 cmH2O, the circumferential and shear stress under initial conditions were 40.5 kdyne/cm2 and 0.30 dyne/cm2, respectively; these are taken as the homeostatic values, Tππh and τh, respectively. Deviations from these homeostatic values govern the acute vasoactive and long-term growth responses via equation (18), (19), and (22). Note that the homeostatic value for = 120 kdyne/cm2 and fh = 7.3 min−1.
Figure 6.

Pressure versus diameter plot depicting lymphatic contractile cycles for a preload of 3 cmH2O and afterload values of 4 (green), 10 (blue), and 11.9 (magenta) cmH2O. Contractile amplitude is reduced as afterload increases and is eliminated for the theoretical maximum afterload of 11.9 cmH2O.
B. ACUTE VASOREACTIVE RESPONSE
Following a step change in afterload (e.g., from pb = 4 to pb = 10 cmH2O), the increased afterload led to reduced contractile amplitude, stroke volume, and ejection fraction, ultimately reducing the net flow rate and time-averaged shear stress. We submit that this ‘immediate’ biomechanical mechanical response will initiate an ‘acute’ vasoactive response captured in this model through changes in and f, via equation (18) and (19).
For a sustained elevation in afterload from 4 to 10 cmH2O, we let ηTs = ηf = 5 minutes to govern the rate of change of the parameters and f, respectively, in response to the immediate change in the mechanical environment. Contractile adaptations have been shown to occur in lymphatics on time scales ranging from minutes to days; thus, simulations may be performed to reflect contractile adaptations over a range of time periods. We have chosen to simulate the shortest end of the range by simulating adaptation over the course of minutes. This is in line with observations from the Davis lab (Davis, Scallan et al. 2012) The acute adaptive response is governed by wall shear stress, which ‘immediately’ reduces from 0.30 dynes/cm2 to 0.11 dynes/cm2 with this increase in afterload. Governed by equations (18) and (19), f and increase in response to decreased shear stress, altering the contractile function, which results in a restoration of the time-averaged shear stress and an increase in the ejection fraction (as indicated by a decreasing ESD) and a decrease in circumferential stress (Figure 7A-E). These adaptations result in a subsequent compensation of the average outflow rate (Figure 7F). Figure 8 illustrates the effect on the pressure vs. diameter curve as increases from homeostatic levels to a value necessary to maintain shear (blue dotted line to red dotted line, respectively). In this case, is increased by 37%. As contractility increases, the pressure-diameter loop expands to the left, indicative of an increasing stroke volume and subsequent increase of flow rate. Note that the right edge of the loop does not change because basal contractility (and consequently EDD) does not change in this simulation. Circumferential stress is not restored to the homeostatic value following an increase in contractility (Figure 7D). Thus, although the acute vasoreactive response is capable of restoring shear stress, since the applied loads have increased, the acute response cannot restore the intramural wall stress; indeed, growth is necessary to restore homeostasis to restore intramural wall stresses.
Figure 7.
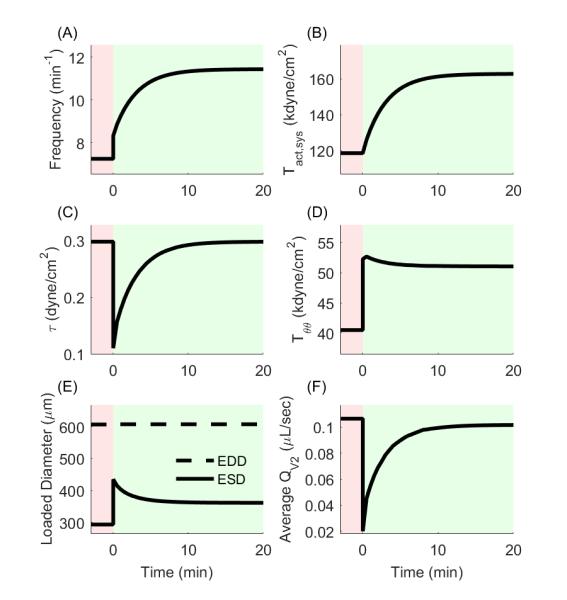
Change in contractile and mechanical parameters following acute contractile adaptation in response to a sustained increase in afterload. (A,B) Contractile frequency and systolic contractility increase following mechanical perturbation in order to restore shear stress. (C) Shear stress is restored to the homeostatic value following contractile adaptation. (D) Circumferential stress is reduced but not restored by contractile adaptation. (E) ESD is decreased due to the increase in systolic contractility, which in turn increases the ejection fraction. (F) Average outflow is nearly restored to the pre-perturbation rate following contractile adaptation.
Figure 8.

Visualization of the effect of increasing systolic contractility on vessel contractile amplitude and maximum afterload. The parameter increases 37% beyond the homeostatic value. The systolic pressure-diameter curve is represented by a blue dotted line before adaptation and a red dotted line after adaptation. Corresponding pressure vs. inner diameter loops are depicted for each condition. Note that an increase in contractility also results in an increase in the maximum afterload against which the vessel can expel fluid.
C. GROWTH & REMODELING RESPONSE
Simulation 1: Hoop stress-driven remodeling
Following a change in afterload pb from 4 to 10 cmH2O, the vessel also begins a remodeling cascade in addition to contractile adaptation in which unloaded thickness and midwall diameter increase in order to restore the mechanical environment to the appropriate target values (Figure 9, black lines). This occurs on a much larger time scale than contractile adaptation and thus includes continuous adaptation of the contractile mechanism during growth. After reaching homeostasis, unloaded thickness increases by 8.6%, and the unloaded midwall diameter increases slightly to 474 μm, a 0.7% increase compared to post-acute remodeling values (Figure 9E and 9F). The average outflow rate decreases to 7.44 × 10⁻² µL/sec, a 26.3% change compared to post-acute adaptation (Figure 9H) despite geometric remodeling of less than 10% in the radial and circumferential directions, but with the adaptation of the contractile apparatus (i.e. adaptation without fatigue, denoted by black line), the flow rate still remains higher than the flow rate following the instantaneous change at time 0.
Figure 9.

Volumetric growth and contractile adaptation following a sustained increase in afterload with (red) and without (black) contractile fatigue. (A,B) Frequency and systolic contractility increase in response to volumetric growth. For simulating contractile fatigue, both contractile parameters subsequently decrease to the values prior to mechanical perturbation. (C,D) Shear and circumferential stress are restored by long-term growth and contractile adaptation. Circumferential stress can remain at homeostatic levels following contractile fatigue, but shear stress cannot. (E,F) Unloaded thickness and midwall diameter increase in response to a sustained increase in afterload. Reference geometry further increases following contractile fatigue. (G) EDD decreases because radial growth leads to a decreased inner diameter, but changes in contractility do not directly affect EDD. Growth also leads to a decrease in ESD which assists in maintenance of ejection fraction, but contractile fatigue leads to an increase in ESD and decrease of ejection fraction. (H) Volumetric growth results in a decrease of average outflow rate, and contractile fatigue results in a further decrease in outflow rate.
Simulation 2: Hoop stress-driven remodeling with muscle fatigue
In Simulation 1, although the wall shear stress and intramural hoop stress were restored to homeostatic values, the contractile parameters f and remained elevated; however, we submit that enhanced contractility cannot remain sustained for long periods of time (e.g., for weeks) and that the adapted contractile parameters and f may also be targets to be restored to their original homeostatic values. We prescribe a point in time at which the contractile apparatus begins to fatigue, and the parameters and f gradually return to homeostasis at rates ηRsfail and ηf,fail, respectively, via some mechanism other than mechanically-mediated growth. To model this, we prescribe a time point at which these parameters begin to approach homeostatic values (i.e. values preceding an instantaneous change in afterload). We prescribed time constants of 5 days for this process. Results for this simulation are represented in Figure 9 as red lines. Volumetric growth is only slightly increased in the radial and circumferential direction (9.0% and 0.75% of pre-perturbation value compared to 8.7% and 0.72% in simulation 1). Interestingly, the fatigue of the contractile apparatus results in an average flow rate below that following an instantaneous change in afterload (Figure 9H) by approximately 61% (20 × 10−3 to 7.9 × 10⁻³ μL/sec) but is accompanied by only a minimal increase in growth. The differences in results from these simulations (e.g. growth patterns and prediction of flow capacity) illustrate the importance of determining the mechanism by which muscle fatigue and growth occur in the onset of lymphedema.
Illustrative parameter sensitivity analysis
To demonstrate the relationship between the growth constants on the evolution of average outflow, a brief parameter sensitivity analysis was performed in which the circumferential growth rate ηπ was held constant at 60 days, and the radial growth rate πr was varied at 5, 10, 20, and 30 days (Figure 10, black, red, green, and blue lines, respectively). Panel H illustrates that for a fixed rate of circumferential growth, the final average outflow (i.e. following achievement of mechanical homeostasis) decreases as the rate of radial growth increases. These results suggest that in the process of evolving towards intramural mechanical homeostasis, thickening of the vessel has a negative effect on average outflow by narrowing the lumen of the vessel but that circumferential growth can compensate provided the rate of thickening is sufficiently slow or the rate of circumferential growth is sufficiently fast.
Figure 10.

Sensitivity analysis of the radial growth time constant in relation to volumetric growth and flow parameters. Radial growth time constants are 5 (black), 10 (red), 20 (green), and 30 (blue) days. (A,B) For a fixed value of circumferential growth rate, frequency and contractility increase as radial growth rate decreases. (C,D) Shear stress is continually maintained regardless of the radial growth rate, and circumferential stress is always restored but reaches homeostasis slower as radial growth rate decreases. (E,F) Unloaded thickness and midwall diameter experience progressively larger increases as radial growth rate decreases. The larger increase in diameter occurs to compensate for the slower radial growth rate in the process of restoring circumferential stress to homeostasis. (G,H) Ejection fraction and average outflow rate are decreased as the radial growth rate increases.
DISCUSSION
Mechanically-mediated maladaptive growth and remodeling in the genesis and development of disease is well-studied, particularly in the arterial wall; however, little is known regarding the relationship between the mechanical environment of lymphatic vessels and the progression of lymphedema. Mathematical models can be used to integrate seemingly diverse sets of data, perform parametric studies and compare consequences of competing hypotheses through time- and cost-efficient simulations, and guide the identification, performance, and interpretation of revealing experiments. Consequently, the primary goals of this study were twofold: (i) to establish a theoretical framework of mechanically-mediated lymphatic behavior and adaptation over multiple time scales and (ii) to highlight key parameters whose role in progression of lymphedema may be investigated using relevant experimental frameworks. We have here developed a microstructurally-motivated lumped parameter model that predicts diameter, pressure, and flow profiles for a single lymphangion that follows patterns seen in the literature and utilized this model to predict acute adaptation of contractility and long-term growth and remodeling in response to a sustained elevation of afterload. These simulations illustrate the differential roles of acute and long-term adaptation in the restoration of flow capacity of a single lymphangion and suggest a role of prolonged increase in transmural pressure in the development of lymphedema.
Comparison of results with literature and implications for experimental frameworks
Results for the immediate functional response demonstrate the ability of our model to capture results available in the literature, specifically that from Davis et al (Davis, Scallan et al. 2012). These simulations were performed for a thoracic duct (as opposed to mesenteric lymphatics), and thus the geometric predictions were much larger than those observed in the aforementioned study. However, functional pumping metrics (e.g. ejection fraction) as well as general contractile behavior (e.g. changes in ESD) in response to an elevated afterload were similar to those observed by Davis et al., thus lending credibility to the predictive capability of our model. Additionally, the model is assumed to be equally valid for mesenteric lymphatics and thoracic ducts in rats because the Reynolds number is sufficiently low in both vessel types.
Simulation of acute adaptation suggests that adaptation of the contractile mechanism of lymphatic vessels can restore the time-averaged shear stress on the endothelium and increase flow capacity but that adaptation of the contractile mechanism is not sufficient for restoration of total mechanical homeostasis (i.e. including circumferential stress). Circumferential stress remained 20% higher than the homeostatic value despite the fact that shear stress was restored to the homeostatic value. Adaptation of contractility in lymphatics has been shown on time scales ranging from minutes to days (Li, Silver et al. 1998, Davis, Rahbar et al. 2011, Dongaonkar, Nguyen et al. 2013, Rahbar, Akl et al. 2014). Davis et al. demonstrate contractile adaptation in minutes by elevating the afterload of isolated rat mesenteric lymphatics beyond its critical threshold (i.e. transmural pressure cannot reach afterload and thus the outlet valve never opens). In this experiment, the contractile strength of the vessel increases to match the demand of the afterload such that the transmural pressure exceeds the afterload and thus opens the outlet valve (see Figure 8 (Davis, Scallan et al. 2012)). Rahbar et al. report changes in contractility in rat mesenteric lymphatics in vivo following saline infusion to induce edemagenic stress (Rahbar, Akl et al. 2014). In contrast to Davis et al., Rahbar et al. show changes in contractile frequency over the course of ~30 minutes but no significant changes systolic or diastolic diameter. Notably, the study also reports control values of average wall shear stress of 0.12 dynes/cm2, a value quite similar to what our model predicts as the homeostatic value of 0.30 dynes/cm2. Similarly, a recent report showed that contractility of lymphatics changes in response to a sustained increase in transmural pressure (Dongaonkar, Nguyen et al. 2013). The time course of this study was 3 days, and there was no report of unloaded geometric changes, restricting the applicability of the results to acute simulations. This study was also performed in bovine mesenteric vessels as opposed to rat thoracic ducts, so the comparisons should be drawn with caution.
These studies explicitly demonstrate the ability of the contractile mechanism to adapt acutely to changes in the mechanical environment both in vivo and ex vivo as well as over time courses ranging from minutes to days, but the mechanisms driving the adaptation are still largely unknown. Some studies have shown changes in lymphatic contractility in response to changes in flow (Koller, Mizuno et al. 1999, Gashev, Davis et al. 2002), thus, the proposed model generates a hypothesis that shear stress drives these processes, treating the mechanical environment as a first step in the initiation of an adaptive response that could be mediated by any number of biochemical responses including calcium store filling or nitric oxide production.
This model provides the opportunity to theoretically investigate specific mechanical parameters in order to motivate experimental frameworks that can target the parameters of highest interest. To test the hypothesis of shear driven adaptation, experimental frameworks may be employed in which isolated vessels are subjected to alterations in the mechanical environment for an extended period of time. Devices have been proposed that can precisely and independently control the axial pressure gradient and the transmural pressure of an isolated vessel and measure contractile amplitude and frequency over time (Kornuta and Brandon Dixon 2014) and others have developed approaches for culturing functional lymphatic vessels for days (Gashev, Davis et al. 2009). Application of such approaches to experimental frameworks on the order of days may be easily utilized to quantify adaptation of the contractile apparatus of lymphatic vessels in response to sustained changes in the mechanical environment.
Simulation of long-term growth suggests that thickening of the vessel wall and an increase in unloaded midwall diameter in response to an increase in circumferential stress can restore mechanical homeostasis but also decreases the flow capacity of the vessel. Various clinical reports have described changes in geometry, mechanics, and contractility of vessels over the course of lymphedema progression (Allegra, Sarcinella et al. 2002, Olszewski 2008, Mihara, Hara et al. 2012, Ogata, Fujiu et al. 2014). Mihara et al. have reported thickening of lymphatic vessels in patients with lymphedema, and although they report increased pressures associated with thickening, pressure values are not reported, and neither are geometric changes quantified (Mihara, Hara et al. 2012). Allegra et al. report increases in transmural pressure of lymphatics as lymphedema progresses, and they also report a transient increase in diameter, but thickness values are not reported (Allegra, Sarcinella et al. 2002). Similar results have been shown by others that demonstrate phenotypic changes of muscle cells as well as changes in cross-sectional area of lymphatics in progression of lymphedema (Ogata, Fujiu et al. 2014), but this study also lacks pressure measurements in order to correlate mechanical load with geometric evolution. Phenotypic changes of muscle cells may be associated with decreased contractility, a phenomenon that could potentially be compared to our simulation of a fatiguing contractile apparatus. These simulations do not address any changes in contractility associated with growth, but rather changes in contractility are exclusively dependent on the shear stress. However, proliferation and phenotypic changes of muscle cells would likely inhibit contractility and consequently the time-dependent flow profiles of the vessel. Such a relationship should be experimentally investigated and included in future simulations.
We simulated a scenario in which contractility returns to basal values (i.e. values prior to perturbation) via an unknown mechanism. Figure 9 illustrates the possible effect of a weakening contractile apparatus on average flow rate over time. This simulation includes long-term contractility restoration that is not growth dependent. Although contractile parameters return to basal values, the final average flow rate is lower than that following an instantaneous change in loading conditions, simulating a possible scenario in which the contractile apparatus can actually improve function for a period of time while volumetric growth ultimately reduces flow rate. These results suggest that sustained maintenance of growth-mediated mechanical homeostasis is only possible if contractility can remain increased indefinitely, which is unlikely to reflect reality. Such results may be expected based on data pieced together from experimental and clinical observations previously reported (Allegra, Sarcinella et al. 2002, Mihara, Hara et al. 2012, Dongaonkar, Nguyen et al. 2013) in which vessels adapt acutely (over a few days) to become stronger pumps but ultimately have reduced flow rates following long-term growth. Alternatively, we modeled a scenario in which contractility is restored via growth (data not shown). When contractile parameters are included in the evolution equations for the geometry of the vessel, volumetric growth must then become dependent not only on circumferential stress, but also shear stress (because contractility is shear-dependent). In this case, radius and thickness are reduced in order to restore shear stress. As vessel atrophy is not extensively reported in the literature, this framework was considered to deviate from realistic remodeling scenarios and thus these results are not reported here.
Literature clearly suggests that long-term growth is present in lymphedema (Mihara, Hara et al. 2012, Ogata, Fujiu et al. 2014) and also that contractility is reduced (Allegra, Sarcinella et al. 2002), but the relationship between the two remains uncharacterized. This theoretical framework highlights the important differences (e.g. growth patterns) between models of mechanically-mediated lymphatic function that simulate opposing mechanisms of mechanical restoration, thus emphasizing the importance of identifying appropriate mechanisms of remodeling.
Parameters governing growth and adaptation
Various parameters could potentially govern the process of contractile adaptation and volumetric growth, and only some have been included in these simulations. In the short-term, the proposed model includes only shear stress as a governing factor controlling contractility, and the only parameters included that govern contractility are and . We assumed a maximum systolic contractility and maximum contractile frequency as 150% of the values following an instantaneous increase in afterload, but it is unknown to what degree these parameters are able to adapt; thus, there is a need for data to validate this assumption. While systolic contractility and frequency are both important contributors to fluid flow and mechanical homeostasis, basal contractility also contributes significantly to fluid flow. Basal tone of lymphatics has been suggested to be shear dependent and self-regulatory (Gasheva, Zawieja et al. 2006), and whether or not shear-dependent frequency explicitly regulates basal tone (as opposed to shear regulating frequency and basal tone independently) remains to be conclusively proven. However, such a relationship could be included in future simulations to motivate experimental frameworks.
No data are available in the literature with regard to time constants for adaptation of contractility. Radial and circumferential time constants in simulations 1 and 2 were chosen based on the study from Taber et al. (Taber 1998); however, these time constants were prescribed for the case of aortic growth which may not be representative of the lymphatic vasculature. A brief parameter sensitivity analysis was performed for the radial growth time constant in order to illustrate the effect of the time constants on overall growth. The simulations suggests that a faster rate of radial growth decreases final flow capacity of the vessel by outpacing circumferential growth (i.e. thickening decreases the inner radius faster than circumferential growth can increase the inner radius). There are currently no available data that report a time constant for volumetric growth of lymphatics; thus, these results are merely an illustration of the capability of the model rather than a suggestion of reality. However, such a suggestion may motivate experimental frameworks to target specific growth parameters (e.g. measure time course of growth in culture or in vivo in response to mechanical perturbation) in order to investigate the role of growth in lymphedema progression.
We assumed a target value of circumferential and shear stress for all simulations in this study based on parameters calculated previously (Caulk, Nepiyushchikh et al. 2015). Homeostatic stress values in arteries have been proposed in previous studies (Gleason, Taber et al. 2004). These homeostatic values are on the order of 106 dyne/cm2 for circumferential and axial stress and 101 dyne/cm2 for shear stress; however, the stresses experienced by lymphatic vessels are notably lower than those in arteries and veins (Dixon, Greiner et al. 2006, Zhang, Gashev et al. 2007, Baeyens, Nicoli et al. 2015). Recent reports suggest that lymphatic endothelial cells align maximally in response to shear stress values between 4 and 6 dyne/cm2 (Baeyens, Nicoli et al. 2015) and that the shear threshold in rat thoracic ducts that produces a change in contractility depends on the transmural pressure and is in the range of 0.5 – 1 dyne/cm2 (Kornuta, Nepiyushchikh et al. 2015). Homeostatic circumferential stress in these simulations was 40.5 kdyne/cm2, and homeostatic shear stress was 0.30 dyne/cm2. It should be noted that homeostatic values were assumed to correlate with the function observed in our previous work, but given that the previous experimental framework included vessels without valves, the assumed homeostatic conditions may not be indicative of true in vivo conditions.
Lumped parameter model limitations
Simulations were performed to reflect a continuously adapting contractile apparatus as well as a volumetric growth process, both of which respond to the mechanical environment. Because of the disparate time scales (i.e. minutes for contractile adaptation and days or weeks for growth), the model is executed such that shear stress and contractile adaptation preferentially drive the remodeling process. Contractility is adapted to maintain shear stress on the order of minutes before the growth response can initiate, and thus growth responds to a mechanical environment that has previously been altered by contractile adaptation, rather than contractile adaptation and growth occurring simultaneously. While it is possible that adaptation and remodeling occur in this way, there is no experimental evidence to inform the process by which these phenomena are coupled. Additionally, this simplification provides ease in the simulation process as coupling events that occur on such disparate time scales is computationally expensive.
Valve behavior in lymphatics is known to be complex and has recently been quantified as a function of transmural pressure (Bertram, Macaskill et al. 2013). Transition properties of the valves are dependent on the pressure drop across the valves, and lymphatic valves have different properties depending on whether they are opening or closing. In most cases the valves are biased to remain in an open position (i.e. the valves remain open even when facing a small negative pressure drop) (Davis, Rahbar et al. 2011). Valve behavior here was simplified to support valve opening properties that were constant rather than pressure-dependent in order to simplify model behavior. Constants were chosen to support the concept that valves should remain biased to stay open. Valve behavior is an important determinant in flow profiles within the vessel; however, the goal of this milestone was to develop a framework in which specific parameters could be identified as contributors to lymphatic dysfunction, and thus valve behavior was simplified with the assumption that future studies might include a more detailed analysis of the relationship between complex valve behavior and mechanically-mediated growth and remodeling.
The model should ideally be expanded to support the prediction of flow through a chain of lymphangions as this is more physiologically relevant. Adding vessels onto a chain creates additional complication in prediction of behavior because timing and magnitude of contractions affect valve behavior. The current model treats valve locations as two-dimensional planes with built in variable resistance, an assumption that obscures the nuances of mechanical behavior in a single vessel, but mechanical behavior at valve insertion may induce more pronounced changes in the transport capability of a long chain of vessels.
Volumetric growth model limitations
The equations governing the acute and long-term responses are simplified to simulate adaptation in response to a single stimulus (e.g. change in contractility in response to shear stress and growth in response circumferential stress). However, geometry and contractility of lymphatic vessels likely also change in response to multiple mechanical cues. Similarly, restoration of stress was based on the total circumferential stress; however, total stress consists of both active and passive stress contributions. In the case of remodeling in these simulations, total stress is restored, but active stress is not; this response may not be representative. Again, these simulations are presented with the purpose of motivating experimental frameworks, and performing detailed analyses of complex responses may be premature given the lack of currently available data.
One limitation of the current long-term adaptation is that the volumetric growth model does not capture microstructural remodeling (i.e., change in material properties of the lymphatic wall). Many have proposed constrained mixture models that propose differential growth behavior of individual constituents in arteries (Humphrey and Rajagopal 2003, Gleason and Humphrey 2005, Valentín, Cardamone et al. 2009, Wan, Hansen et al. 2010). We recently reported asymmetric distribution of collagen fibers in rat thoracic ducts and noted that the organization varied significantly from sample to sample, even when specimens were taken from the same general location (Caulk, Nepiyushchikh et al. 2015). Although others have also reported collagen and elastin content and organization in lymphatics, rate of protein turnover has not been reported; thus, modeling protein-specific mechanically-mediated responses in the microstructure may be too advanced at this time.
Due to the spontaneous and rhythmic contraction of lymphatic vessels, the mechanical environment is more complex than that seen in arteries that exhibit only tonic contraction. Consequently, growth behavior was assumed to depend on time-averaged values of stress that occur over the course of a single contraction cycle of a vessel. This consequently makes growth and remodeling behavior dependent on the frequency of contraction. In this case, duration of contraction was assumed to be constant, whereas frequency (as determined by the addition of the duration of contraction and refractory period) was calculated prior to adaptive responses as a function of the spatially averaged transmural pressure (i.e. the average of the afterload and preload). The relationship between the frequency and transmural pressure was determined from values in the literature (Davis, Scallan et al. 2012); however, the data in the literature is noisy, and thus the model is very inaccurate.
Model limitations aside, this study provides a novel framework for the investigation of mechanically-mediated lymphatic growth and remodeling. The transport model (excepting growth) accurately recapitulates experimental data available in the literature investigating the effects of changes in the mechanical environment on lymphatic function. The successful development of the transport model provides a platform for the incorporation of mechanically-mediated growth and remodeling behavior in an actively pumping lymphangion. Our simulations suggest that a sustained elevation in afterload may induce geometric changes in an isolated lymphatic vessel that are associated with decreases in standard markers of lymphatic function (e.g. ejection fraction). This model offers a novel perspective on potential parameters driving the progression of lymphatic dysfunction and lymphedema and directly motivates future studies to investigate lymphatic growth and remodeling.
CONCLUSION
This study proposes a mathematical model of adaptation of lymphatic vessels over multiple time-scales in response to changes in the mechanical environment. Although many assumptions must be made regarding the model due to lack of available experimental data, the preliminary results suggest that changes in the mechanical environment such as flow and transmural pressure may correlate with adaptations that have been minimally documented in the literature. Perhaps more importantly, this model offers a platform for characterizing the progression of lymphedema, a common but poorly understood pathology, and has the capability of identifying specific parameters that should be targeted for experimental work. This model motivates the need to quantify key experimental end-points and modeling parameters that are currently absent in the literature. As additional data becomes available, quantification (and eventually accurate prediction) of the progression of lymphedema using this model may offer utility in the identification and evaluation of potential therapeutic techniques.
ACKNOWLEDGMENTS
We gratefully acknowledge that this study was supported by funds awarded from the National Institutes of Health (R01-HL113061).
REFERENCES
- Allegra C, Sarcinella R, Bartolo M., Jr. Morphologic and functional changes of the microlymphatic network in patients with advancing stages of primary lymphedema. Lymphology. 2002;35(3):114–120. [PubMed] [Google Scholar]
- Baek S, Gleason RL, Rajagopal KR, Humphrey JD. Theory of small on large: Potential utility in computations of fluid–solid interactions in arteries. Computer Methods in Applied Mechanics and Engineering. 2007;196(31–32):3070–3078. [Google Scholar]
- Baeyens N, Nicoli S, Coon BG, Ross TD, Van den Dries K, Han J, Lauridsen HM, Mejean CO, Eichmann A, Thomas JL, Humphrey JD, Schwartz MA. Vascular remodeling is governed by a VEGFR3-dependent fluid shear stress set point. Elife. 2015:4. doi: 10.7554/eLife.04645. [DOI] [PMC free article] [PubMed] [Google Scholar]
- Bertram CD, Macaskill C, Davis MJ, Moore JE., Jr. Development of a model of a multi-lymphangion lymphatic vessel incorporating realistic and measured parameter values. Biomech Model Mechanobiol. 2014;13(2):401–416. doi: 10.1007/s10237-013-0505-0. [DOI] [PMC free article] [PubMed] [Google Scholar]
- Bertram CD, Macaskill C, Moore JE., Jr. Incorporating measured valve properties into a numerical model of a lymphatic vessel. Comput Methods Biomech Biomed Engin. 2013 doi: 10.1080/10255842.2012.753066. [DOI] [PMC free article] [PubMed] [Google Scholar]
- Caulk AW, Nepiyushchikh ZV, Shaw R, Dixon JB, Gleason RL., Jr. Quantification of the passive and active biaxial mechanical behaviour and microstructural organization of rat thoracic ducts. J R Soc Interface. 2015;12(108) doi: 10.1098/rsif.2015.0280. [DOI] [PMC free article] [PubMed] [Google Scholar]
- Davis MJ, Davis AM, Lane MM, Ku CW, Gashev AA. Rate-sensitive contractile responses of lymphatic vessels to circumferential stretch. J Physiol. 2009;587:165–182. doi: 10.1113/jphysiol.2008.162438. Pt 1. [DOI] [PMC free article] [PubMed] [Google Scholar]
- Davis MJ, Rahbar E, Gashev AA, Zawieja DC, Moore JE., Jr. Determinants of valve gating in collecting lymphatic vessels from rat mesentery. Am J Physiol Heart Circ Physiol. 2011;301(1):H48–60. doi: 10.1152/ajpheart.00133.2011. [DOI] [PMC free article] [PubMed] [Google Scholar]
- Davis MJ, Scallan JP, Wolpers JH, Muthuchamy M, Gashev AA, Zawieja DC. Intrinsic increase in lymphangion muscle contractility in response to elevated afterload. Am J Physiol Heart Circ Physiol. 2012;303(7):H795–808. doi: 10.1152/ajpheart.01097.2011. [DOI] [PMC free article] [PubMed] [Google Scholar]
- Dixon JB. Lymphatic lipid transport: sewer or subway? Trends Endocrinol Metab. 2010;21(8):480–487. doi: 10.1016/j.tem.2010.04.003. [DOI] [PMC free article] [PubMed] [Google Scholar]
- Dixon JB, Greiner ST, Gashev AA, Cote GL, Moore JE, Zawieja DC. Lymph flow, shear stress, and lymphocyte velocity in rat mesenteric prenodal lymphatics. Microcirculation. 2006;13(7):597–610. doi: 10.1080/10739680600893909. [DOI] [PubMed] [Google Scholar]
- Dixon JB, Zawieja DC, Gashev AA, Cote GL. Measuring microlymphatic flow using fast video microscopy. J Biomed Opt. 2005;10(6):064016. doi: 10.1117/1.2135791. [DOI] [PubMed] [Google Scholar]
- Dongaonkar RM, Nguyen TL, Quick CM, Hardy J, Laine GA, Wilson E, Stewart RH. Adaptation of mesenteric lymphatic vessels to prolonged changes in transmural pressure. Am J Physiol Heart Circ Physiol. 2013;305(2):H203–210. doi: 10.1152/ajpheart.00677.2012. [DOI] [PMC free article] [PubMed] [Google Scholar]
- Fung YC, Liu SQ. Change of residual strains in arteries due to hypertrophy caused by aortic constriction. Circ Res. 1989;65(5):1340–1349. doi: 10.1161/01.res.65.5.1340. [DOI] [PubMed] [Google Scholar]
- Gashev AA, Davis MJ, Gasheva OY, Nepiushchikh ZV, Wang W, Dougherty P, Kelly KA, Cai S, Von Der Weid PY, Muthuchamy M, Meininger CJ, Zawieja DC. Methods for lymphatic vessel culture and gene transfection. Microcirculation. 2009;16(7):615–628. doi: 10.1080/10739680903120778. [DOI] [PMC free article] [PubMed] [Google Scholar]
- Gashev AA, Davis MJ, Zawieja DC. Inhibition of the active lymph pump by flow in rat mesenteric lymphatics and thoracic duct. J Physiol. 2002;540:1023–1037. doi: 10.1113/jphysiol.2001.016642. Pt 3. [DOI] [PMC free article] [PubMed] [Google Scholar]
- Gasheva OY, Zawieja DC, Gashev AA. Contraction-initiated NO-dependent lymphatic relaxation: a self-regulatory mechanism in rat thoracic duct. J Physiol. 2006;575:821–832. doi: 10.1113/jphysiol.2006.115212. Pt 3. [DOI] [PMC free article] [PubMed] [Google Scholar]
- Gleason RL, Humphrey JD. A 2D constrained mixture model for arterial adaptations to large changes in flow, pressure and axial stretch. Mathematical Medicine and Biology. 2005;22(4):347–369. doi: 10.1093/imammb/dqi014. [DOI] [PubMed] [Google Scholar]
- Gleason RL, Taber LA, Humphrey JD. A 2-D Model of Flow-Induced Alterations in the Geometry, Structure, and Properties of Carotid Arteries. Journal of Biomechanical Engineering. 2004;126(3):371–381. doi: 10.1115/1.1762899. [DOI] [PubMed] [Google Scholar]
- Holzapfel G, Gasser T, Ogden R. A New Constitutive Framework for Arterial Wall Mechanics and a Comparative Study of Material Models. Journal of elasticity and the physical science of solids. 2000;61(1-3):1–48. [Google Scholar]
- Humphrey JD. Mechanisms of arterial remodeling in hypertension: coupled roles of wall shear and intramural stress. Hypertension. 2008;52(2):195–200. doi: 10.1161/HYPERTENSIONAHA.107.103440. [DOI] [PMC free article] [PubMed] [Google Scholar]
- Humphrey JD, Rajagopal KR. A constrained mixture model for arterial adaptations to a sustained step change in blood flow. Biomech Model Mechanobiol. 2003;2(2):109–126. doi: 10.1007/s10237-003-0033-4. [DOI] [PubMed] [Google Scholar]
- Koller A, Mizuno R, Kaley G. Flow reduces the amplitude and increases the frequency of lymphatic vasomotion: role of endothelial prostanoids. Am J Physiol. 1999;277(6):R1683–1689. doi: 10.1152/ajpregu.1999.277.6.R1683. Pt 2. [DOI] [PubMed] [Google Scholar]
- Kornuta JA, Brandon Dixon J. Ex vivo lymphatic perfusion system for independently controlling pressure gradient and transmural pressure in isolated vessels. Ann Biomed Eng. 2014;42(8):1691–1704. doi: 10.1007/s10439-014-1024-6. [DOI] [PMC free article] [PubMed] [Google Scholar]
- Kornuta JA, Nepiyushchikh Z, Gasheva OY, Mukherjee A, Zawieja DC, Dixon JB. Effects of dynamic shear and transmural pressure on wall shear stress sensitivity in collecting lymphatic vessels. Am J Physiol Regul Integr Comp Physiol. 2015 doi: 10.1152/ajpregu.00342.2014. ajpregu 00342 02014. [DOI] [PMC free article] [PubMed] [Google Scholar]
- Langille BL. Remodeling of developing and mature arteries: endothelium, smooth muscle, and matrix. J Cardiovasc Pharmacol. 1993;21(Suppl 1):S11–17. doi: 10.1097/00005344-199321001-00003. [DOI] [PubMed] [Google Scholar]
- Li B, Silver I, Szalai JP, Johnston MG. Pressure-volume relationships in sheep mesenteric lymphatic vessels in situ: response to hypovolemia. Microvasc Res. 1998;56(2):127–138. doi: 10.1006/mvre.1998.2089. [DOI] [PubMed] [Google Scholar]
- Liu SQ, Fung YC. Relationship between hypertension, hypertrophy, and opening angle of zero-stress state of arteries following aortic constriction. J Biomech Eng. 1989;111(4):325–335. doi: 10.1115/1.3168386. [DOI] [PubMed] [Google Scholar]
- Matsumoto T, Hayashi K. Mechanical and dimensional adaptation of rat aorta to hypertension. J Biomech Eng. 1994;116(3):278–283. doi: 10.1115/1.2895731. [DOI] [PubMed] [Google Scholar]
- McHale NG, Roddie IC. The effect of transmural pressure on pumping activity in isolated bovine lymphatic vessels. J Physiol. 1976;261(2):255–269. doi: 10.1113/jphysiol.1976.sp011557. [DOI] [PMC free article] [PubMed] [Google Scholar]
- Mihara M, Hara H, Hayashi Y, Narushima M, Yamamoto T, Todokoro T, Iida T, Sawamoto N, Araki J, Kikuchi K, Murai N, Okitsu T, Kisu I, Koshima I. Pathological steps of cancer-related lymphedema: histological changes in the collecting lymphatic vessels after lymphadenectomy. PLoS One. 2012;7(7):e41126. doi: 10.1371/journal.pone.0041126. [DOI] [PMC free article] [PubMed] [Google Scholar]
- Ogata F, Fujiu K, Koshim I, Nagai R, Manabe I. Phenotypic modulation of smooth muscle cells in lymphedema. Br J Dermatol. 2014 doi: 10.1111/bjd.13482. [DOI] [PubMed] [Google Scholar]
- Olszewski WL. Contractility patterns of human leg lymphatics in various stages of obstructive lymphedema. Ann N Y Acad Sci. 2008;1131:110–118. doi: 10.1196/annals.1413.010. [DOI] [PubMed] [Google Scholar]
- Quick CM, Venugopal AM, Gashev AA, Zawieja DC, Stewart RH. Intrinsic pump-conduit behavior of lymphangions. Am J Physiol Regul Integr Comp Physiol. 2007;292(4):R1510–1518. doi: 10.1152/ajpregu.00258.2006. [DOI] [PubMed] [Google Scholar]
- Rachev A, Hayashi K. Theoretical study of the effects of vascular smooth muscle contraction on strain and stress distributions in arteries. Ann Biomed Eng. 1999;27(4):459–468. doi: 10.1114/1.191. [DOI] [PubMed] [Google Scholar]
- Rahbar E, Akl T, Cote GL, Moore JE, Jr., Zawieja DC. Lymph transport in rat mesenteric lymphatics experiencing edemagenic stress. Microcirculation. 2014;21(5):359–367. doi: 10.1111/micc.12112. [DOI] [PMC free article] [PubMed] [Google Scholar]
- Rahbar E, Moore JE., Jr. A model of a radially expanding and contracting lymphangion. J Biomech. 2011;44(6):1001–1007. doi: 10.1016/j.jbiomech.2011.02.018. [DOI] [PMC free article] [PubMed] [Google Scholar]
- Reddy NP, Krouskop TA, Newell PH., Jr. A computer model of the lymphatic system. Comput Biol Med. 1977;7(3):181–197. doi: 10.1016/0010-4825(77)90023-3. [DOI] [PubMed] [Google Scholar]
- Rodriguez EK, Hoger A, McCulloch AD. Stress-dependent finite growth in soft elastic tissues. J Biomech. 1994;27(4):455–467. doi: 10.1016/0021-9290(94)90021-3. [DOI] [PubMed] [Google Scholar]
- Scallan JP, Wolpers JH, Davis MJ. Constriction of isolated collecting lymphatic vessels in response to acute increases in downstream pressure. J Physiol. 2013;591:443–459. doi: 10.1113/jphysiol.2012.237909. Pt 2. [DOI] [PMC free article] [PubMed] [Google Scholar]
- Scallan JP, Wolpers JH, Muthuchamy M, Zawieja DC, Gashev AA, Davis MJ. Independent and interactive effects of preload and afterload on the pump function of the isolated lymphangion. Am J Physiol Heart Circ Physiol. 2012;303(7):H809–824. doi: 10.1152/ajpheart.01098.2011. [DOI] [PMC free article] [PubMed] [Google Scholar]
- Taber LA. A model for aortic growth based on fluid shear and fiber stresses. J Biomech Eng. 1998;120(3):348–354. doi: 10.1115/1.2798001. [DOI] [PubMed] [Google Scholar]
- Valentín A, Cardamone L, Baek S, Humphrey JD. Complementary vasoactivity and matrix remodelling in arterial adaptations to altered flow and pressure. Journal of The Royal Society Interface. 2009;6(32):293–306. doi: 10.1098/rsif.2008.0254. [DOI] [PMC free article] [PubMed] [Google Scholar]
- Wan W, Hansen L, Gleason R., Jr. A 3-D constrained mixture model for mechanically mediated vascular growth and remodeling. Biomechanics and Modeling in Mechanobiology. 2010;9(4):403–419. doi: 10.1007/s10237-009-0184-z. [DOI] [PMC free article] [PubMed] [Google Scholar]
- Wolinsky H. Response of the rat aortic media to hypertension. Morphological and chemical studies. Circ Res. 1970;26(4):507–522. doi: 10.1161/01.res.26.4.507. [DOI] [PubMed] [Google Scholar]
- Zawieja DC, Davis KL, Schuster R, Hinds WM, Granger HJ. Distribution, propagation, and coordination of contractile activity in lymphatics. Am J Physiol. 1993;264(4):H1283–1291. doi: 10.1152/ajpheart.1993.264.4.H1283. Pt 2. [DOI] [PubMed] [Google Scholar]
- Zhang RZ, Gashev AA, Zawieja DC, Davis MJ. Length-tension relationships of small arteries, veins, and lymphatics from the rat mesenteric microcirculation. Am J Physiol Heart Circ Physiol. 2007;292(4):H1943–1952. doi: 10.1152/ajpheart.01000.2005. [DOI] [PubMed] [Google Scholar]