

Abstract
Metabolism of nicotine by cytochrome CYP2A6 is a suspected determinant of smoking dose and, consequently, lung cancer risk. We conducted a genome-wide association study (GWAS) of CYP2A6 activity, as measured by the urinary ratio of trans-3′-hydroxycotinine and its glucuronide conjugate over cotinine (total 3HCOT/COT), among 2,239 smokers in the Multiethnic Cohort (MEC) study. We identified 248 CYP2A6 variants associated with CYP2A6 activity (p<5×10⁻⁸). CYP2A6 activity was correlated (r=0.32, p<0.0001) with total nicotine equivalents (a measure of nicotine uptake). When we examined the effect of these variants on lung cancer risk in the Transdisciplinary Research in Cancer of the Lung (TRICL) consortium GWAS dataset (13,479 cases, 43,218 controls), we found that the vast majority of these individual effects were directionally consistent and associated with an increased lung cancer risk. 226 of the 248 variants associated with CYP2A6 activity in the MEC were available in TRICL. Of them, 81% had directionally consistent risk estimates and six were globally significantly associated with lung cancer. When conditioning on nine known functional variants and two deletions, the top two SNPs (rs56113850 in MEC and rs35755165 in TRICL) remained significantly associated with CYP2A6 activity in MEC and lung cancer in TRICL.
The present data support the hypothesis that a greater CYP2A6 activity causes smokers to smoke more extensively and be exposed to higher levels of carcinogens, resulting in an increased risk for lung cancer. Although the variants identified in these studies may be used as risk prediction markers, the exact causal variants remain to be identified.
Introduction
Globally lung cancer is both the most common cancer and the leading cause of cancer-related deaths (1). Even though smoking is the primary cause of lung cancer, there is growing evidence for the involvement of genetics in the susceptibility to this disease. Genome-wide association studies (GWAS) have identified over ten genetic regions associated with lung cancer risk, which, combined, explain only a modest fraction of lung cancer heritability (8%) (2). Expanding GWAS datasets should continue to yield new lung cancer susceptibility loci. However, it is also estimated that genetic determinants of smoking behavior account for a greater percentage (24%) of lung cancer’s heritability (2). Indeed, there is growing evidence that tobacco carcinogen uptake by smokers and, consequently, lung cancer risk is strongly affected by two genetically-determined traits: nicotine dependence and self-dosing of nicotine.
GWAS have demonstrated that variation at chromosome 15q25.1, which includes the nicotinic receptor subunit genes CHRNA5-CHRNA3-CHRNB4, is the strongest susceptibility locus for nicotine dependence and lung cancer (3–5). These studies have particularly highlighted the role of SNP rs16969968, which results in a functional CHRNA5 variant (D398N). Smokers with this variant have been shown to not only smoke more cigarettes but also to uptake more nicotine and carcinogens per cigarette (6).
Fewer large studies have focused on the metabolism of nicotine, as a determinant of smoking dose and lung cancer risk. Cytochrome P450 2A6 (CYP2A6) metabolizes up to 70% of nicotine into cotinine via C-oxidation (7). Cotinine is further metabolized to trans-3′-hydroxycotinine (3HCOT) primarily by the same enzyme. 3HCOT is further metabolized by glucuronidation, and quantifying the sum of 3HCOT and its glucuronide conjugate, referred to as "total 3HCOT", captures the total conversion of cotinine to 3HCOT. The ratio of total 3HCOT to COT has traditionally been used to assess CYP2A6 activity (8). Differences in the rate of nicotine metabolism have been shown to contribute to inter-individual variation in smoking behavior (9,10) and, consequently, lung cancer risk (11–13). In order to achieve the desired psycho-pharmacological effects of nicotine, smokers have been shown to adjust their cigarette consumption to maintain stable levels of nicotine in the circulation (14). A slower nicotine metabolism rate causes the individual to smoke less extensively (i.e., smoke fewer cigarettes per day and/or extract lower nicotine dose per cigarette) to reach the same plasma nicotine level as an individual who metabolizes nicotine more rapidly (Figure 1) (15). Smoking less extensively results in a lower exposure to tobacco smoke-derived carcinogens and, hence, likely to a lower risk of developing lung cancer. While genetic variation in CYP2A6 has been shown to influence smoking behavior (2), to date, whole-genome association studies (GWAS) have not identified CYP2A6 as a risk variant for lung cancer.
Figure -1.
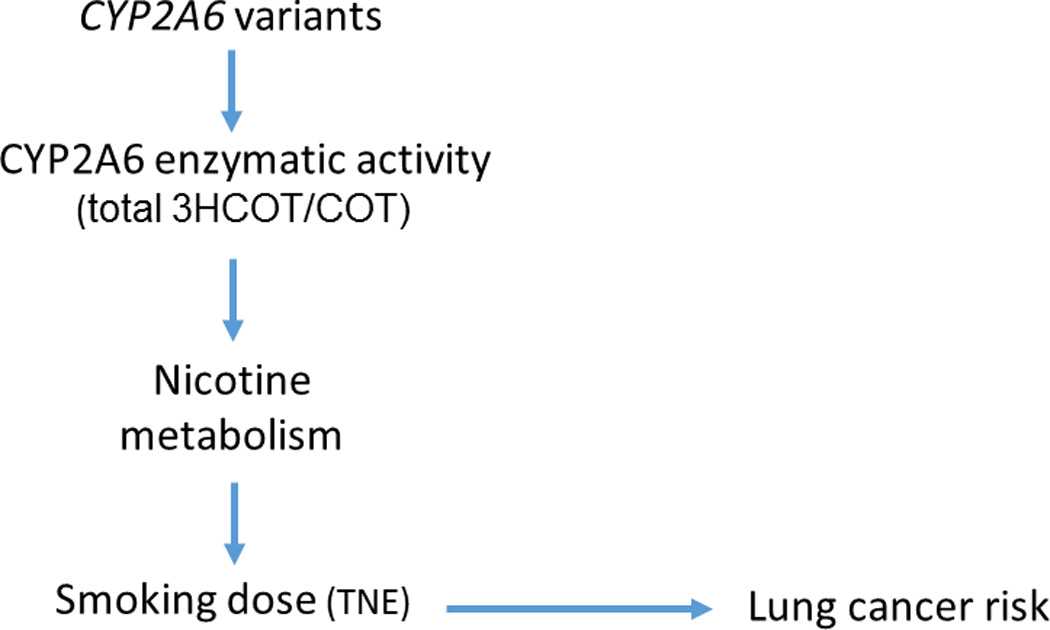
Causal model in smokers. In order to achieve the desired psycho-pharmacological effects of nicotine, smokers adjust their cigarette consumption to maintain stable levels of nicotine in the circulation. A high nicotine metabolism rate, as measured by the urinary ratio of trans-3′-hydroxycotinine and its glucuronide conjugate over cotinine (total 3HCOT/COT), causes the individual to smoke more extensively (i.e., smoke more cigarettes per day and/or extract a greater nicotine dose per cigarette) to reach the same plasma nicotine level as an individual who metabolizes nicotine less rapidly. Smoking more extensively results in a greater exposure to tobacco smoke carcinogens and, hence, likely to a higher risk of developing lung cancer. TNE: total nicotine equivalents
We report here on a large genome-wide investigation of the genetic variants affecting CYP2A6 activity among smokers in the Multiethnic Cohort (MEC) Study (16) and on their associations with lung cancer risk in the largest GWAS dataset available to date for this disease, the Transdisciplinary Research In Cancer of the Lung (TRICL) consortium (17). These two agnostic association studies, one of a biomarker trait that affects the primary exposure and the other of the disease itself, allowed us to empirically consider biological plausibility and internal validity, in addition to the usual GWAS criteria for independence of effects and genome-wide statistical significance, in interpreting each variant’s association with lung cancer.
Methods for the MEC Smokers GWAS
Study population
The Multiethnic Cohort (MEC) is a prospective cohort study that investigates lifestyle and genetic risk factors for cancer and other chronic diseases (16). The MEC is comprised of 215,251 men and women aged 45–75 at baseline and includes five ethnic/racial groups: African Americans and Latinos mostly from Los Angeles, and Japanese Americans, Native Hawaiians and Whites, mostly from Hawaii. Potential participants were identified from drivers’ license files, voter registration lists, and Health Care Financing Administration files. Each participant entered the study between 1993 and 1996 by returning a self-administered questionnaire detailing demographics, diet, smoking, medical history, and other lifestyle factors.
Approximately 10 years after cohort entry, MEC participants were requested to provide a blood sample and an overnight urine collection in Hawaii or first morning urine sample in California. At that time, they also completed a questionnaire recording the number of cigarettes smoked per day during the past two weeks, and a record of current medications. The overnight urine collection in Hawaii started between 5 and 9 pm and included all urine passed during the night, as well as the first morning urine. Urine collections at both study sites were kept on ice until processing. Aliquots were subsequently stored in a −80 °C freezer until analysis. The Institutional Review Boards at the University of Hawaii, the University of Southern California and the University of Minnesota approved the present study. All MEC participants in the MEC Biospecimen Subcohort who were current smokers at the time of urine collection and cancer-free at selection (N=2,393) were included in this study.
Phenotypes
Nicotine, COT and 3HCOT in urine were analyzed by liquid chromatography tandem mass spectrometry (LC/MS/MS) in a 96-well plate format using methods previously described (18). For the analysis of total 3HCOT, the samples were treated with β-glucuronidase prior to analysis. The coefficients of variation among 10 blinded replicates of 22 samples were (16.7% for nicotine, 10.1% for cotinine and 11.4% for 3HCOT). The main phenotype of interest, CYP2A6 activity, was assessed from the ratio of total 3HCOT to COT. To account for dose, total nicotine equivalents (TNE), which is the sum of nicotine and its metabolites (total nicotine, total cotinine and total 3′-hydroxycotinine), and nicotine N-oxide, including their glucuronides, were used for adjustment in analyses as described earlier (18). Individuals with a total nicotine equivalents less than 1.4 nmol/ml (n=80) were excluded from this analysis.
Genotyping and Quality Control
Blood leukocyte DNA samples were genotyped using the Illumina Human1M-Duo BeadChip (1,199,187 SNPs). Quality control procedures were applied to the genotyping data as previously described (19). Imputation of untyped variants included in the 1000 Genomes Project (http://www.1000genomes.org/) was performed using SHAPEIT (20) and IMPUTE2 (21) using a cosmopolitan reference panel (all groups included). Post imputation, we included SNPs with an IMPUTE2 info score of ≥0.30 and minor allele frequency (MAF) >1% in any MEC ethnic group in our association testing. A total of 2,239 study participants with complete genotype and phenotype data, and 11,892,802 SNPs/indels (1,131,426 genotyped and 10,761,376 imputed) were included in the GWAS analysis of CYP2A6 activity (ratio of total 3HCOT to COT).
Statistical Analysis
Least-square means (or geometric means) were estimated and compared between populations for the smoking variables. Principal components were estimated using 19,059 randomly selected autosomal SNPs with frequency ≥ 2% in the combined multiethnic sample. The 10 leading eigenvectors from this matrix were included in the analysis to adjust for population stratification (22). The per allele association of each SNP/indel with geometric mean CYP2A6 activity levels was evaluated using linear regression models, with adjustment for age at the time of urine collection, sex, self-reported ethnicity, total nicotine equivalents, BMI, and the first 10 principal components described above. A p-value cut-off of 5 × 10⁻⁸ was used to establish genome-wide significance (23). Ethnic-specific analyses were also performed to search for loci that may be important in individual populations. To determine the relative importance of multiple SNPs in a region or genome-wide, we used multiple regression methods. All SNPs showing globally significant associations were allowed to compete in forward selection regression models and all variables that entered with a significance level of P < 0.001 were retained (19). This allowed us to estimate the number of independent signals that may be involved in each region associated with each phenotype of interest. R2 value was used to assess the percentage of variation of CYP2A6 activity accounted for by the variants examined.
Methods for the TRICL Lung Cancer GWAS Consortium
Study Population
The association study with lung cancer risk was conducted using the GWAS data assembled by the TRICL consortium. The overall study design and methods for TRICL have been described in detail elsewhere for most studies (17). The meta-analysis was based on summary data from 19 GWAS undertaken by eight analytic centers providing genotype data on 13,479 patients with lung cancer and 43,218 controls of European descent: the MD Anderson Cancer Center lung cancer study (24); the NCI lung cancer GWAS including the Environment and Genetics in Lung Cancer Etiology (EAGLE) study (25) and the Prostate, Lung, Colon, Ovary Screening Trial (PLCO) (26); the IARC lung cancer GWAS (5) including Central Europe GWAS (27); the Carotene and Retinol Efficacy Trial (CARET) cohort lung cancer GWAS (28); the HUNT2/Tromso 4 study (29); several lung cancer GWAS studies from Central Europe and France (30); the lung cancer study from Estonia (31); the German Lung Cancer Study (GLC) (32); the Greater Toronto Area lung cancer study (5) (331 cases and 499 controls); and the Icelandic Lung Cancer Study (deCODE) (1,319 cases and 26,380 controls) (33). Each TRICL study requested from each smoker (defined as individuals who smoked at least 100 cigarettes in their life) the number of cigarettes smoked per day and the number of years smoked. Pack years was then calculated as cigarettes per day/20 times number of years smoked. Lung cancer diagnosis was based on histopathology or cytology. A written informed consent was obtained from each participant, and this study was approved by the institutional review boards of the University of Hawaii and University of Southern California. The lung cancer GWAS were approved by each of the participating institutions.
Genotyping and Quality Control
Standard quality control on samples was performed on all scans, excluding individuals with low call rate (< 90%) and extremely high or low heterozygosity (P < 1.0 × 10⁻⁴), as well as all individuals evaluated to be of non-European ancestry (using the HapMap phase II CEU, JPT/CHB and YRI populations as a reference). In each study, genotyping was performed using the Illumina HumanHap 300 BeadChips, HumanHap550 or 610 Quad arrays. Untyped SNPs were imputed using the IMPUTE2 (21), MACH1 (34) or minimac (35) software and HapMap Phase II, Phase III and/or 1000 Genome Project data release 2010-08 or 2010-06 reference genotypes. Imputation uncertainty was accounted for by using posterior means or allele dosage in logistic regression (17). The meta-analysis of imputed genotypes included all studies. Poorly imputed SNPs defined by an RSQR< 0.30 with MACH1/minimac or an information measure Is < 0.40 with IMPUTE2 were excluded from the analyses. A subset of 12,000 ancestry markers was used to calculate principal components to estimate genetic ancestry using EIGENSTRAT (36). These principal components of genetic ancestry were included in regression models to adjust for potential population stratification.
Statistical Methods
To estimate the association between each SNP and risk of lung cancer, genotyped or imputed allele dosage for each SNP was tested for association in unconditional logistic regressions assuming an additive genetic model for the effect of risk allele. Each study center provided summary statistics from the initial model which were adjusted for age, sex, country/study center, and principal components of genetic ancestry. A secondary model using only ever smokers was fit and further adjusted for pack-years. A meta-analysis under fixed and random-effects models was conducted. The regression estimates were combined across studies using inverse-variance weighted, fixed-effect meta-analysis using METAL, a tool for meta-analysis of genome wide association scans (37). The Cochran’s Q statistic was used to test for heterogeneity and to quantify the proportion of the total variation due to heterogeneity. Quantile–quantile (Q–Q) plots of association test statistics showed minimal over –dispersion consistent with limited cryptic population stratification between cases and controls. Conditional analysis for lung cancer risk in the TRICL data were performed using GCTA based on summary statistics (38).
Results
Selected characteristics of the 2,239 MEC smokers (437 Whites, 364 African Americans, 453 Latinos, 674 Japanese Americans and 311 Native Hawaiians) included in the GWAS analysis of CYP2A6 activity are presented in Table 1. As reported previously, significant differences were observed among ethnic groups in cigarettes per day and total nicotine equivalents, with whites reporting smoking the highest and Latinos the lowest number of cigarettes per day during the previous two weeks (18,19). In contrast, mean TNE (a marker of total nicotine uptake) was highest in African Americans and lowest among Japanese Americans. Significant differences in mean adjusted CYP2A6 activity levels were noted across populations, with Japanese Americans having significantly lower levels compared to any other ethnic group. Overall, the correlation between CYP2A6 activity and TNE adjusted for age, sex, race and BMI was 0.31 (p<0.0001), and this correlation was not affected when further adjusted for cigarettes per day (CPD, r= 0.32; p<0.0001).
Table 1.
Descriptive characteristics of the MEC Smokers (N=2,239).
| African Americans | Native Hawaiians | Whites | Latinos | Japanese Americans | |||||||
|---|---|---|---|---|---|---|---|---|---|---|---|
| n | Mean [SE] | n | Mean [SE] | n | Mean [SE] | n | Mean [SE] | n | Mean [SE] | ||
| Age (yrs) | All | 364 | 64.86 [0.38] * | 311 | 61.36 [0.41] *** | 437 | 63.69 [0.35] | 453 | 65.53 [0.34] *** | 674 | 63.60 [0.29] |
| Male | 111 | 63.49 [0.65] | 114 | 63.08 [0.64] | 190 | 63.36 [0.50] | 237 | 66.43 [0.45] | 388 | 63.62 [0.36] | |
| Female | 253 | 65.39 [0.47] | 197 | 60.28 [0.54] | 247 | 63.92 [0.48] | 216 | 64.58 [0.51] | 286 | 63.69 [0.47] | |
| CPDa | All | 364 | 11.72 [0.48] *** | 311 | 15.52 [0.52] *** | 437 | 18.02 [0.43] | 453 | 9.31 [0.43] *** | 674 | 13.76 [0.37] *** |
| Male | 111 | 11.98 [0.91] *** | 114 | 17.00 [0.91] ** | 190 | 21.00 [0.70] | 237 | 10.87 [0.64] *** | 388 | 15.58 [0.51] *** | |
| Female | 253 | 10.79 [0.53] *** | 197 | 14.27 [0.61] | 247 | 15.47 [0.53] | 216 | 8.14 [0.57] *** | 286 | 12.05 [0.53] *** | |
| TNEb | All | 364 | 44.35 [1.99] *** | 311 | 29.43 [1.42] | 437 | 33.05 [1.33] | 453 | 29.60 [1.18] | 674 | 23.72 [0.79] *** |
| Male | 111 | 48.10 [3.94] | 114 | 31.70 [2.58] * | 190 | 40.44 [2.53] | 237 | 31.76 [1.80] ** | 388 | 26.65 [1.18] *** | |
| Female | 253 | 40.40 [2.12] *** | 197 | 27.54 [1.63] | 247 | 28.01 [1.46] | 216 | 28.24 [1.58] | 286 | 21.36 [1.06] *** | |
| BMIc | All | 364 | 27.45 [0.26]*** | 311 | 26.83 [0.28]*** | 437 | 25.03 [0.22] | 453 | 26.87 [0.23]*** | 674 | 24.19 [0.17]** |
| Male | 111 | 26.17 [0.39] | 114 | 26.98 [0.40]** | 190 | 25.53 [0.29] | 237 | 26.41 [0.27]* | 388 | 24.87 [0.20] | |
| Female | 253 | 28.00 [0.35]*** | 197 | 26.65 [0.38]*** | 247 | 24.65 [0.31] | 216 | 27.37 [0.37]*** | 286 | 23.37 [0.27]** | |
| CYP2A6 Activityd | All | 354 | 3.95 [0.16] | 296 | 2.78 [0.12]*** | 418 | 3.94 [0.14] | 431 | 4.66 [0.16]** | 601 | 1.76 [0.05] *** |
| Male | 109 | 3.64 [0.26] | 110 | 2.88 [0.20]* | 182 | 3.56 [0.19] | 225 | 4.38 [0.21] ** | 355 | 1.72 [0.07] *** | |
| Female | 245 | 4.18 [0.20] | 186 | 2.74 [0.15] *** | 236 | 4.27 [0.20] | 206 | 4.93 [0.25] * | 246 | 1.77 [0.08] *** | |
CPD = cigarettes/day. P-values and least square means for CPD were adjusted for BMI, age (and gender where appropriate).
TNE (Total Nicotine Equivalents) is the sum of total nicotine, total cotinine, total 3-hydroxycotinine, and nicotine N-oxide expressed as nmol/mL. TNE was log transformed to maintain normality, and the means were back transformed to their original scale. P-values and geometric least square means for TNE have been adjusted for BMI, age (and gender where appropriate).
BMI expressed as kg/m2. BMI was log transformed to maintain normality, and the means were back transformed to their original scale. P-values and geometric least square means of BMI were adjusted for age (and gender where appropriate).
CYP2A6 activity is the ratio of [total 3-hydroxy cotinine / free cotinine], expressed as percent nmol/mg. CYP2A6 was log transformed to maintain normality, and the means were back transformed to their original scale. P-values and geometric least square means of CYP2A6 activity were adjusted for BMI, age, TNE (and gender where appropriate).
P-values across ethnic groups (with Whites as the reference) were indicated where significant as *p < 0.05, **p<0.005 and ***p<0.0005.
In the GWAS analysis of CYP2A6 activity among the MEC smokers, there was little evidence of genomic inflation in the test statistic in the overall sample (λ=1.0). We found 251 variants with globally significant associations with CYP2A6 activity at p<5×10⁻⁸. All but three, were located in a 41.1–41.5 Mb region encompassing the CYP2A6 gene on chromosome 19q13.2, encoding for a family of cytochrome P450 enzymes (Supplemental Table 1). The three other variants associated with CYP2A6 activity were located near the gene MTDH on chromosome 8q22.1. However, these three variants together explain far less of the variability of CYP2A6 activity than the variants near CYP2A6 and we do not focus on these here.
Of the 248 globally significant SNP associations with CYP2A6 activity on chromosome 19, 226 (202 imputed, 22 genotyped) were available in the TRICL GWAS dataset and were the focus of our analyses onwards (Supplemental Table 2). Through forward regression analysis of the 226 variants in the MEC cohort, we identified 13 independent signals; together these 13 SNPs explain 13.6 % of variability in CYP2A6 activity (Table 2) in the MEC smokers. The strongest of these associations is with rs56113850, which on its own explains 6.2% of variability in CYP2A6 activity.
Table 2.
List of SNPs that enter stepwise regression for association with CYP2A6 activity in the MEC smokers while keeping TNE, BMI, age, sex, race & PCs in the model.
| CHR | SNP | BP | Risk_Allelea | Ref_Alleleb | BETAc | Pd |
|---|---|---|---|---|---|---|
| 19 | rs56113850 | 41353107 | T | C | −0.3644 | 1.19E-50 |
| 19 | rs113029345 | 41370176 | C | T | 0.3592 | 1.26E-41 |
| 19 | rs76935404 | 41419294 | T | C | 0.2489 | 1.09E-25 |
| 19 | rs10425738 | 41417727 | G | A | −0.2425 | 1.46E-24 |
| 19 | rs11878604 | 41333284 | C | T | −0.276 | 6.75E-24 |
| 19 | rs7247903 | 41372475 | G | A | −0.3222 | 1.12E-21 |
| 19 | rs2316205 | 41346768 | C | T | 0.1786 | 4.24E-14 |
| 19 | rs4079366 | 41384675 | T | C | −0.1854 | 7.81E-14 |
| 19 | rs73931391 | 41407874 | G | A | −0.5852 | 1.88E-12 |
| 19 | rs2545770 | 41324180 | A | C | −0.2012 | 3.98E-11 |
| 19 | rs185308415 | 41317179 | G | A | −0.3344 | 2.92E-09 |
| 19 | rs76617915 | 41538078 | A | G | −0.6151 | 2.12E-08 |
| 19 | rs7507400 | 41330179 | T | G | −0.1679 | 3.68E-08 |
Risk Allele, allele used for association testing
Ref_Allele, reference allele
BETA, effect estimate per risk allele carried, when MEC GWAS has been adjusted for age, sex, TNE, BMI, race, pc1–pc10
P, MEC GWAS p-value that has been adjusted for age, sex, TNE, BMI, race, pc1–pc10
When the forward selection analysis was performed separately for each of the five ethnic groups we found the number of independent signals to range from one to eight; among Japanese Americans eight independent signals were found to explain 27.9% of variability in CYP2A6 activity, whereas three signals explained 24% of variability among Latino Americans and two signals each explained 14.5% and 11.6% of variability in CYP2A6 activity among African Americans and whites, respectively. A single SNP explained 9.1% of variability noted in CYP2A6 activity in Native Hawaiians. In all ethnic groups, our most significant SNP (rs56113850) entered the stepwise regression model with level p<0.001 explaining from 3.4% (in Japanese Americans) to 18.4% (in Latinos) of the variability of CYP2A6 activity in each group. Further, this was the only SNP in the ethnic-specific analyses that was significantly associated with CYP2A6 activity at the genome wide level in all ethnic groups.
We next tested the associations of the SNPs affecting CYP2A6 activity in the MEC smokers with lung cancer risk in TRICL. Characteristics of the TRICL participants are presented in Supplemental Table 3. Of the 226 overlapping SNPs, 186 (81%) were also directionally consistent in the TRICL dataset, meaning that the allele associated with increased CYP2A6 activity in MEC had a lung cancer odds ratio >1.0 in the TRICL data. In an analysis of the TRICL GWAS data adjusted for age, sex, country (if applicable) and PCs six among the 226 SNPs tested were globally significantly associated with lung cancer at p<5×10⁻⁸ (Figures 2 & 3; Supplemental Table 2; all six of these variants were also found to be strongly associated with levels of CYP2A6 activity in the MEC GWAS and with a direction that was consistent with the expected effect on lung cancer risk (Table 3). We note all six of these SNPs are highly correlated with each other among Whites with correlations above 0.83. The Q-Q plot indicates that this region as a whole is associated with lung cancer with a greater strength of association than expected by chance (Figures 2 & 3). By far, the strongest association for lung cancer risk was with rs35755165 at p=3.45×10⁻¹², (Table 3), this SNP was also significantly associated with CYP2A6 activity levels at p=6.16 ×10⁻¹⁵. Likewise, rs56113850 (the strongest single SNP predictor of CYP2A6 activity) was the second strongest predictor of lung cancer risk and was in modest LD with the top SNP associated with lung cancer rs35755165 (r2=0.47). No other SNP in the region, beyond the 226 SNPs of interest, was associated with lung cancer in TRICL with a p-value less than 4.6×10⁻⁸. When the TRICL analysis was restricted to ever smokers and additionally adjusted for smoking status and pack-years, the six significant SNPs were no longer as strongly associated; and only two variants remained nominally significant. The most significant association was with rs113029345 at p=0.039 (Table 3). When the analysis was stratified by lung cancer cell type, the p values were lower for all SNPs for both adenocarcinoma and squamous cell carcinoma (Supplemental Table 4). For squamous cell carcinoma the lowest p-value (0.006) was observed with rs113029345. As expected, an analysis restricted to never smokers did not yield any significant association for these six SNPs (all p’s>0.35) (data not shown).
Figure -2.
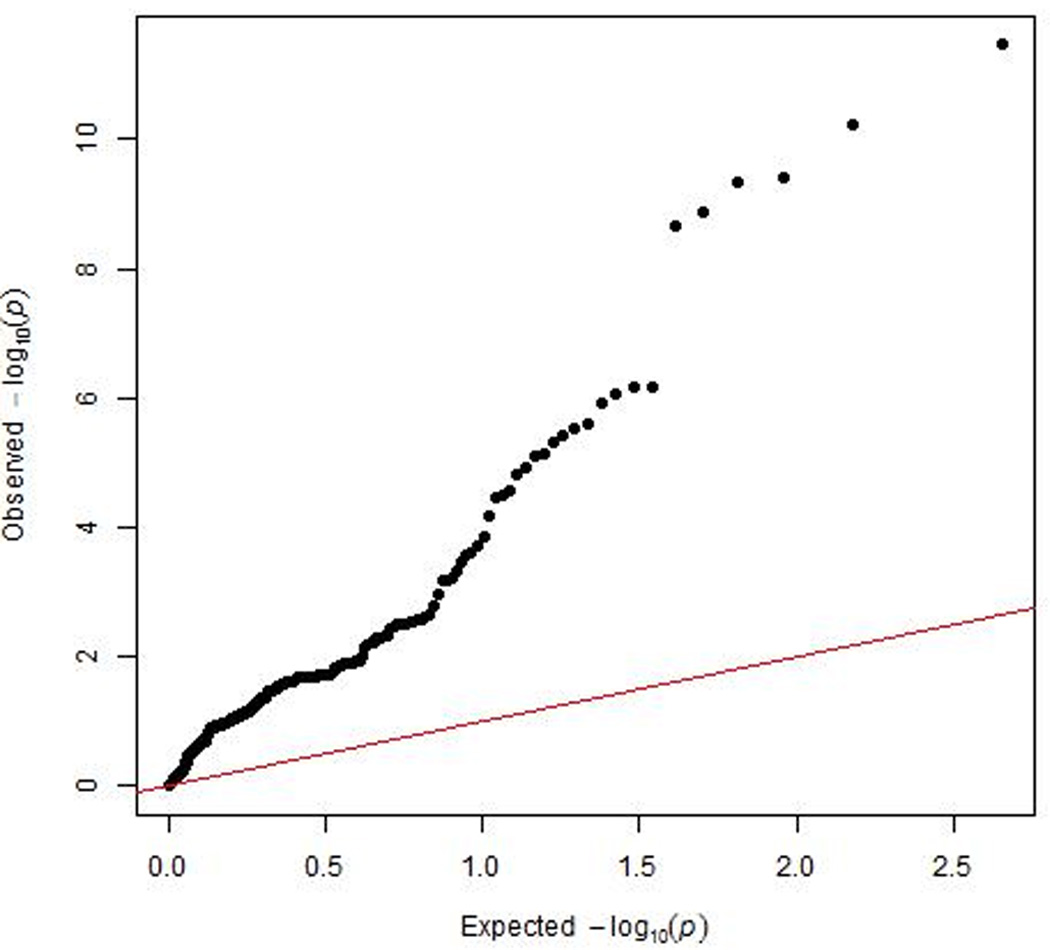
Quantile-Quantile plot of observed and expected –log10 transformed p-values of associations with lung cancer risk in the TRICL study near the CYP2A6 gene.
Figure -3.
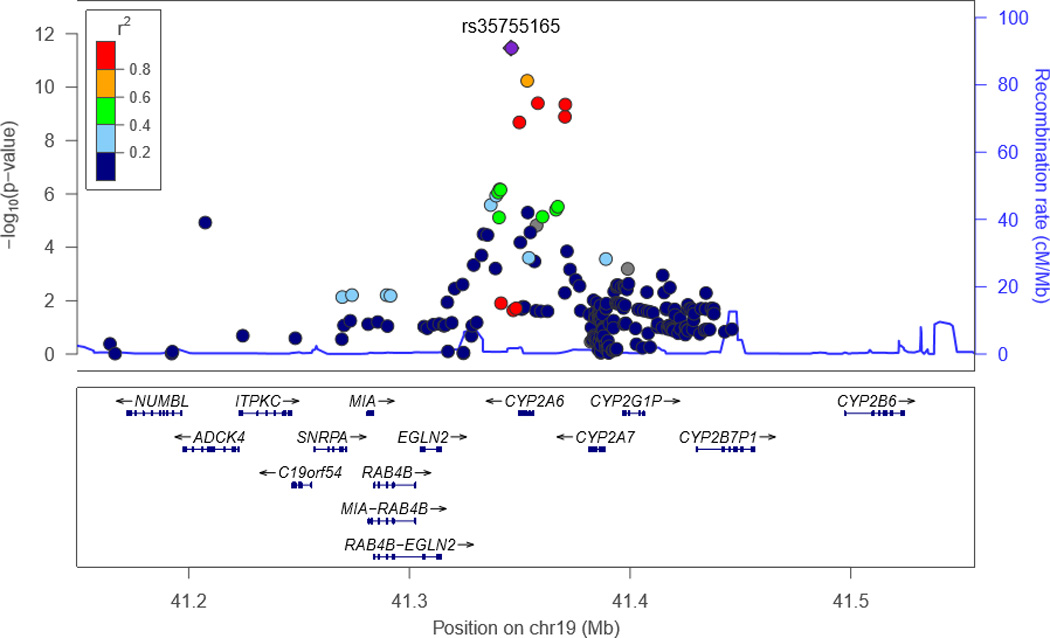
Locus Zoom plot of 19q13.2 in the TRICL study, with European LD values.
Table 3.
The six overlapping globally significant associations (p < 5E-8) with lung cancer risk in TRICL and with CYP2A6 activity in MEC
| CHR | SNP | BP | Genea | Typeb | Risk_Allele_ TRICLc |
Ref_Allele_ TRICLd |
Beta_TRICLe | SE_TRICL f | P_TRICLg | P_TRICLh | Beta_MECi | SE_MEC j | P_MEC k |
|---|---|---|---|---|---|---|---|---|---|---|---|---|---|
| 19 | rs35755165 | 41345989 | RAB4B-EGLN2, CYP2A6 |
intergenic | G | A | 0.1462 | 0.021 | 3.45E-12 | 0.292 | 0.1858 | 0.0236 | 6.16E-15 |
| 19 | rs56113850 | 41353107 | CYP2A6 | intronic | T | C | −0.1369 | 0.0209 | 5.78E-11 | 0.279 | −0.3644 | 0.0237 | 1.19E-50 |
| 19 | rs57837628 | 41357910 | CYP2A6, CYP2A7 | intergenic | A | G | −0.1317 | 0.0211 | 4.01E-10 | 0.145 | −0.3237 | 0.0251 | 6.84E-37 |
| 19 | rs12461383 | 41370338 | CYP2A6, CYP2A7 | intergenic | C | G | −0.1332 | 0.0214 | 4.48E-10 | 0.092 | −0.3275 | 0.0256 | 4.23E-36 |
| 19 | rs113029345 | 41370176 | CYP2A6, CYP2A7 | intergenic | C | T | 0.1319 | 0.0217 | 1.29E-09 | 0.039 | 0.3592 | 0.026 | 1.26E-41 |
| 19 | rs8192733 | 41349550 | CYP2A6 | UTR3 | C | G | 0.1283 | 0.0214 | 2.10E-09 | 0.043 | 0.1368 | 0.0245 | 2.78E-08 |
Gene, nearest gene designation
Type, SNP/variant classification
Risk Allele TRICL, allele used for association testing in TRICL study
Ref_Allele TRICL, reference allele in TRICL study
BETA_TRICL, Effect estimate per risk allele carried, when TRICL GWAS has been adjusted for age, sex, country(if applicable), PCs
SE_TRICL, Standard Error, when TRICL GWAS has been adjusted for age, sex, country(if applicable), PCs
P_TRICL, GWAS p-value has been adjusted for age, sex, country(if applicable), PCs
P_TRICL, GWAS p-value has been adjusted for age, sex, country(if applicable), PCs, smoking status, pack-years
BETA_MEC, Effect estimates per allele carried, when MEC GWAS has been adjusted for age, sex, TNE, BMI, race, PCs
SE_MEC, Standard Error, when MEC GWAS has been adjusted for age, sex, TNE, BMI, race, PCs
P_MEC, GWAS p-value has been adjusted for age, sex, TNE, BMI, race, PCs
In the MEC smokers, we were able to impute (info score ≥ 0.7) the following “functional” variants previously reported to be associated with CYP2A6 activity (39): rs1137115 (*1A), rs1801272 (*2), rs28399433 (*9), rs28399435 (*14), rs28399454 (*17), rs28399468 (*8), rs5031016 (*7), rs61663607 (*1H), and the recently reported functional SNP rs4803381 (also denoted rs150298687) by Bergen et al. (40). We also considered two deletions, CYP2A6*4 and CYP2A6*12, that were genotyped separately using TaqMAN assay CYP2A6-Hs07545274_cn and CYP2A6-Hs07545275_cn, respectively (41). Among whites, we found two of the previously reported functional variants to be in LD with the TRICL top SNP (rs35755165) and the MEC smokers top SNP (rs56113850). The functional variants rs1137115 (CYP2A6*1A) and rs4803381 were in modest LD with rs35755165 in whites (r2=0.37 and 0.46, respectively) (Supplemental Table 5). Likewise, rs1137115 (CYP2A6*1A) and rs4803381 were also correlated with rs56113850 among whites (r2=0.47 and 0.62, respectively). We conducted a conditional analysis on our top variants, rs56113850 (for MEC) and rs35755165 (for TRICL), conditioning on each of the nine known functional CYP2A6 variants and two deletions. For rs56113850, when conditioning on either rs28399433 (*9) or rs4803381, the strength of the association with CYP2A6 activity was weakened slightly (from p=1.19 ×10−50 to p=1.32 ×10−38 and 2.61×10−36, respectively). For rs35755165, adjusting for rs4803381 had the greatest impact on the significance of the association with CYP2A6 activity (p reduction from 3.22 ×10⁻⁹ to 1.71 ×10⁻⁶). We performed a similar conditional analysis for lung cancer risk in the TRICL data (using GCTA based on summary statistics (42)) conditioning on each of the four functional variants (rs4803381, rs1137115, rs28399433, rs61663607) and found that both rs5611850 and rs35755165 remained strongly statistically significant, with the greatest effects noted when conditioning on rs4803381 (p=3.95×10⁻⁸, for rs35755165, and p=9.32×10⁻⁷ for rs5611850).
Discussion
In a multiethnic population of smokers participating in the MEC Biospecimen Sub-Cohort, we identified a large number of variants in the CYP2A6 region that were associated at the genome-wide significance level with CYP2A6 activity (measured by the ratio of total 3-hydroxycotinine to cotinine). We also found that CYP2A6 activity was significantly correlated with an increased uptake of nicotine, as measured by total nicotine equivalents, supporting the hypothesis that a greater CYP2A6 activity has the effect of making smokers smoke more extensively. When we examined the association of these variants on lung cancer risk in the large TRICL GWAS dataset, we found that the vast majority of their individual effects were directionally consistent and associated with an increased lung cancer risk, suggesting that smokers with a high CYP2A6 activity genotype were at greater risk of lung cancer. Indeed, a subset of six variants that were strongly associated with CYP2A6 activity in the MEC was also globally significantly associated with lung cancer risk in TRICL, with effects that were directionally consistent in the two studies.
Overall the data presented here provide strong evidence for an association of specific CYP2A6 variants with lung cancer risk and that this association is primarily due to an influence on smoking behavior rather than a direct effect on susceptibility to lung cancer. We observed that the 6 SNPs that were globally associated with lung cancer risk in the TRICL GWAS without adjusting for smoking remained only marginally significant after adjustment for smoking status and pack-years. The smallest p-value was 0.039 after adjustment for smoking status and pack-years, although for squamous cell carcinoma the lowest p-value was smaller (0.006). We interpret this, like similar data showing that smokers with the CHRNA5 variant uptake more nicotine and carcinogens per cigarette (6), as suggesting that, in epidemiological studies, residual confounding by the effect of smoking remains when adjusting lung cancer risk estimates for cigarettes per day or pack-years. Accordingly, markers of CYP2A6 activity may be useful, along with CHRNA5 genotype, in predicting risk of lung cancer among smokers, over and beyond the exposure information captured through standard smoking history.
We are the first to show with GWAS data that this region is associated with risk of lung cancer, due evidently to its influence on nicotine metabolism as measured by the CYP2A6 activity ratio. CYP2A6 is a member of the cytochrome P450 super family involved in the metabolism of xenobiotics. It is the primary metabolizing enzyme for nicotine and it has been found to metabolize 70% of nicotine into cotinine via C-oxidation (7). Genetic variants in this gene may influence lung cancer risk by modifying nicotine metabolism, and therefore smoking behavior with specific alleles either increasing or decreasing smoking dose and exposure to tobacco lung carcinogens (Figure 1) (6,43,44). However, it should be noted that CYP2A6 variants may also affect bioactivation of the tobacco specific lung carcinogen, 4-(methylnitrosamino)-1-(3-pyridyl)1-butanone (NNK) (13,45). Candidate-gene studies have shown that among Asians, CYP2A6*4, the whole gene deletion, which has been associated with little to no CYP2A6 enzymatic activity, is associated with a decreased risk of lung cancer (11–13,46,47). In a study in whites (48), it was found that a genetic risk score including CYP2A6*2, *4, *9, and *12 was weakly associated with an increased lung cancer risk (wild-type metabolizers vs reduced metabolizers-referent) (OR = 1.26, 95% CI = 0.90 to 1.76; P = .180). Among light smokers, the association with lung cancer reached statistical significance (OR = 1.60, 95% CI = 1.03 to 2.49; P = .036) (48).
A recently published GWAS found 3 variants (rs56113850, rs113288603, and esv2663194) to be globally associated with nicotine metabolism (49). Of these, in our study, only rs56113850 was strongly associated with both CYP2A6 activity levels and lung cancer risk, while rs113288603 and esv2663194 (CYP2A6 *12) were also associated with CYP2A6 activity, but were not strongly associated with lung cancer.
In examining the relationship of our strongest CYP2A6 activity and lung cancer GWAS hits (rs5611850 and rs35755165) with functional variants previously reported to be associated with CYP2A6 activity that were imputed in both TRICL and MEC, we further considered rs4803381, a SNP found to be associated with reduced nicotine metabolism in a two-stage meta-analysis study by Bergen et al. (40). When adjusting for each of these imputed functional variants, our top two SNPs (rs5611850 and rs35755165) remained significantly associated with CYP2A6 activity (all p-values remained <5.8×10⁻⁸). Among the significant functional variants, rs4803381, previously found to be correlated with various functional CYP2A6 haplotypes (50), had the greatest influence on our findings with CYP2A6 activity. The level of significance for both top hits rs56113850 and rs35755165 decreased somewhat when conditioning on rs4803381. When performing similar conditional analyses for lung cancer risk in the TRICL data, we found that both rs5611850 and rs35755165 remained strongly statistically significant when conditioning on any of the same four functional variants, with the greatest effects also noted when conditioning on rs4803381.
We were unable to clearly identify a single, or group of, CYP2A6 functional variants that entirely explained our findings. This may be related to the limitations of the commercial GWAS arrays, which do not systematically include coverage of copy number variants and translocations. However, considering the additional copy number genotyping conducted on the MEC smokers (41), we found that conditioning on CYP2A6*4 or *12 only moderately weakened our SNP findings, suggesting that the associations of rs56113850 and rs35755165 with CYP2A6 activity are independent of the whole or partial gene deletion, respectively. We note that the high sequence homology across CYP2A6, CYP2A7 and CYP2A13 may result in genotyping misclassification for these variants. Indeed, a comparison between the same SNPs genotyped with TaqMan assays and genotyped on the Illumina commercial array or imputed from data using commercial array data in the MEC smokers data showed only a moderate correlation (r2 range=0.62 to 0.81) (41). This all suggests that while rs56113850 and rs35755165 may be linked with one or more functional variants, due to the inherent difficulty in genotyping this region, the causal variants cannot be clearly identified at this time.
The present study comprises of the largest GWAS of CYP2A6 activity and the largest lung cancer GWAS dataset assembled to date. Limitations include our inability to genotype for all CNVs in CYP2A6 that are known to affect CYP2A6 activity, as well as our current inability to conduct lung cancer analyses in populations other than of European ancestry.
In summary, these GWAS studies provide strong support to the long-standing hypothesis that CYP2A6 activity levels modulate lung cancer risk via modulation of smoking levels. We identified specific CYP2A6 variants associated with both CYP2A6 activity (a measure we found correlated to smoking dose) and lung cancer risk, supporting the hypothesis that a greater CYP2A6 activity causes smokers to smoke more extensively and be exposed to higher levels of carcinogens, resulting in an increased risk for lung cancer. From our data, both CYP2A6 activity and CYP2A6 genotype appear to capture additional exposure information, compared to smoking history. Because of the difficulty in genotyping the high-homology region that includes CYP2A6, CYP2A6 activity is expected to be a stronger risk predictor than CYP2A6 genotype. In addition to identifying the exact causal variants, studies are needed to formally test whether CYP2A6 activity and genotype improve current lung cancer risk prediction models for possible application in the context of low-dose computerized tomography screening.
Supplementary Material
Acknowledgments
Funding for MEC: This study was funded by NIH grants 5P01CA138338 (principal investigator, S. Hecht; project leaders, L. Le Marchand, S.E. Murphy, N. Tretyakova); The MEC study is supported by U01 CA164973 (Contact PIs: L. Le Marchand).
Funding for TRICL: The Transdisciplinary Research in Cancer of the Lung (TRICL) Study was supported by NIH grant U19-CA148127 as part of the Genetic Associations and Mechanisms in Oncology (GAME-ON) initiative.
The SLRI study was supported by Canadian Cancer Society Research Institute (020214), Ontario Institute of Cancer and Cancer Care Ontario Chair Award to RH The ICR study was supported by Cancer Research UK (C1298/A8780 and C1298/A8362—Bobby Moore Fund for Cancer Research UK) and NCRN, HEAL and Sanofi-Aventis. Additional funding was obtained from NIH grants (5R01CA055769, 5R01CA127219, 5R01CA133996, and 5R01CA121197). The Liverpool Lung Project (LLP) was supported by The Roy Castle Lung Cancer Foundation, UK. The ICR and LLP studies made use of genotyping data from the Wellcome Trust Case Control Consortium 2 (WTCCC2); a full list of the investigators who contributed to the generation of the data is available from www.wtccc.org.uk. Sample collection for the Heidelberg lung cancer study was in part supported by a grant (70–2919) from the Deutsche Krebshilfe. The work was additionally supported by a Helmholtz-DAAD fellowship (A/07/97379 to MNT) and by the NIH (U19CA148127). The KORA Surveys were financed by the GSF, which is funded by the German Federal Ministry of Education, Science, Research and Technology and the State of Bavaria. The LUng Cancer in the Young study (LUCY) was funded in part by the National Genome Research Network (NGFN), the DFG (BI 576/2-1; BI 576/2-2), the Helmholtzgemeinschaft (HGF) and the Federal office for Radiation Protection (BfS: STSch4454). Genotyping was performed in the Genome Analysis Center (GAC) of the Helmholtz ZentrumMuenchen. Support for the Central Europe, HUNT2/Tromsø and CARET genome-wide studies was provided by Institut National du Cancer, France. Support for the HUNT2/Tromsø genome-wide study was also provided by the European Community
(Integrated Project DNA repair, LSHG-CT- 2005–512113), the Norwegian Cancer Association and the Functional Genomics Programme of Research Council of Norway. Support for the Central Europe study, Czech Republic, was also provided by the European Regional Development Fund and the State Budget of the Czech Republic (RECAMO, CZ.1.05/2.1.00/03.0101). Support for the CARET genomewide study was also provided by grants from the US National Cancer Institute, NIH (R01 CA111703 and UO1 CA63673), and by funds from the Fred Hutchinson Cancer Research Center. Additional funding for study coordination, genotyping of replication studies and statistical analysis was provided by the US National Cancer Institute (R01 CA092039). The lung cancer GWAS from Estonia was partly supported by a FP7 grant (REGPOT 245536), by the Estonian Government (SF0180142s08), by EU RDF in the frame of Centre of Excellence in Genomics and Estoinian Research Infrastructure’s Roadmap and by University of Tartu (SP1GVARENG). The work reported in this paper was partly undertaken during the tenure of a Postdoctoral Fellowship from the IARC (for MNT). The Environment and Genetics in Lung Cancer Etiology (EAGLE), the Alpha-Tocopherol, Beta-Carotene Cancer Prevention Study (ATBC), and the Prostate, Lung, Colon, Ovary Screening Trial (PLCO) studies and the genotyping of ATBC, the Cancer Prevention Study II Nutrition Cohort (CPS-II) and part of PLCO were supported by the Intramural Research Program of NIH, NCI, Division of Cancer Epidemiology and Genetics. ATBC was also supported by US Public Health Service contracts (N01-CN-45165, N01-RC-45035 and N01-RC-37004) from the NCI. PLCO was also supported by individual contracts from the NCI to the University of Colorado Denver (NO1-CN-25514), Georgetown University (NO1-CN-25522), Pacific Health Research Institute (NO1-CN-25515), Henry Ford Health System (NO1-CN-25512), University of Minnesota (NO1-CN-25513), Washington University (NO1-CN-25516), University of Pittsburgh (NO1-CN-25511), University of Utah (NO1-CN-25524), Marshfield Clinic Research Foundation (NO1-CN-25518), University of Alabama at Birmingham (NO1-CN-75022, Westat, Inc. NO1-CN-25476), University of California, Los Angeles (NO1-CN-25404). Approval for the deCODE study was granted by the Icelandic National Bioethics Committee (ref. 12–122-V7) and the Icelandic Data Protection Authority (refs. 2001/25 and 2006/518).
The Cancer Prevention Study II Nutrition Cohort was supported by the American Cancer Society. The NIH Genes, Environment and Health Initiative (GEI) partly funded DNA extraction and statistical analyses (HG-06-033-NCI-01 and RO1HL091172-01), genotyping at the Johns Hopkins University Center for Inherited Disease Research (U01HG004438 and NIHHHSN268200782096C) and study coordination at the GENEVA Coordination Center (U01 HG004446) for EAGLE and part of PLCO studies. Funding for the MD Anderson Cancer Study was provided by NIH grants (P50 CA70907, R01CA121197, R01 CA127219, U19 CA148127, R01 CA55769, K07CA160753) and CPRIT grant (RP100443). Genotyping services were provided by the Center for Inherited Disease Research (CIDR). CIDR is funded through a federal contract from the NIH to The Johns Hopkins University (HHSN268200782096C). The Harvard Lung Cancer Study was supported by the NIH (National Cancer Institute) grants CA092824, CA090578, CA074386.
Footnotes
Conflict of Interest Statement
We confirm that there are no known conflicts of interest associated with this publication and there has been no significant financial support for this work that could have influenced its outcome.
References
- 1.Jemal A, Bray F, Center MM, Ferlay J, Ward E, Forman D. Global cancer statistics. CA: A Cancer Journal for Clinicians. 2011;61(2):69–90. doi: 10.3322/caac.20107. [DOI] [PubMed] [Google Scholar]
- 2.Sampson JN, Wheeler WA, Yeager M, Panagiotou O, Wang Z, Berndt SI, et al. Analysis of Heritability and Shared Heritability Based on Genome-Wide Association Studies for Thirteen Cancer Types. J Natl Cancer Inst. 2015;107(12):djv279. doi: 10.1093/jnci/djv279. [DOI] [PMC free article] [PubMed] [Google Scholar]
- 3.Thorgeirsson TE, Geller F, Sulem P, Rafnar T, Wiste A, Magnusson KP, et al. A variant associated with nicotine dependence, lung cancer and peripheral arterial disease. Nature. 2008;452(7187):638–642. doi: 10.1038/nature06846. [DOI] [PMC free article] [PubMed] [Google Scholar]
- 4.Landi MT, Chatterjee N, Yu K, Goldin LR, Goldstein AM, Rotunno M, et al. A genome-wide association study of lung cancer identifies a region of chromosome 5p15 associated with risk for adenocarcinoma. Am J Hum Genet. 2009;85(5):679–691. doi: 10.1016/j.ajhg.2009.09.012. [DOI] [PMC free article] [PubMed] [Google Scholar]
- 5.Hung RJ, McKay JD, Gaborieau V, Boffetta P, Hashibe M, Zaridze D, et al. A susceptibility locus for lung cancer maps to nicotinic acetylcholine receptor subunit genes on 15q25. Nature. 2008;452(7187):633–637. doi: 10.1038/nature06885. [DOI] [PubMed] [Google Scholar]
- 6.Le Marchand L, Derby KS, Murphy SE, Hecht SS, Hatsukami D, Carmella SG, et al. Smokers with the CHRNA lung cancer-associated variants are exposed to higher levels of nicotine equivalents and a carcinogenic tobacco-specific nitrosamine. Cancer Res. 2008;68(22):9137–9140. doi: 10.1158/0008-5472.CAN-08-2271. [DOI] [PMC free article] [PubMed] [Google Scholar]
- 7.Benowitz NL, Jacob P, 3rd, Fong I, Gupta S. Nicotine metabolic profile in man: comparison of cigarette smoking and transdermal nicotine. J Pharmacol Exp Ther. 1994;268(1):296–303. [PubMed] [Google Scholar]
- 8.Dempsey D, Tutka P, Jacob P, 3rd, Allen F, Schoedel K, Tyndale RF, et al. Nicotine metabolite ratio as an index of cytochrome P450 2A6 metabolic activity. Clin Pharmacol Ther. 2004;76(1):64–72. doi: 10.1016/j.clpt.2004.02.011. [DOI] [PubMed] [Google Scholar]
- 9.Pianezza ML, Sellers EM, Tyndale RF. Nicotine metabolism defect reduces smoking. Nature. 1998;393(6687):750. doi: 10.1038/31623. [DOI] [PubMed] [Google Scholar]
- 10.Derby KS, Cuthrell K, Caberto C, Carmella SG, Franke AA, Hecht SS, et al. Nicotine metabolism in three ethnic/racial groups with different risks of lung cancer. Cancer Epidemiol Biomarkers Prev. 2008;17(12):3526–3535. doi: 10.1158/1055-9965.EPI-08-0424. [DOI] [PMC free article] [PubMed] [Google Scholar]
- 11.Miyamoto M, Umetsu Y, Dosaka-Akita H, Sawamura Y, Yokota J, Kunitoh H, et al. CYP2A6 gene deletion reduces susceptibility to lung cancer. Biochem Biophys Res Commun. 1999;261(3):658–660. doi: 10.1006/bbrc.1999.1089. [DOI] [PubMed] [Google Scholar]
- 12.London SJ, Idle JR, Daly AK, Coetzee GA. Genetic variation of CYP2A6, smoking, and risk of cancer. Lancet. 1999;353(9156):898–899. doi: 10.1016/S0140-6736(98)04984-8. [DOI] [PubMed] [Google Scholar]
- 13.Yuan JM, Nelson HH, Butler LM, Carmella SG, Wang R, Kuriger-Laber JK, et al. Genetic determinants of cytochrome P450 2A6 activity and biomarkers of tobacco smoke exposure in relation to risk of lung cancer development in the Shanghai Cohort Study. Int J Cancer. 2015 doi: 10.1002/ijc.29963. [DOI] [PMC free article] [PubMed] [Google Scholar]
- 14.Benowitz NL. Nicotine addiction. Prim Care. 1999;26(3):611–631. doi: 10.1016/s0095-4543(05)70120-2. [DOI] [PubMed] [Google Scholar]
- 15.Kandel DB, Hu MC, Schaffran C, Udry JR, Benowitz NL. Urine nicotine metabolites and smoking behavior in a multiracial/multiethnic national sample of young adults. Am J Epidemiol. 2007;165(8):901–910. doi: 10.1093/aje/kwm010. [DOI] [PubMed] [Google Scholar]
- 16.Kolonel LN, Henderson BE, Hankin JH, Nomura AM, Wilkens LR, Pike MC, et al. A multiethnic cohort in Hawaii and Los Angeles: baseline characteristics. Am J Epidemiol. 2000;151(4):346–357. doi: 10.1093/oxfordjournals.aje.a010213. [DOI] [PMC free article] [PubMed] [Google Scholar]
- 17.Timofeeva MN, Hung RJ, Rafnar T, Christiani DC, Field JK, Bickeboller H, et al. Influence of common genetic variation on lung cancer risk: meta-analysis of 14 900 cases and 29 485 controls. Hum Mol Genet. 2012;21(22):4980–4995. doi: 10.1093/hmg/dds334. [DOI] [PMC free article] [PubMed] [Google Scholar]
- 18.Murphy SE, Park SS, Thompson EF, Wilkens LR, Patel Y, Stram DO, et al. Nicotine N-glucuronidation relative to N-oxidation and C-oxidation and UGT2B10 genotype in five ethnic/racial groups. Carcinogenesis. 2014;35(11):2526–2533. doi: 10.1093/carcin/bgu191. [DOI] [PMC free article] [PubMed] [Google Scholar]
- 19.Patel YM, Stram DO, Wilkens LR, Park SS, Henderson BE, Le Marchand L, et al. The Contribution of Common Genetic Variation to Nicotine and Cotinine Glucuronidation in Multiple Ethnic/Racial Populations. Cancer Epidemiol Biomarkers Prev. 2014 doi: 10.1158/1055-9965.EPI-14-0815. [DOI] [PMC free article] [PubMed] [Google Scholar]
- 20.Delaneau O, Marchini J, Zagury JF. A linear complexity phasing method for thousands of genomes. Nat Methods. 2012;9(2):179–181. doi: 10.1038/nmeth.1785. [DOI] [PubMed] [Google Scholar]
- 21.Howie BN, Donnelly P, Marchini J. A flexible and accurate genotype imputation method for the next generation of genome-wide association studies. PLoS Genet. 2009;5(6):e1000529. doi: 10.1371/journal.pgen.1000529. [DOI] [PMC free article] [PubMed] [Google Scholar]
- 22.Yang J, Manolio TA, Pasquale LR, Boerwinkle E, Caporaso N, Cunningham JM, et al. Genome partitioning of genetic variation for complex traits using common SNPs. Nat Genet. 2011;43(6):519–525. doi: 10.1038/ng.823. [DOI] [PMC free article] [PubMed] [Google Scholar]
- 23.Pe'er I, Yelensky R, Altshuler D, Daly MJ. Estimation of the multiple testing burden for genomewide association studies of nearly all common variants. Genet Epidemiol. 2008;32(4):381–385. doi: 10.1002/gepi.20303. [DOI] [PubMed] [Google Scholar]
- 24.Amos CI, Wu X, Broderick P, Gorlov IP, Gu J, Eisen T, et al. Genome-wide association scan of tag SNPs identifies a susceptibility locus for lung cancer at 15q25.1. Nat Genet. 2008;40(5):616–622. doi: 10.1038/ng.109. [DOI] [PMC free article] [PubMed] [Google Scholar]
- 25.Landi MT, Consonni D, Rotunno M, Bergen AW, Goldstein AM, Lubin JH, et al. Environment And Genetics in Lung cancer Etiology (EAGLE) study: an integrative population-based case-control study of lung cancer. BMC Public Health. 2008;8:203. doi: 10.1186/1471-2458-8-203. [DOI] [PMC free article] [PubMed] [Google Scholar]
- 26.Hayes RB, Sigurdson A, Moore L, Peters U, Huang WY, Pinsky P, et al. Methods for etiologic and early marker investigations in the PLCO trial. Mutat Res. 2005;592(1–2):147–154. doi: 10.1016/j.mrfmmm.2005.06.013. [DOI] [PubMed] [Google Scholar]
- 27.Scelo G, Constantinescu V, Csiki I, Zaridze D, Szeszenia-Dabrowska N, Rudnai P, et al. Occupational exposure to vinyl chloride, acrylonitrile and styrene and lung cancer risk (europe) Cancer Causes Control. 2004;15(5):445–452. doi: 10.1023/B:CACO.0000036444.11655.be. [DOI] [PubMed] [Google Scholar]
- 28.Omenn GS, Goodman G, Thornquist M, Grizzle J, Rosenstock L, Barnhart S, et al. The beta-carotene and retinol efficacy trial (CARET) for chemoprevention of lung cancer in high risk populations: smokers and asbestos-exposed workers. Cancer Res. 1994;54(7 Suppl):2038s–2043s. [PubMed] [Google Scholar]
- 29.Holmen J, Midthjell K, Kruger O, Langhammer A, Holmen TL, Bratberg GH, et al. The Nord-Trøndelag Health Study 1995–97 (HUNT 2): Objectives, contents, methods and participation. Norsk Epidemiologi. 2003;13(1):19–32. [Google Scholar]
- 30.Feyler A, Voho A, Bouchardy C, Kuokkanen K, Dayer P, Hirvonen A, et al. Point: myeloperoxidase −463G --> a polymorphism and lung cancer risk. Cancer Epidemiol Biomarkers Prev. 2002;11(12):1550–1554. [PubMed] [Google Scholar]
- 31.Nelis M, Esko T, Magi R, Zimprich F, Zimprich A, Toncheva D, et al. Genetic structure of Europeans: a view from the North-East. PLoS One. 2009;4(5):e5472. doi: 10.1371/journal.pone.0005472. [DOI] [PMC free article] [PubMed] [Google Scholar]
- 32.Sauter W, Rosenberger A, Beckmann L, Kropp S, Mittelstrass K, Timofeeva M, et al. Matrix metalloproteinase 1 (MMP1) is associated with early-onset lung cancer. Cancer Epidemiol Biomarkers Prev. 2008;17(5):1127–1135. doi: 10.1158/1055-9965.EPI-07-2840. [DOI] [PubMed] [Google Scholar]
- 33.Thorgeirsson TE, Geller F, Sulem P, Rafnar T, Wiste A, Magnusson KP, et al. A variant associated with nicotine dependence, lung cancer and peripheral arterial disease. Nature. 2008;452(7187):638–642. doi: 10.1038/nature06846. [DOI] [PMC free article] [PubMed] [Google Scholar]
- 34.Li Y, Willer CJ, Ding J, Scheet P, Abecasis GR. MaCH: using sequence and genotype data to estimate haplotypes and unobserved genotypes. Genet Epidemiol. 2010;34(8):816–834. doi: 10.1002/gepi.20533. [DOI] [PMC free article] [PubMed] [Google Scholar]
- 35.Howie B, Fuchsberger C, Stephens M, Marchini J, Abecasis GR. Fast and accurate genotype imputation in genome-wide association studies through pre-phasing. Nat Genet. 2012;44(8):955–959. doi: 10.1038/ng.2354. [DOI] [PMC free article] [PubMed] [Google Scholar]
- 36.Price AL, Patterson NJ, Plenge RM, Weinblatt ME, Shadick NA, Reich D. Principal components analysis corrects for stratification in genome-wide association studies. Nat Genet. 2006;38(8):904–909. doi: 10.1038/ng1847. [DOI] [PubMed] [Google Scholar]
- 37.Willer CJ, Li Y, Abecasis GR. METAL: fast and efficient meta-analysis of genomewide association scans. Bioinformatics. 2010;26(17):2190–2191. doi: 10.1093/bioinformatics/btq340. [DOI] [PMC free article] [PubMed] [Google Scholar]
- 38.Yang J, Lee SH, Goddard ME, Visscher PM. GCTA: a tool for genome-wide complex trait analysis. Am J Hum Genet. 2011;88(1):76–82. doi: 10.1016/j.ajhg.2010.11.011. [DOI] [PMC free article] [PubMed] [Google Scholar]
- 39.Bloom J, Hinrichs AL, Wang JC, von Weymarn LB, Kharasch ED, Bierut LJ, et al. The contribution of common CYP2A6 alleles to variation in nicotine metabolism among European-Americans. Pharmacogenet Genomics. 2011;21(7):403–416. doi: 10.1097/FPC.0b013e328346e8c0. [DOI] [PMC free article] [PubMed] [Google Scholar]
- 40.Bergen AW, Michel M, Nishita D, Krasnow R, Javitz HS, Conneely KN, et al. Drug Metabolizing Enzyme and Transporter Gene Variation, Nicotine Metabolism, Prospective Abstinence, and Cigarette Consumption. PLoS One. 2015;10(7):e0126113. doi: 10.1371/journal.pone.0126113. [DOI] [PMC free article] [PubMed] [Google Scholar]
- 41.Park SL, Tiirikainen M, Patel Y, Wilkens LR, Stram DO, Le Marchand L, et al. Genetic determinants of CYP2A6 activity across racial/ethnic groups with different risk of lung cancer and effect on their smoking intensity. Carcinogenesis. 2016 doi: 10.1093/carcin/bgw012. [DOI] [PMC free article] [PubMed] [Google Scholar]
- 42.Yang J, Ferreira T, Morris AP, Medland SE, Genetic Investigation of ATC, Replication DIG et al. Conditional and joint multiple-SNP analysis of GWAS summary statistics identifies additional variants influencing complex traits. Nat Genet. 2012;44(4):369–375. S1–S3. doi: 10.1038/ng.2213. [DOI] [PMC free article] [PubMed] [Google Scholar]
- 43.Pan L, Yang X, Li S, Jia C. Association of CYP2A6 gene polymorphisms with cigarette consumption: a meta-analysis. Drug Alcohol Depend. 2015;149:268–271. doi: 10.1016/j.drugalcdep.2015.01.032. [DOI] [PubMed] [Google Scholar]
- 44.Bloom AJ, Baker TB, Chen LS, Breslau N, Hatsukami D, Bierut LJ, et al. Variants in two adjacent genes, EGLN2 and CYP2A6, influence smoking behavior related to disease risk via different mechanisms. Hum Mol Genet. 2014;23(2):555–561. doi: 10.1093/hmg/ddt432. [DOI] [PMC free article] [PubMed] [Google Scholar]
- 45.Jalas JR, Hecht SS, Murphy SE. Cytochrome P450 enzymes as catalysts of metabolism of 4-(methylnitrosamino)-1-(3-pyridyl)-1-butanone, a tobacco specific carcinogen. Chem Res Toxicol. 2005;18(2):95–110. doi: 10.1021/tx049847p. [DOI] [PubMed] [Google Scholar]
- 46.Liu YL, Xu Y, Li F, Chen H, Guo SL. CYP2A6 deletion polymorphism is associated with decreased susceptibility of lung cancer in Asian smokers: a meta-analysis. Tumour Biol. 2013;34(5):2651–2657. doi: 10.1007/s13277-013-0815-y. [DOI] [PubMed] [Google Scholar]
- 47.Wang L, Zang W, Liu J, Xie D, Ji W, Pan Y, et al. Association of CYP2A6*4 with susceptibility of lung cancer: a meta-analysis. PLoS One. 2013;8(4):e59556. doi: 10.1371/journal.pone.0059556. [DOI] [PMC free article] [PubMed] [Google Scholar] [Retracted]
- 48.Wassenaar CA, Dong Q, Wei Q, Amos CI, Spitz MR, Tyndale RF. Relationship between CYP2A6 and CHRNA5-CHRNA3-CHRNB4 variation and smoking behaviors and lung cancer risk. J Natl Cancer Inst. 2011;103(17):1342–1346. doi: 10.1093/jnci/djr237. [DOI] [PMC free article] [PubMed] [Google Scholar]
- 49.Loukola A, Buchwald J, Gupta R, Palviainen T, Hallfors J, Tikkanen E, et al. A Genome-Wide Association Study of a Biomarker of Nicotine Metabolism. PLoS Genet. 2015;11(9):e1005498. doi: 10.1371/journal.pgen.1005498. [DOI] [PMC free article] [PubMed] [Google Scholar]
- 50.Haberl M, Anwald B, Klein K, Weil R, Fuss C, Gepdiremen A, et al. Three haplotypes associated with CYP2A6 phenotypes in Caucasians. Pharmacogenet Genomics. 2005;15(9):609–624. doi: 10.1097/01.fpc.0000171517.22258.f1. [DOI] [PubMed] [Google Scholar]
Associated Data
This section collects any data citations, data availability statements, or supplementary materials included in this article.