Abstract
In many aggressive cancers, such as glioblastoma multiforme (GBM), progression is enabled by local immunosuppression driven by the accumulation of regulatory T cells (Treg) and myeloid-derived suppressor cells (MDSC). However, the mechanistic details of how Treg and MDSC are recruited in various tumors is not yet well understood. Here we report that macrophages and microglia within the glioma microenvironment produce CCL2, a chemokine that is critical for recruiting both CCR4+ Treg and CCR2+Ly-6C+ monocytic MDSC in this disease setting. In murine gliomas, we established novel roles for tumor-derived CCL20 and osteoprotegerin in inducing CCL2 production from macrophages and microglia. Tumors grown in CCL2 deficient mice failed to maximally accrue Treg and monocytic MDSC. In mixed-bone marrow chimera assays, we found that CCR4-deficient Treg and CCR2-deficient monocytic MDSC were defective in glioma accumulation. Further, administration of a small molecule antagonist of CCR4 improved median survival in the model. In clinical specimens of GBM, elevated levels of CCL2 expression correlated with reduced overall survival of patients. Lastly, we found that CD163-positive infiltrating macrophages were a major source of CCL2 in GBM patients. Collectively, our findings show how glioma cells influence the tumor microenvironment to recruit potent effectors of immunosuppression that drive progression.
INTRODUCTION
Immune evasion is a major hallmark of tumorigenesis and a potent barrier to effective cancer therapies (1). In a wide spectrum of cancer types, immune evasion manifests as the recruitment of immunosuppressive regulatory T cells (Tregs) and myeloid-derived suppressor cells (MDSCs) to the tumor microenvironment. Tregs are a FOXP3-expressing subset of CD4+ T cells which play an important role in maintaining immunological tolerance to self under normal physiological conditions (2). However, Treg infiltration occurs in a variety of cancer types and is correlated with worse prognosis in breast, ovarian, gastric, and esophageal cancers (3–5). MDSCs are thought to originate from monocytes that gain immunosuppressive capacity under certain pathological conditions (6,7). Human MDSCs are characterized by the pan-myeloid marker CD33, with monocytic CD14+ and granulocytic CD15+ subsets. Murine MDSCs are defined as CD11b+Gr-1+ cells, with monocytic Ly-6C+ and granulocytic Ly-6G+ cellular subsets.
Glioblastoma multiforme (GBM) (WHO Astrocytoma Grade IV) is the most common malignant adult brain tumor with a dismal prognosis for patients. Median survival of GBM is just 14.6 months even with the treatment standard of surgery, radiation, and chemotherapy (8). The GBM microenvironment is characterized by high levels of immunosuppressive cytokines as well as the accumulation of Tregs and MDSCs (9–13). In gliomas, Treg infiltration is higher in GBM compared to lower grade astrocytomas, though conflicting reports exist on the prognostic value of Treg infiltration (9,10,14). Increased peripheral MDSCs have been observed in GBM patients (15). In addition, monocytes from healthy donors acquire MDSC characteristics when treated with conditioned media from GBM cell lines (12). Despite the importance of these cells for the progression of GBM, the mechanistic sequence of events underlying the recruitment of these cells has yet to be elucidated.
CCL2 is a potential candidate chemokine for Treg trafficking to glioma. Supernatant from cultured U251 GBM cells contains soluble CCL2 and can induce Treg migration in vitro (16). Patients with GBM possess an increased percentage of circulating Tregs that express CCR4, a chemokine receptor that binds to CCL2, albeit with lower affinity than for CCL17 and CCL22 (16,17). CCL2 has also been tied to the migration of MDSCs. CCR2, a high affinity chemokine receptor for CCL2, is found on several different myeloid cell populations, including MDSCs (18). Virally induced gliomas in Ccl2−/− mice possess markedly reduced MDSC infiltration (15). Although these studies have implicated a potential role for the CCL2-CCR4/CCR2 axis, the sequence of events from the induction of CCL2 production to the in vivo chemokine-chemokine receptor requirements for Tregs and MDSC recruitment remains incompletely understood. We hypothesized that CCL2 recruits both Tregs and MDSCs in GBM, thus unifying the two immunosuppressive cell subsets under one axis. We sought to determine the clinical relevance of CCL2 in large scale patient data, identify sources of CCL2, and elucidate the underlying mechanisms driving Treg and MDSC accumulation. In this report, we determined that CCL2 expression is a prognostic factor for patients with GBM and can be produced by both macrophages as well as glial cells in GBM patient samples. In addition, we observed that CD163+ infiltrating macrophages contribute to CCL2 production in GBM patients. In the GL261 immunocompetent murine model of GBM, we found that tumor-associated macrophages and microglia are major sources CCL2 which subsequently recruits CCR4-expressing Tregs and CCR2-expressing Ly-6C+ monocytic MDSCs. We established novel roles for tumor-derived CCL20 and osteoprotegerin in inducing CCL2 production from macrophages and microglia. Through mixed-bone marrow chimera studies, we observed a role for CCR4 in Treg recruitment and a requirement for CCR2 in the accumulation of monocytic MDSCs in glioma. Finally, using a small molecule antagonist, we demonstrated that the CCL2-CCR4/2 axis is a relevant therapeutic target in GBM. Collectively, these studies delineate how microenvironment-derived CCL2 results in the accumulation of Tregs and MDSCs in glioma.
MATERIALS AND METHODS
Cell culture
GL261 cells (NCI Frederick National Tumor Repository Lab, obtained in 2007) and mixed-cortical cell cultures were cultured in Dulbecco’s Modified Eagle’s Medium (Corning) supplemented with 10% Fetal Bovine Serum (FBS), penicillin/streptomycin solution, and Normocin (InvivoGen). Cell line authentication was not conducted at this time. Microglia were cultured in X-VIVO 15 (Lonza). Bone marrow cells, bone marrow-derived macrophages, and Tregs were cultured in RPMI Medium 1640 (Corning) supplemented with penicillin/streptomycin, L-glutamine, β-mercaptoethanol, and FBS.
Mice
All mice were bred and housed under SPF conditions in the Carlson Barrier Facility at the University of Chicago. Wild-type C57BL/6J mice (Stock 000664), Ccl2−/− mice (B6.129S4-Ccl2tm1Rol/J, Stock 004434), Ccr2RFP/RFP mice (B6.129(Cg)-Ccr2tm2.1Ifc/J, Stock 017586), and CD45.1+ mice (B6.SJL-Ptprca Pepcb/BoyJ, Stock 002014), were purchased from The Jackson Laboratory. Ccr4−/− mice were kindly provided by Dr. John Belperio (University of California Los Angeles).
Patient data
A detailed description can be found in the Supplementary Materials and Methods section.
Immunohistochemistry
A detailed description can be found in the Supplementary Materials and Methods section.
Orthotopic GL261 model of GBM
4 × 10⁵ GL261 cells were intracranially (i.c.) implanted as previously described (19). Mice were treated with the small molecule CCR4 antagonist C 021 dihydrochloride (Tocris) at 15 mg/kg-50 mg/kg doses administered subcutaneously every other day for a total of 5 doses beginning 1 day post-i.c. GL261 implantation.
Immunofluorescence microscopy
A detailed description can be found in the Supplementary Materials and Methods section.
Bone marrow-derived macrophages and cytokine treatment
A detailed description can be found in the Supplementary Materials and Methods section.
Mixed-cortical cell cultures and isolation of microglia
Performed according to a previously published protocol (20).
ELISA
The Ready-Set-Go! Mouse CCL2 ELISA Kit (EBioscience) was used according to manufacturer’s protocol.
Antibody array
Supernatant from GL261 cultures or MCCC were incubated with the Mouse Cytokine Array C6 (AAM-CYT-6, RayBiotech) and developed according to manufacturer’s protocol. Film was scanned and analyzed for densitometry using ImageJ.
Flow cytometry
Tissue preparation and flow cytometric analysis was completed as previously published (19).
Mixed-bone marrow chimera generation and competition assay
Recipient mice at least 6 weeks of age were irradiated with 1100 cGy using a Gammacell 40 Exactor irradiator (Theratronics). 24 hours post-irradiation, mice were injected with a 1:1 ratio of WT CD45.1+ bone marrow cells or bone marrow cells from CCR4-deficient or CCR2-deficient mice. After 6 weeks following bone marrow reconstitution, mice were injected intracranially with GL261 cells and used for experiments.
Statistics
Groups were compared with Student’s two-tailed t test or one-way ANOVA with Tukey’s test for multiple comparisons as indicated in figure legends. A P value of less than 0.05 was considered statistically significant. Survival curves were compared with the Log-rank test, corrected using the Bonferroni method if multiple survival curves were compared. All statistical tests were done using either Prism 6.0 (Graphpad) or Stata (Statacorp).
Study approval
All animal experiments were approved by the Institutional Animal Care and Use Committee at the University of Chicago.
RESULTS
CCL2 is a clinically relevant prognostic factor in GBM patients
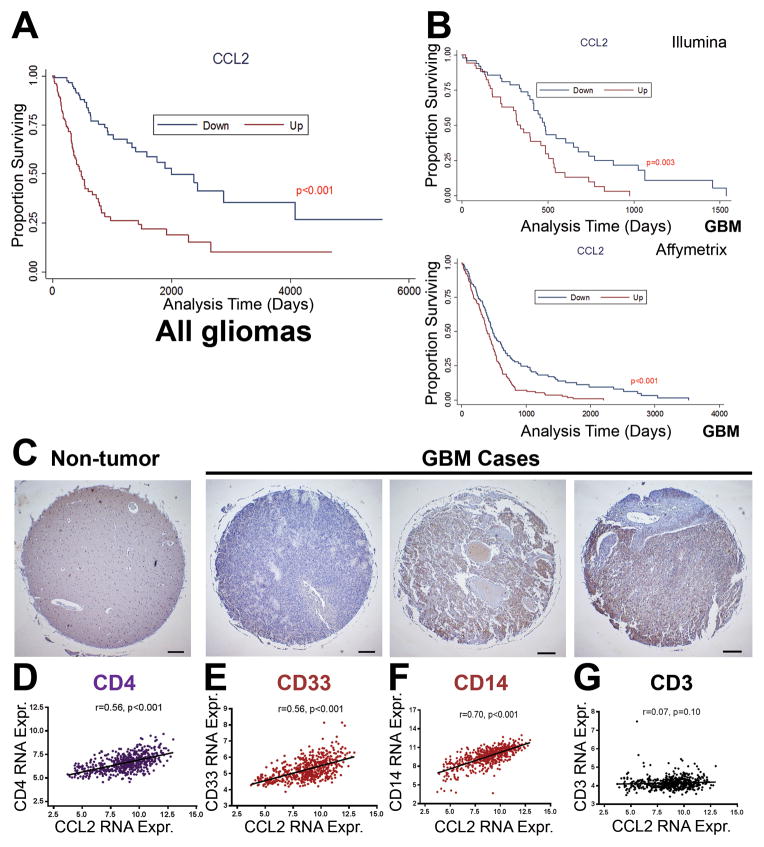
To determine the clinical relevance of CCL2, we obtained gene expression data and clinical parameters from GBM patient data available through The Cancer Genome Atlas (TCGA). Patients were stratified into CCL2-high and CCL2-low groups based on CCL2 gene expression. Median survival was significantly increased in CCL2-low subset patients in data encompassing all glioma grades (Figure 1A) as well as in data limited to GBM cases alone (Figure 1B) when compared to the CCL2-high subset (Affymetrix U133A: CCL2-low 479 days, CCL2-high 375 days, P < 0.001) (Illumina HiSeq: CCL2-low 485 days, CCL2-high 317 days, P = 0.003). CCL2 expression was confirmed as a prognostic factor in GBM patients through both univariate and multivariate Cox regression analysis (HR=1.11). In contrast to CCL2, gene expression levels of CCL1, CCL3, CCL4, and CCL28 did not segregate GBM patient survival (Supplementary Figure S1A–D). To survey CCL2 protein levels in GBM, we performed immunohistochemical staining of CCL2 on a GBM patient tissue microarray with 35 GBM cases with 2 cores from each case (Supplementary Figure S1H–I). In non-tumor brain biopsies, CCL2 expression was scored as 0 (Figure 1C, left). In contrast, among the 35 GBM cases available on the tissue microarray, 16 cases were scored as 0 (no CCL2 staining), 6 cases were scored as 1 (low), 9 cases were scored as 2 (medium), and 4 cases were scored as 3 (highest staining). CCL2 expression was also correlated to the expression of the human MDSC markers CD33 (r = 0.56, P < 0.001) and CD14 (r = 0.70, P < 0.01), as well as the expression of CD4 (r = 0.56, P < 0.001) (Figure 1D–1G). Importantly, CCL2 expression was not correlated to the expression of the pan-T cell marker CD3, implying some specificity to the correlation with CD4 and MDSC markers (Figure 1G). Overall, the results suggest that CCL2 mRNA expression serves as an important prognostic factor for survival in GBM and the clinical relevance of CCL2 extends to its presence on a protein level in GBM patient samples.
Figure 1. CCL2 is a clinically relevant chemokine in GBM on a transcript and protein level.
(A) Kaplan-Meier survival curves of glioma patients (Grade I–IV) were generated from TCGA Illumina HiSeq data where patients were segregated into CCL2-low and CCL2-high expressing groups on the basis of <mean - 0.5SD (for CCL2-down) and >mean + 0.5SD (CCL2-up) (CCL2-down, n = 161; CCL2-up, n = 159). (B) Analysis restricted to GBM (Grade IV) patients for both Illumina HiSeq (CCL2-down, n = 42; CCL2-up, n = 41) (top) and Affymetrix U133A (CCL2-down, n = 135; CCL2-up, n = 134) (bottom) arrays. (C) Representative images from GBM tissue microarray. Pathology scoring from left to right: 0, 2, 2 on a scale of 0–3. Scale bar = 200 μm. (D–G) Pearson correlation between gene expression from GBM patient data of CCL2 expression and CD4, CD33, CD14, and CD3. GBM, glioblastoma mutiforme. TCGA, the Cancer Genome Atlas. Kaplan-Meier curves were compared using the Log-rank test. RNA Expr., relative mRNA expression.
CD163-positive macrophages contribute to CCL2 production in GBM patients
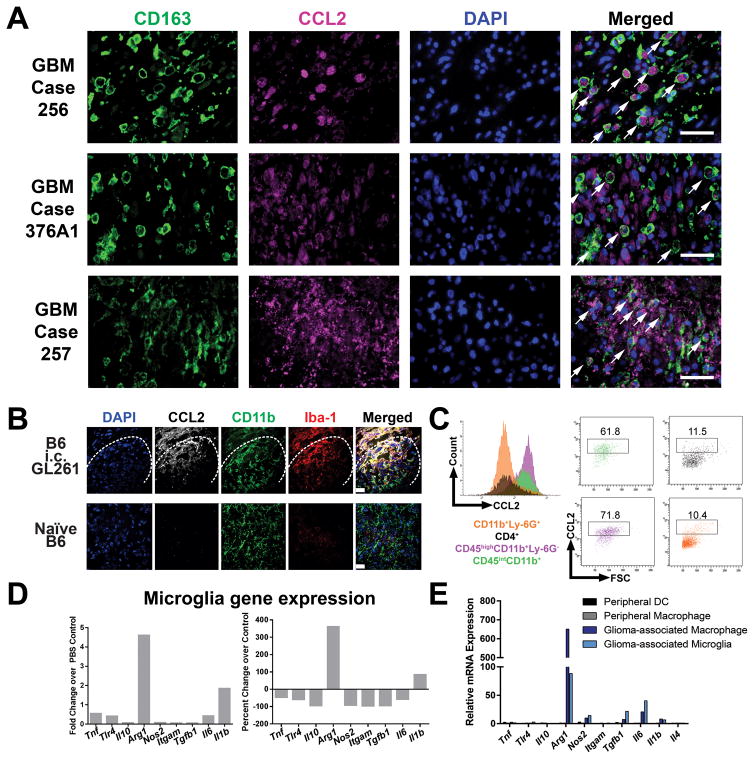
Previous reports have found that CCL2 can be produced by astrocytes in the context of neuroinflammation and by tumor cells in the context of glioma (16,21,22). However, because CCL2 can also be produced by tumor-associated macrophages, we sought to determine the respective contributions of glial cells compared to macrophages and microglia for CCL2 production in GBM patients on a protein level (23,24). To this end, we performed double-immunofluorescence labeling of CCL2 and the macrophage/microglia marker CD163 in formalin-fixed, paraffin-embedded sections from 20 GBM patients. We opted for whole sections to ensure extensive anatomical coverage of GBM tumor areas. We observed heavy infiltration of CD163+ cells that were morphologically infiltrating macrophages in 13/20 GBM cases. CCL2 staining was found in both cellular tumor areas as well as in perinecrotic zones. We observed strong CCL2 immunoreactivity in both CD163+ cells as well as in CD163− cells in the cases with heavy CD163+ cell infiltration (Figure 2A). We observed CCL2 immunoreactivity in CD163+ (Figure 2A, GBM case 256) as well as in both CD163+ and CD163− cells (Figure 2A, GBM case 376A1 and 257). The CD163− cells that produce CCL2 are most likely tumor cells, per previous reports. Therefore, both tumor cells as well as glioma-associated macrophages are capable of producing CCL2 in GBM patients.
Figure 2. Myeloid cells are major sources of CCL2 in GBM patients and GL261 tumors.
(A) Double-immunofluorescence labeling of CD163 and CCL2 in GBM patient tumor samples. Scale bar = 50 μm. Arrows, CCL2-positive, CD163-positive cells. (B) Sections of 1 week post-GL261 implanted or control brains stained for CCL2, CD11b, and Iba1. Dashed line indicates tumor border. Scale bar = 10 μm. (C) Intracellular cytokine staining of CCL2 in CD45highCD11b+Ly-6G+ macrophages and CD45intCD11b+ microglia. (D) CD45intCD11b+ microglia were sorted from tumor-bearing mice (n = 5) and gene expression was analyzed by qRT-PCR compared to PBS-injected mice. (E) Expression of M1- and M2-associated genes in glioma-associated microglia and macrophages compared to peripheral macrophages and CD45highCD11b−CD11c+ dendritic cells (DCs) isolated from spleens within the same mice. Images and plots in (B–C) are representative of 3 independent replicates. Data are representative of at least 2 independent experiments. Data in A are represented as mean ± SEM; **** P < 0.0001 by Student’s t test.
CCL2 is a major microenvironment-derived Treg and MDSC-recruiting candidate chemokine in the GL261 model of GBM
We next investigated the GL261 murine model of GBM to determine the role of CCL2 directly. In this model, Tregs and MDSCs accumulate in the brain after syngeneic GL261 astrocytoma cells are implanted into C57BL/6 mice (19). We determined CCL2 transcript expression localization in GL261-bearing brains at 1 week post-injection, during the recruitment phase for Tregs and MDSCs. Strikingly, high CCL2 transcript levels were found within leukocytes isolated by density gradient centrifugation, ~20 fold over PBS control in the whole leukocyte preparation compared to 5-fold over PBS control in non-leukocytes (Supplementary Figure S2A). CCL2 was also detected on the protein level via ELISA (260 ± 33 ng/mL in the GL261-injected hemisphere compared to 93 ± 7 ng/mL in the non-GL261-injected hemisphere, P = 0.0075, mean ± SEM) (Supplementary Figure S2B) and immunofluorescence microscopy (Supplementary Figure S2C) from the brains of mice at 1 week post-intracranial (i.c.) injection of GL261 cells. Furthermore, CCL2 was expressed at the highest level at 1 week post-GL261 injection compared to other candidate Treg and MDSC-recruiting chemokines (Supplementary Figure S2D). Collectively, these data indicate that CCL2 is present both at the mRNA and protein level in murine brain tumors and that a major source of CCL2 lies within leukocytes in the glioma microenvironment.
CD11b+ macrophages and microglia are the primary source of CCL2 in the GL261 model
To identify the cellular source of CCL2 in the GL261 model, immunofluorescence staining of tissue sections was performed at 1-week post-i.c. implantation of GL261 cells (Figure 2B). CCL2 immunoreactivity was detected in the vicinity of CD11b+ and Iba-1+ cells only in the context of GL261 brain tumors, but not in the brains of naïve mice. We performed intracellular cytokine staining and found that CCL2 expression was predominantly confined to CD45intCD11b+ microglia (~60% CCL2-positive) and CD45highCD11b+Ly-6G− macrophages (~70% CCL2-positive) (Figure 2C). In contrast, a low percentage of CD4+ T cells and CD11b+Ly-6G+ granulocytic MDSCs expressed CCL2 (~10% for both CD4+ T cells and granulocytic MDSCs) (Figure 2C). Given that CCL2 can be produced by myeloid cells stimulated with various polarizing conditions, we next determined the M1 or M2 status of glioma-associated microglia and macrophages in our model to identify candidate cytokines responsible for inducing CCL2 production in these cells (25). Microglia from GL261 tumors demonstrated an increased expression of Arginase-1 (Arg1) relative to microglia from PBS-injected control brains (Figure 2D). When compared to peripheral macrophages, glioma associated macrophages express a ~600 fold greater Arg1 mRNA level while glioma-associated microglia express a 60-fold greater Arg1 mRNA level (Figure 2E). Thus, the major sources of CCL2 in GL261 gliomas are Arg1-expressing glioma-associated macrophages and microglia.
A soluble GL261-derived factor induces CCL2 production from macrophages and microglia
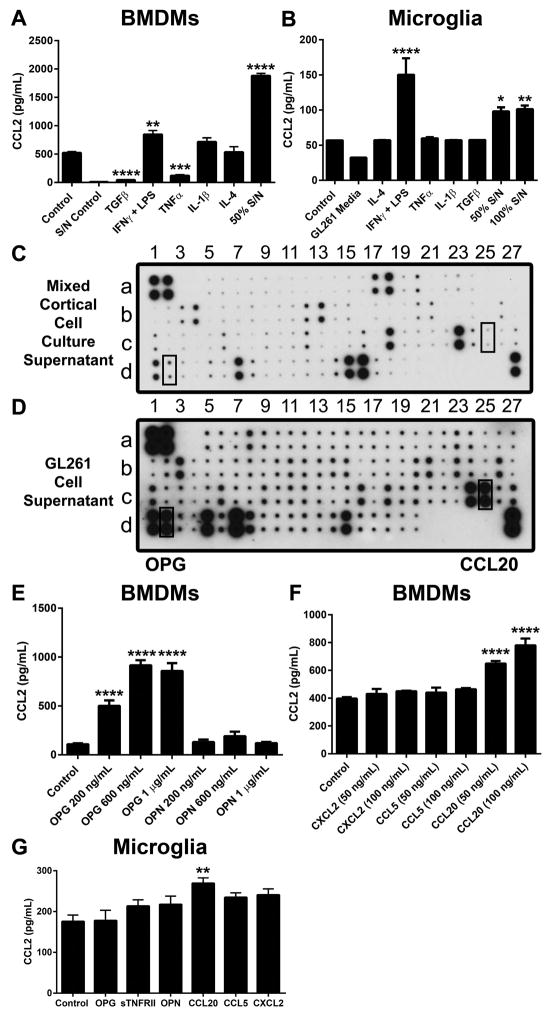
Since tumor-associated macrophages and microglia are major sources of CCL2, we hypothesized that GL261-derived factors induce CCL2 production from these cells. To test this hypothesis, we treated bone marrow-derived macrophages (BMDMs) and microglia isolated from mixed-cortical cell cultures (MCCC) with conditioned media from GL261 cells. GL261-conditioned media induced CCL2 production from both macrophages (1881 ± 40 ng/mL in conditioned media treated macrophages vs. 520 ± 23 ng/mL in control, P < 0.0001, mean ± SEM) and microglia (101.3 ± 5.1 ng/mL in conditioned media treated microglia vs. 56.9 ± 0.1 ng/mL in control, P < 0.01) as determined by ELISA (Figure 3A–3B). We also assessed the impact of cytokine stimuli on CCL2 production. LPS + IFNγ induced CCL2 production from BMDMs and microglia whereas CCL2 production from BMDMs was decreased after treatment with TGFβ or TNFα (42.8 ±3.9 ng/mL in TGFβ-treated BMDMs and 120.3 ± 15.7 ng/mL in TNFα-treated BMDMs, P < 0.001, mean ± SEM) (Figure 3A–3B). Collectively, these data suggest that soluble factors derived from GL261 cells induce CCL2 secretion from macrophages and microglia. Consequently, we performed antibody arrays using GL261 supernatant and MCCC supernatant to selectively identify tumor microenvironment-specific soluble factors (Figure 3C–3D and Supplementary Table S1). Using this approach, we identified osteoprotegerin (OPG), osteopontin (OPN), soluble TNF receptor type II (sTNFRII), CCL5, CCL20, and CXCL2. Among these candidate cytokines, only OPG and CCL20 were sufficient to induce CCL2 production in vitro (Figure 3E–3G). These data collectively suggest that factors secreted by glioma cells induce CCL2 expression in microglia and macrophages in a non-cell autonomous fashion.
Figure 3. Soluble tumor-derived factors induce CCL2 secretion by macrophages and microglia.
(A) Bone marrow-derived macrophages (BMDMs) were treated for 24 hours with cytokines or media containing 50% GL261 cell supernatant. Supernatant was collected after another 48 hours for CCL2 analysis by ELISA. S/N control denotes the CCL2 content in GL261 supernatant. (n = 3–6) (B) Microglia from neonatal mixed-cortical cell cultures (MCCC) were treated with the indicated cytokines or with media containing GL261 supernatant. (n = 3). (C–D) Mouse cytokine array from MCCC or GL261 supernatant. (E–F) CCL2 secretion from BMDMs treated with candidate cytokines/chemokines identified from the antibody arrays (n = 3–6). (G) CCL2 secretion from microglia treated with candidate cytokines/chemokines (n = 3). Data in A, B, E–G are representative of 3–4 independent experiments. Data are represented as mean ± SEM; *P < 0.05, **P < 0.01, ***P < 0.001, and ****P < 0.0001 by ordinary one-way ANOVA with Tukey’s multiple comparisons test.
GL261 tumors are infiltrated by CCR4+ Tregs and CCR2+ MDSCs
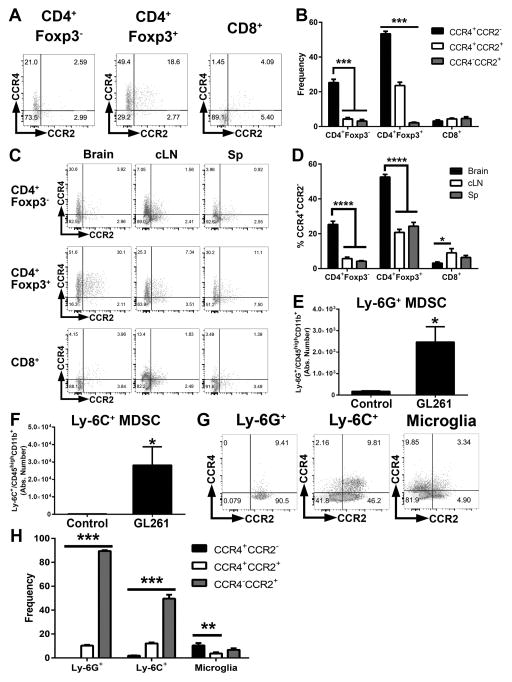
We next determined which cells in the glioma microenvironment express chemokine receptors recognizing CCL2. Flow cytometric analysis of GL261-bearing brains at 1 week post-tumor implantation found that CCR4 was expressed by 60% CD3+CD4+Foxp3+ Tregs, while CCR2 was localized to CD3−CD45+CD11c−CD11b+ MDSC populations (Figure 4A and Supplementary Figure S3). In contrast, CD8+ T cells did not express high percentages of either CCR4 or CCR2 (Figure 4A–4B). The highest percentages of CCR4+ Tregs were observed in the brain compared to cervical lymph nodes (cLNs) or the spleen, suggesting that the accumulation of CCR4+ Tregs is specific to brain tumors (Figure 4C–4D). Both MDSC subtypes accumulated in the brain at 1 week post-i.c. GL261 implantation and are virtually absent in PBS-injected controls (Figure 4E–4F). Both tumor-infiltrating granulocytic Ly-6G+ MDSCs and monocytic Ly-6C+ MDSCs expressed CCR2 (Figure 4G–4H). In contrast, CD45intCD11b+ microglia expressed minimal CCR2 or CCR4. In total, these results suggest that both Treg and MDSC populations possess chemokine receptors required for responding to CCL2 in the glioma microenvironment.
Figure 4. GL261 tumors are infiltrated by CCR4-expressing Tregs and CCR2-expressing MDSCs.
(A–B) Flow cytometric quantification of CCR4 and CCR2 expression among CD4+Foxp3− T cells, CD4+Foxp3+ Tregs, and CD8+ T cells (n = 5). (C–D) Quantification of CCR4 and CCR2 expression on T cell subsets in brain compared to cervical lymph nodes and spleen (E–F) Absolute numbers of CD11b+Ly-6G+ and CD11b+Ly-6C+ cells in the brains of tumor bearing or PBS-injected mice (n = 5). (G) CCR4 and CCR2 expression in MDSC subsets and microglia. (H) Quantification of frequencies in G (n = 5). Data are representative of at least 4 independent experiments. Data are represented as mean ± SEM; *P < 0.05, **P < 0.01, ***P < 0.001, and ****P < 0.0001 by ordinary one-way ANOVA with Tukey’s multiple comparisons test in B, D, and H or Student’s t test in E–F. cLN, cervical lymph nodes. Sp, spleen.
Tregs and Ly-6C+ monocytic MDSCs fail to maximally accumulate in the glioma microenvironment in the absence of CCL2
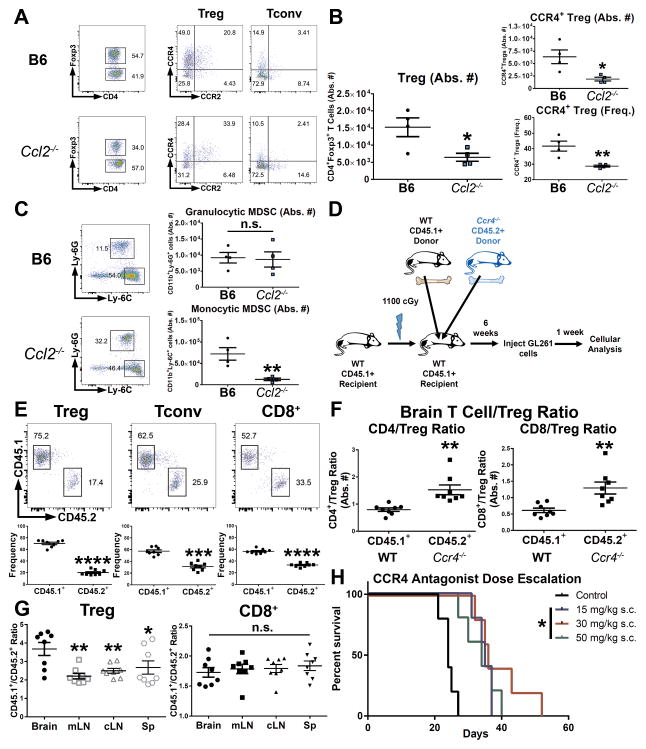
To delineate the requirement for CCL2 for the trafficking of Tregs and MDSCs to the tumor microenvironment, we implanted GL261 cells into Ccl2−/− mice and analyzed the brain tumor infiltrate at 1 week post-implantation. In the absence of CCL2, fewer Tregs (wild-type B6 ~1.52 × 10⁴, Ccl2−/− ~6.46 × 10³, P = 0.0260, mean absolute numbers of CD3+CD4+Foxp3+ Tregs) and monocytic Ly-6C+ MDSCs (wild-type B6 ~7.21 × 10⁴, Ccl2−/− ~1.26 × 10⁴, P = 0.0072, mean absolute numbers of CD45highCD11c−CD11b+Ly-6C+ monocytic MDSCs) infiltrated the brain tumor in terms of absolute numbers (Figure 5A–5B). Interestingly, the number of infiltrating granulocytic Ly-6G+ MDSCs remained unchanged despite the lack of CCL2 (Figure 5C). These results indicate that both Tregs and monocytic MDSCs (but not granulocytic MDSCs) require CCL2 for maximal recruitment to gliomas. In addition, these results further support our finding that the glioma microenvironment is the primary source of CCL2, since the GL261 cells implanted into Ccl2−/− were CCL2-competent.
Figure 5. Mechanistic requirements of CCL2 and CCR4 for trafficking to glioma.
(A–B) Treg infiltration at 1 week post-i.c. GL261 in wild-type C57BL/6 (B6) or Ccl2−/− mice. (n = 4). (C) MDSC infiltration in brain tumors of wild-type B6 mice or Ccl2−/− mice. (D) Schematic of mixed-bone marrow chimera (BMC) experiments using wild-type CD45.1+ and CD45.2+ Ccr4−/− marrow. (E) Flow cytometric analysis of BMC experiments of WT vs. Ccr4−/− cells within the T cell compartment. (n = 8) (F) CD4/Treg ratio and CD8/Treg ratio within CCR4-deficient cells or wild-type cells in brain tumor-bearing chimeric mice (n = 8). (G) CD45.1+/CD45.2+ cell ratios in Treg or CD8+ T cell compartments across tissues in brain tumor-bearing chimeric mice (n = 8). (H) End-point analysis of mice implanted with GL261 cells and treated on alternating days with indicated doses of CCR4 antagonist (C 021) for a total of 5 doses. Data are representative of 2–3 independent experiments. Data are represented as mean ± SEM; *P < 0.05, **P < 0.01, ***P < 0.001, and ****P < 0.0001 by Student’s t test in B,C, E, F or ordinary one-way ANOVA with Tukey’s multiple comparisons test in G. Kaplan-Meier survival curves were compared with the Log-rank test with the Bonferroni method for multiple comparisons.
Tregs are disproportionately dependent on CCR4 for trafficking to glioma in comparison to effector T cells
Given CCR4 expression on Tregs and CD4+Foxp3− T cells, we next determined the requirement for CCR4 for brain tumor trafficking. We generated mixed-bone marrow chimeras using bone marrow from wild-type CD45.1+ and CD45.2+ Ccr4−/− mice, injected the chimeras with GL261 cells, and analyzed the tissues after 1 week (Figure 5D). A slight deficiency was observed across all T cell populations within CD45.2+ cells in the brain: Treg (CD45.1+ WT 70.32 vs. CD45.2+ Ccr4−/− 20.23, P < 0.0001, mean frequency), CD4+Foxp3− (CD45.1+ WT 57.34 vs. CD45.2+ Ccr4−/− 31.17, P < 0.001), and CD8+ (CD45.1+ WT 56.45 vs. CD45.2+ Ccr4−/− 33.20, P < 0.0001) (Figure 5E). However, Treg accumulation in the brain was disproportionately affected by the absence of CCR4, as both CD4+Foxp3− T cell/Treg ratios (CD45.1+ WT 0.79 vs. CD45.2+ Ccr4−/− 1.53, P = 0.0025, absolute number ratio) and CD8+ T cell/Treg ratios (CD45.1+ WT 0.61 vs. CD45.2+ Ccr4−/− 1.29, P = 0.0018, absolute number ratio) were higher in CD45.1+ cells compared to CCR4-deficient CD45.2+ cells (Figure 5F). CCR4 deficiency had the greatest impact on Treg accumulation in the brain, as the ratio of CD45.1+/CD45.2+ cells was significantly higher among brain tumor-infiltrating Tregs compared to mesenteric lymph nodes (mLNs), cLNs, and spleen (Figure 5G). In contrast, the CD45.1+/CD45.2+ ratio among CD8+ T cells was similar across tissues (Figure 5G). Monocytic Ly-6C+ MDSCs were not affected by CCR4 deficiency and granulocytic Ly-6G+ MDSC numbers were only marginally affected (Supplementary Figure S4). Taken together, these results suggest that CCR4 plays a role in the trafficking of T cells to the brain, but is selectively relevant to the recruitment of brain tumor-infiltrating Tregs.
The CCL2-CCR4 chemokine-chemokine receptor interaction is a potential therapeutic target in glioma
We next hypothesized that targeting the CCL2-CCR4 interaction would decrease Treg recruitment in brain tumors. We first assessed the specificity and activity of the small molecule CCR4 antagonist C 021 in vitro. C 021 treatment abrogated Treg chemotaxis to the CCR4 cognate chemokines CCL17 and CCL22 but did not affect Treg migration to RPMI containing 10% FBS and CCL21 (Supplementary Figure S5A–B). To determine the in vivo activity of C 021, we treated GL261-implanted mice with 15 mg/kg C 021 administered by subcutaneous injection every other day for five total doses. C 021-treated mice gained a 30% improvement in median survival over vehicle control-treated mice with a commensurate decrease of CCR4+ Tregs and Ly-6G+ MDSCs while infiltrating CD4+ and CD8+ T cells were increased (Supplementary Figure S6A–6G). In addition, both CD4:Treg and CD8:Treg ratios were improved in C 021-treated mice (Supplementary Figure S6H–I). Furthermore, dose escalation experiments revealed that 15 mg/kg C 021 was sufficient to improve overall survival (Figure 5H). Thus, the CCR4 chemokine inhibitor selectively inhibits Treg accumulation with the benefit of improved median survival.
Monocytic Ly-6C+ MDSCs that lack CCR2 do not accumulate in glioma
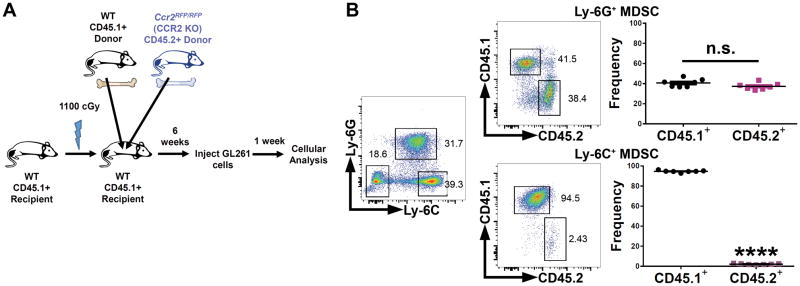
Since CCR2 expression was largely localized to MDSCs, we performed a similar mixed-bone marrow chimera competition assay using wild-type CD45.1+ bone marrow and CD45.2+ CCR2-deficient bone marrow (Ccr2RFP/RFP) (Figure 6A) (26). Within the CD45.2+ CCR2-deficient department, we observed an almost complete lack of Ly-6C+ monocytic MDSCs (Figure 6B). Ly-6G+ granulocytic MDSCs were unaffected by the absence of CCR2 in terms of trafficking to the brain tumor. Therefore, monocytic Ly-6C+ MDSCs require CCR2 in order for their ultimate accumulation in the GL261 tumors.
Figure 6. Ly-6C+ monocytic MDSCs require CCR2 for accumulation in glioma.
(A) Schematic of mixed-bone marrow chimera experiments using wild-type CD45.1+ and CD45.2+ Ccr2RFP/RFP (CCR2-deficient) marrow. (B) Wild-type CD45.1+ or CCR2-deficient CD45.2+ glioma-infiltrating MDSC subsets in brain tumor-bearing chimeric mice (n = 7). Data are representative of at least 2 independent experiments. Data are represented as mean ± SEM; *P < 0.05, **P < 0.01, ***P < 0.001, and ****P < 0.0001 by Student’s t test.
DISCUSSION
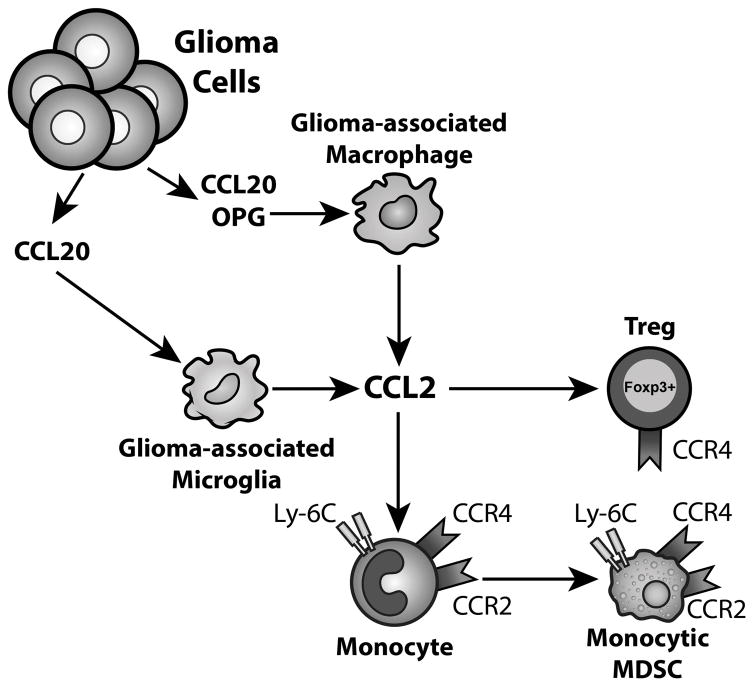
The immunosuppressive tumor microenvironment remains a major obstacle that impedes productive anti-tumor immune responses. Here, we have dissected a novel mechanism for Treg and MDSC recruitment that begins with tumor-derived CCL20 and osteoprotegerin inducing CCL2 production from glioma-associated macrophages and microglia. This mechanistic axis illustrates the potential of macrophages as an additional source of CCL2 in GBM patients. In the tumor microenvironment, astrocytoma cells are not only capable of producing CCL2 themselves but are also able to induce glioma-associated myeloid cells to secrete CCL2. Importantly, tumor-derived CCL2 and macrophage-derived CCL2 are not necessarily mutually exclusive possibilities. CCL2 then recruits Tregs and MDSCs through CCR4 and CCR2, respectively, as major contributors to the potently immunosuppressive glioma microenvironment.
The pro-tumorigenic or anti-tumorigenic effects of CCL2 are heavily context-dependent. CCL2-mediated recruitment of MDSCs, monocytes, and macrophages supports colorectal carcinogenesis, endometrial cancer growth, and breast cancer metastasis (27–29). However, anti-CD40 agonist treatment induces CCL2-recruited monocytes degrade fibrosis in an IFNγ-dependent manner, improving gemcitabine efficacy in pancreatic carcinoma (30). CCL2 can also recruit functional antigen-presenting cells in the context of chemotherapy, in which immunogenic cell death is likely to be of major importance (31). Thus, tumors with high amounts of CCL2 may be poised for the induction of a productive immune response if sufficient IFNγ or strongly immunogenic cell death can be induced. In the absence of such initiation, the monocytes and macrophages recruited by CCL2 instead contribute to the immunosuppressive microenvironment together with Tregs trafficking in response to CCL2.
In our mixed-bone marrow chimera studies, we observed some reduction across Treg, CD4+Foxp3−, and CD8+ T cell populations within the CD45.2+ Ccr4−/− cells compared to CD45.1+ wild-type cells. Interestingly, this may reflect a minor role for CCR4 in an earlier developmental stage. Aire-dependent expression of CCR4 has been shown to occur during the development of multiple αβ T cell lineages in the thymus, although CCR4 was not unanimously found to be required for T cell development in these studies (32,33). Thus, CCR4 may play a role in the T cell lineage at the common lymphocyte progenitor stage, during thymic emigration, or even at the level of systemic circulation.
Our observation that MDSC accumulation did not occur in the CCR2-deficient cell compartment parallels other findings that CCR2 deficiency impairs circulating monocyte-dendritic cell progenitors and monocyte progenitors (34). While our analysis does not absolutely decouple the requirement of CCR2 for monocyte trafficking/MDSC trafficking to glioma from that of an earlier monocyte progenitor role, it does confirm a role for CCR2 in the accumulation of glioma-infiltrating monocytic Ly-6C+ MDSCs. Furthermore, differential MDSC subset sensitivity to both CCL2 and CCR2-deficiency is meaningful given that the monocytic MDSC lineage was recently identified as more immunosuppressive in EG7, Lewis lung carcinoma, and B16 tumors (35). Therefore, further characterization of MDSCs in GBM patients remains an area of considerable interest.
The therapeutic benefit of CCR4 inhibition highlights the potential for other modalities of targeting CCR4, such as with therapeutic antibodies. Mogamulizumab, a defucosylated humanized CCR4 antibody with demonstrated efficacy in T cell lymphomas, has been adapted for targeting Tregs in solid tumors in a Phase Ia clinical trial (36–38). CCR4/2 targeting is likely to be most effective in combination with immunotherapeutic approaches that activate the effector response, such as checkpoint blockade or vaccination in order to overcome immunosuppression at the tumor site while preventing the additional recruitment of immunosuppressive cells.
CCL2 is likely part of a larger gene expression signature that determines the presence of tumor-infiltrating lymphocyte (TIL)/MDSC/Treg infiltration in GBM (39–43). As the emphasis on translating immunotherapy for GBM patients continues to be a priority, identifying factors underlying Treg, MDSC, and TIL recruitment in brain tumors is vital for the strategic disarming of critical immune evasion pathways. Our findings highlight the impact of microenvironment-derived CCL2 in the accumulation of immunosuppressive cells and provide additional critical insight into the barriers that must be overcome for the successful translation of immunotherapies to treat GBM.
Supplementary Material
Figure 7. A model describing the CCL2-CCR4/2 axis in GBM.
Glioma-derived CCL20 and OPG induces the production of CCL2 from glioma-associated macrophages and microglia. CCL2 recruits CCR4-expressing Tregs and CCR2-expressing monocytes to GBM. These monocytes then differentiate into CCR2+ MDSCs.
Acknowledgments
This work was supported by: NIH NCI R01CA122930 and NINDS R01NS093903 (M.S. Lesniak), NIH NINDS F31NS086365 (A.L. Chang), NIH NCI T32CA009594 (UChicago, A.L. Chang)
The authors thank the Human Tissue Resource Center and the Flow Cytometry Core Facility at the University of Chicago as well as the Northwestern University Nervous System Tumor Bank for technical assistance. We thank Dr. Irina Balyasnikova for helpful comments on the manuscript, Dr. Peter Pytel for pathology scoring, and Dr. Craig Horbinski for pathology scoring and double-immunofluorescence labeling expertise. Finally, the authors thank the TCGA Research Network for GBM patient data availability.
Footnotes
The authors have declared that no conflict of interest exists.
References
- 1.Hanahan D, Weinberg RA. Hallmarks of cancer: the next generation. Cell. 2011;144:646–74. doi: 10.1016/j.cell.2011.02.013. [DOI] [PubMed] [Google Scholar]
- 2.Rudensky AY. Regulatory T cells and Foxp3. Immunol Rev. 2011;241:260–8. doi: 10.1111/j.1600-065X.2011.01018.x. [DOI] [PMC free article] [PubMed] [Google Scholar]
- 3.Curiel TJ, Coukos G, Zou L, Alvarez X, Cheng P, Mottram P, et al. Specific recruitment of regulatory T cells in ovarian carcinoma fosters immune privilege and predicts reduced survival. Nat Med. 2004;10:942–9. doi: 10.1038/nm1093. [DOI] [PubMed] [Google Scholar]
- 4.Bates GJ, Fox SB, Han C, Leek RD, Garcia JF, Harris AL, et al. Quantification of regulatory T cells enables the identification of high-risk breast cancer patients and those at risk of late relapse. J Clin Oncol. 2006;24:5373–80. doi: 10.1200/JCO.2006.05.9584. [DOI] [PubMed] [Google Scholar]
- 5.Ichihara F, Kono K, Takahashi A, Kawaida H, Sugai H, Fujii H. Increased populations of regulatory T cells in peripheral blood and tumor-infiltrating lymphocytes in patients with gastric and esophageal cancers. Clin Cancer Res. 2003;9:4404–8. [PubMed] [Google Scholar]
- 6.Gabrilovich DI, Nagaraj S. Myeloid-derived suppressor cells as regulators of the immune system. Nat Rev Immunol. 2009;9:162–74. doi: 10.1038/nri2506. [DOI] [PMC free article] [PubMed] [Google Scholar]
- 7.Khaled YS, Ammori BJ, Elkord E. Myeloid-derived suppressor cells in cancer: recent progress and prospects. Immunol Cell Biol. 2013;91:493–502. doi: 10.1038/icb.2013.29. [DOI] [PubMed] [Google Scholar]
- 8.Stupp R, Mason WP, van den Bent MJ, Weller M, Fisher B, Taphoorn MJ, et al. Radiotherapy plus concomitant and adjuvant temozolomide for glioblastoma. N Engl J Med. 2005;352:987–96. doi: 10.1056/NEJMoa043330. [DOI] [PubMed] [Google Scholar]
- 9.Heimberger AB, Abou-Ghazal M, Reina-Ortiz C, Yang DS, Sun W, Qiao W, et al. Incidence and prognostic impact of FoxP3+ regulatory T cells in human gliomas. Clin Cancer Res. 2008;14:5166–72. doi: 10.1158/1078-0432.CCR-08-0320. [DOI] [PubMed] [Google Scholar]
- 10.El Andaloussi A, Lesniak MS. CD4+ CD25+ FoxP3+ T-cell infiltration and heme oxygenase-1 expression correlate with tumor grade in human gliomas. J Neurooncol. 2007;83:145–52. doi: 10.1007/s11060-006-9314-y. [DOI] [PubMed] [Google Scholar]
- 11.Crane CA, Ahn BJ, Han SJ, Parsa AT. Soluble factors secreted by glioblastoma cell lines facilitate recruitment, survival, and expansion of regulatory T cells: implications for immunotherapy. Neuro Oncol. 2012;14:584–95. doi: 10.1093/neuonc/nos014. [DOI] [PMC free article] [PubMed] [Google Scholar]
- 12.Raychaudhuri B, Rayman P, Ireland J, Ko J, Rini B, Borden EC, et al. Myeloid-derived suppressor cell accumulation and function in patients with newly diagnosed glioblastoma. Neuro Oncol. 2011;13:591–9. doi: 10.1093/neuonc/nor042. [DOI] [PMC free article] [PubMed] [Google Scholar]
- 13.Perng P, Lim M. Immunosuppressive Mechanisms of Malignant Gliomas: Parallels at Non-CNS Sites. Front Oncol. 2015;5:153. doi: 10.3389/fonc.2015.00153. [DOI] [PMC free article] [PubMed] [Google Scholar]
- 14.Fecci PE, Mitchell DA, Whitesides JF, Xie W, Friedman AH, Archer GE, et al. Increased regulatory T-cell fraction amidst a diminished CD4 compartment explains cellular immune defects in patients with malignant glioma. Cancer Res. 2006;66:3294–302. doi: 10.1158/0008-5472.CAN-05-3773. [DOI] [PubMed] [Google Scholar]
- 15.Fujita M, Kohanbash G, Fellows-Mayle W, Hamilton RL, Komohara Y, Decker SA, et al. COX-2 blockade suppresses gliomagenesis by inhibiting myeloid-derived suppressor cells. Cancer Res. 2011;71:2664–74. doi: 10.1158/0008-5472.CAN-10-3055. [DOI] [PMC free article] [PubMed] [Google Scholar]
- 16.Jordan JT, Sun W, Hussain SF, DeAngulo G, Prabhu SS, Heimberger AB. Preferential migration of regulatory T cells mediated by glioma-secreted chemokines can be blocked with chemotherapy. Cancer Immunol Immunother. 2008;57:123–31. doi: 10.1007/s00262-007-0336-x. [DOI] [PMC free article] [PubMed] [Google Scholar]
- 17.Zlotnik A, Yoshie O. The chemokine superfamily revisited. Immunity. 2012;36:705–16. doi: 10.1016/j.immuni.2012.05.008. [DOI] [PMC free article] [PubMed] [Google Scholar]
- 18.Lesokhin AM, Hohl TM, Kitano S, Cortez C, Hirschhorn-Cymerman D, Avogadri F, et al. Monocytic CCR2(+) myeloid-derived suppressor cells promote immune escape by limiting activated CD8 T-cell infiltration into the tumor microenvironment. Cancer Res. 2012;72:876–86. doi: 10.1158/0008-5472.CAN-11-1792. [DOI] [PMC free article] [PubMed] [Google Scholar]
- 19.Wainwright DA, Balyasnikova IV, Chang AL, Ahmed AU, Moon KS, Auffinger B, et al. IDO expression in brain tumors increases the recruitment of regulatory T cells and negatively impacts survival. Clin Cancer Res. 2012;18:6110–21. doi: 10.1158/1078-0432.CCR-12-2130. [DOI] [PMC free article] [PubMed] [Google Scholar]
- 20.Witting A, Moller T. Microglia cell culture: a primer for the novice. Methods Mol Biol. 2011;758:49–66. doi: 10.1007/978-1-61779-170-3_4. [DOI] [PubMed] [Google Scholar]
- 21.Ransohoff RM, Hamilton TA, Tani M, Stoler MH, Shick HE, Major JA, et al. Astrocyte expression of mRNA encoding cytokines IP-10 and JE/MCP-1 in experimental autoimmune encephalomyelitis. FASEB J. 1993;7:592–600. doi: 10.1096/fasebj.7.6.8472896. [DOI] [PubMed] [Google Scholar]
- 22.Carrillo-de Sauvage MA, Gomez A, Ros CM, Ros-Bernal F, Martin ED, Perez-Valles A, et al. CCL2-expressing astrocytes mediate the extravasation of T lymphocytes in the brain. Evidence from patients with glioma and experimental models in vivo. PLoS One. 2012;7:e30762. doi: 10.1371/journal.pone.0030762. [DOI] [PMC free article] [PubMed] [Google Scholar]
- 23.Leung SY, Wong MP, Chung LP, Chan AS, Yuen ST. Monocyte chemoattractant protein-1 expression and macrophage infiltration in gliomas. Acta Neuropathol. 1997;93:518–27. doi: 10.1007/s004010050647. [DOI] [PubMed] [Google Scholar]
- 24.Heimdal JH, Olsnes C, Olofsson J, Aarstad HJ. Monocyte and monocyte-derived macrophage secretion of MCP-1 in co-culture with autologous malignant and benign control fragment spheroids. Cancer Immunol Immunother. 2001;50:300–6. doi: 10.1007/s002620100204. [DOI] [PMC free article] [PubMed] [Google Scholar]
- 25.Cai J, Zhang W, Yang P, Wang Y, Li M, Zhang C, et al. Identification of a 6-cytokine prognostic signature in patients with primary glioblastoma harboring M2 microglia/macrophage phenotype relevance. PLoS One. 2015;10:e0126022. doi: 10.1371/journal.pone.0126022. [DOI] [PMC free article] [PubMed] [Google Scholar]
- 26.Saederup N, Cardona AE, Croft K, Mizutani M, Cotleur AC, Tsou CL, et al. Selective chemokine receptor usage by central nervous system myeloid cells in CCR2-red fluorescent protein knock-in mice. PLoS One. 2010;5:e13693. doi: 10.1371/journal.pone.0013693. [DOI] [PMC free article] [PubMed] [Google Scholar]
- 27.Chun E, Lavoie S, Michaud M, Gallini CA, Kim J, Soucy G, et al. CCL2 Promotes Colorectal Carcinogenesis by Enhancing Polymorphonuclear Myeloid-Derived Suppressor Cell Population and Function. Cell Rep. 2015;12:244–57. doi: 10.1016/j.celrep.2015.06.024. [DOI] [PMC free article] [PubMed] [Google Scholar]
- 28.Kitamura T, Qian BZ, Soong D, Cassetta L, Noy R, Sugano G, et al. CCL2-induced chemokine cascade promotes breast cancer metastasis by enhancing retention of metastasis-associated macrophages. J Exp Med. 2015;212:1043–59. doi: 10.1084/jem.20141836. [DOI] [PMC free article] [PubMed] [Google Scholar]
- 29.Pena CG, Nakada Y, Saatcioglu HD, Aloisio GM, Cuevas I, Zhang S, et al. LKB1 loss promotes endometrial cancer progression via CCL2-dependent macrophage recruitment. J Clin Invest. 2015;125:4063–76. doi: 10.1172/JCI82152. [DOI] [PMC free article] [PubMed] [Google Scholar]
- 30.Long KB, Gladney WL, Tooker GM, Graham K, Fraietta JA, Beatty GL. IFNgamma and CCL2 Cooperate to Redirect Tumor-Infiltrating Monocytes to Degrade Fibrosis and Enhance Chemotherapy Efficacy in Pancreatic Carcinoma. Cancer Discov. 2016;6:400–13. doi: 10.1158/2159-8290.CD-15-1032. [DOI] [PMC free article] [PubMed] [Google Scholar]
- 31.Ma Y, Mattarollo SR, Adjemian S, Yang H, Aymeric L, Hannani D, et al. CCL2/CCR2-dependent recruitment of functional antigen-presenting cells into tumors upon chemotherapy. Cancer Res. 2014;74:436–45. doi: 10.1158/0008-5472.CAN-13-1265. [DOI] [PubMed] [Google Scholar]
- 32.Cowan JE, McCarthy NI, Parnell SM, White AJ, Bacon A, Serge A, et al. Differential requirement for CCR4 and CCR7 during the development of innate and adaptive alphabetaT cells in the adult thymus. J Immunol. 2014;193:1204–12. doi: 10.4049/jimmunol.1400993. [DOI] [PMC free article] [PubMed] [Google Scholar]
- 33.Laan M, Kisand K, Kont V, Moll K, Tserel L, Scott HS, et al. Autoimmune regulator deficiency results in decreased expression of CCR4 and CCR7 ligands and in delayed migration of CD4+ thymocytes. J Immunol. 2009;183:7682–91. doi: 10.4049/jimmunol.0804133. [DOI] [PMC free article] [PubMed] [Google Scholar]
- 34.Yona S, Kim KW, Wolf Y, Mildner A, Varol D, Breker M, et al. Fate mapping reveals origins and dynamics of monocytes and tissue macrophages under homeostasis. Immunity. 2013;38:79–91. doi: 10.1016/j.immuni.2012.12.001. [DOI] [PMC free article] [PubMed] [Google Scholar]
- 35.Haverkamp JM, Smith AM, Weinlich R, Dillon CP, Qualls JE, Neale G, et al. Myeloid-derived suppressor activity is mediated by monocytic lineages maintained by continuous inhibition of extrinsic and intrinsic death pathways. Immunity. 2014;41:947–59. doi: 10.1016/j.immuni.2014.10.020. [DOI] [PMC free article] [PubMed] [Google Scholar]
- 36.Ogura M, Ishida T, Hatake K, Taniwaki M, Ando K, Tobinai K, et al. Multicenter phase II study of mogamulizumab (KW-0761), a defucosylated anti-cc chemokine receptor 4 antibody, in patients with relapsed peripheral T-cell lymphoma and cutaneous T-cell lymphoma. J Clin Oncol. 2014;32:1157–63. doi: 10.1200/JCO.2013.52.0924. [DOI] [PubMed] [Google Scholar]
- 37.Duvic M, Pinter-Brown LC, Foss FM, Sokol L, Jorgensen JL, Challagundla P, et al. Phase 1/2 study of mogamulizumab, a defucosylated anti-CCR4 antibody, in previously treated patients with cutaneous T-cell lymphoma. Blood. 2015;125:1883–9. doi: 10.1182/blood-2014-09-600924. [DOI] [PMC free article] [PubMed] [Google Scholar]
- 38.Kurose K, Ohue Y, Wada H, Iida S, Ishida T, Kojima T, et al. Phase Ia Study of FoxP3+ CD4 Treg Depletion by Infusion of a Humanized Anti-CCR4 Antibody, KW-0761, in Cancer Patients. Clin Cancer Res. 2015;21:4327–36. doi: 10.1158/1078-0432.CCR-15-0357. [DOI] [PubMed] [Google Scholar]
- 39.Thomas AA, Fisher JL, Rahme GJ, Hampton TH, Baron U, Olek S, et al. Regulatory T cells are not a strong predictor of survival for patients with glioblastoma. Neuro Oncol. 2015;17:801–9. doi: 10.1093/neuonc/nou363. [DOI] [PMC free article] [PubMed] [Google Scholar]
- 40.Sayour EJ, McLendon P, McLendon R, De Leon G, Reynolds R, Kresak J, et al. Increased proportion of FoxP3+ regulatory T cells in tumor infiltrating lymphocytes is associated with tumor recurrence and reduced survival in patients with glioblastoma. Cancer Immunol Immunother. 2015;64:419–27. doi: 10.1007/s00262-014-1651-7. [DOI] [PMC free article] [PubMed] [Google Scholar]
- 41.Yue Q, Zhang X, Ye HX, Wang Y, Du ZG, Yao Y, et al. The prognostic value of Foxp3+ tumor-infiltrating lymphocytes in patients with glioblastoma. J Neurooncol. 2014;116:251–9. doi: 10.1007/s11060-013-1314-0. [DOI] [PMC free article] [PubMed] [Google Scholar]
- 42.Rutledge WC, Kong J, Gao J, Gutman DA, Cooper LA, Appin C, et al. Tumor-infiltrating lymphocytes in glioblastoma are associated with specific genomic alterations and related to transcriptional class. Clin Cancer Res. 2013;19:4951–60. doi: 10.1158/1078-0432.CCR-13-0551. [DOI] [PMC free article] [PubMed] [Google Scholar]
- 43.Han S, Zhang C, Li Q, Dong J, Liu Y, Huang Y, et al. Tumour-infiltrating CD4(+) and CD8(+) lymphocytes as predictors of clinical outcome in glioma. Br J Cancer. 2014;110:2560–8. doi: 10.1038/bjc.2014.162. [DOI] [PMC free article] [PubMed] [Google Scholar]
Associated Data
This section collects any data citations, data availability statements, or supplementary materials included in this article.


