

Abstract
Background
About half of US states currently require radiology facilities to disclose mammographic breast density to women, often with language recommending discussion of supplemental screening options for women with dense breasts.
Objective
To examine variation in breast density assessment across radiologists in clinical practice.
Design
Cross-sectional and longitudinal analyses of prospectively collected observational data.
Setting
Thirty radiology facilities within the three breast cancer screening research centers of the Population-based Research Optimizing Screening through Personalized Regimens (PROSPR) consortium.
Participants
Radiologists who interpreted ≥500 screening mammograms during 2011–2013 (N=83). Data on 216,783 screening mammograms from 145,123 woman aged 40–89 years were included.
Measurements
Mammographic breast density as clinically recorded using the four Breast Imaging-Reporting and Data System density categories (heterogeneously dense and extremely dense categories were considered “dense” for analyses); patient age, race, and body mass index (BMI).
Results
Overall, 36.9% of mammograms were rated as dense. Across radiologists, this percentage ranged from 6.3% to 84.5% (median 38.7%, interquartile range 22.0%), with multivariable adjustment for patient characteristics having little impact (interquartile range 20.9%). Examination of patient subgroups revealed that variation in density assessment across radiologists was pervasive in all but the most extreme patient age and BMI combinations. Among women undergoing consecutive exams interpreted by different radiologists, 17.2% (5,909/34,271) had discordant assessments of dense/non-dense status.
Limitations
Quantitative measures of mammographic breast density were not available for comparison.
Conclusions
There is wide variation in density assessment across radiologists that should be carefully considered by providers and policy makers when considering supplemental screening strategies. The likelihood of a woman being told she has dense breasts varies substantially according to which radiologist interprets her mammogram.
Funding Source
National Institutes of Health
INTRODUCTION
Mammographic breast density impairs mammography performance and is also an independent risk factor for developing breast cancer (1, 2). To ensure that women with dense breasts are aware of the limitations of mammography and their increased breast cancer risk, about half of US states currently have passed legislation mandating the disclosure of breast density directly to women (3). In many states these notifications are required to include language advising the woman to discuss supplemental screening tests with her providers if her breasts are considered to be dense (4, 5). National legislation is currently under consideration (6) and the Food and Drug Administration is also considering an amendment to its regulations issued under the Mammography Quality Standards Act that would require density reporting to patients (7).
These legislative and regulatory initiatives have generated controversy because of the large number of women affected and the lack of evidence or consensus in the medical community regarding appropriate supplemental screening strategies for women with dense breasts. Approximately 40% of US women aged 40–74 have dense breast tissue based on mammographic assessment (8). Ultrasound, digital breast tomosynthesis, and magnetic resonance imaging have been proposed as screening options for women with dense breasts, but there is limited evidence to support the comparative effectiveness of these approaches for an indication of breast density alone (9).
An additional prominent concern with breast density legislation is the subjective nature of breast density assessment as routinely practiced clinically (10). Radiologists classify the visual appearance of the overall breast composition on a mammogram using the Breast Imaging-Reporting and Data System (BI-RADS) lexicon (11, 12), which includes four categories: almost entirely fatty, scattered fibroglandular density, heterogeneously dense, or extremely dense, with the latter two categories considered “dense” in existing legislation. Prior studies using test sets or consecutive mammograms have reported substantial intra- and inter-rater variability in radiologists’ measurements of BI-RADS breast density, with kappa statistics ranging from 0.4–0.7 (13–17). The impact of this variability on the distribution of mammographic breast density measurements in clinical practice is not clear, particularly in relation to individual patient determinants of breast density such as age and body mass index (8).
We sought to examine variation in the distribution of breast density assessments across radiologists as recorded in clinical practice, while accounting for patient factors known to be associated with breast density. We used data from thirty radiology facilities within the three breast cancer screening research centers of the Population-based Research Optimizing Screening through Personalized Regimens (PROSPR) consortium. Our results inform debates regarding the appropriateness of relying on subjective breast density assessment in clinical decision-making and have implications for personalized screening recommendations, while also providing comparison data for radiologists to assess how their density assessment practice compares to their peers.
METHODS
Setting
This study was conducted as part of the National Cancer Institute-funded PROSPR consortium. The overall aim of PROSPR is to conduct multi-site, coordinated, transdisciplinary research to evaluate and improve cancer screening processes. The ten PROSPR Research Centers reflect the diversity of US delivery system organizations (18). We used data from the three PROSPR breast cancer screening research centers: an integrated healthcare delivery system affiliated with the University of Pennsylvania; a statewide mammography and pathology registry housed at the University of Vermont; and primary care practice networks in two states affiliated with the Dartmouth-Hitchcock Health system in New Hampshire and Brigham and Women’s Hospital in Massachusetts.
Study design
We conducted an observational study using prospectively collected data from routine clinical practice. No interventions or training related to breast density assessment were introduced as part of the study. Each PROPSR breast cancer screening research center collects comprehensive clinical data on breast cancer screening among its catchment population. In total, the three centers capture mammography data from thirty radiology facilities. Cross-sectional and longitudinal analyses of the observational data were performed, as detailed below. All activities were approved by the institutional review boards at each PROSPR research center and the PROSPR Statistical Coordinating Center.
Participants and Mammograms
We identified all records of screening mammography conducted during 2011–2013 among women 40–89 years of age (N=269,741 screening mammography examinations). The study period was prior to any enactment of density notification legislation in the four included states. Eligible mammography exams were restricted to screening exams based on two requirements: 1) indication for exam was screening (as provided by the radiology facility); and 2) no breast imaging within the three months prior to the exam (to avoid inclusion of diagnostic exams that may have been miscoded as screening exams). Exclusion criteria were then applied, including: mammograms missing a breast density assessment (N=31,232), mammograms conducted among women with a personal history of breast cancer (N=9,337), mammograms missing a radiologist ID (N=5,629), and mammograms interpreted by radiologists who read fewer than 500 screening mammograms included in the database during the study period (N=6,760 exams among 48 radiologists). From an initial sample including 171,549 women with screening mammograms during 2011–2013, the final sample included 145,123 women.
Data Collection
Common data elements to ascertain patient characteristics and mammography exam data were developed by the PROSPR research centers and Statistical Coordinating Center. Patient characteristics (including age, race, body mass index [BMI], and prior history of breast cancer) at the time of the mammogram were obtained via a radiology clinic patient questionnaire (at UPenn and Vermont facilities) or from the patient’s electronic medical record (Dartmouth/Brigham and Women’s Hospital). Other details regarding the mammography exam were also obtained directly from the radiology facilities, including date of exam, identification number of the interpreting radiologist, and descriptor of mammographic breast density. Mammographic breast density was clinically-recorded using the BI-RADS lexicon: almost entirely fatty, scattered fibroglandular density, heterogeneously dense, or extremely dense (11). Breast density descriptions that did not use the BI-RADS lexicon were excluded as missing. Data from the three PROSPR breast cancer research centers were submitted to the PROSPR central data repository housed at the Statistical Coordinating Center at the Fred Hutchinson Cancer Research Center.
Statistical Analyses
All statistical analyses were performed using SAS Statistical Software Version 9 (SAS Institute, Inc., Cary, NC) and R 3.2.0 (the R Foundation, Vienna, Austria). Descriptive statistics were used to describe the distribution of patient characteristics in the study sample and the raw distribution of breast density assessments across radiologists. For certain analyses, breast density assessments were dichotomized as “non-dense” (almost entirely fat or scattered fibroglandular densities) or “dense” (heterogeneously dense or extremely dense), following the definitions used in most state density notification laws (5). To account for variation in patient characteristics across radiologists, we fit separate a logistic regression model of breast density to the patients for each radiologist, adjusting for patient age, race/ethnicity, and BMI (categorized as shown in Table 1). A total of 24,816 exams with missing race/ethnicity or BMI were excluded from the multivariable analyses (11.4% of the total sample). The models were used to estimate adjusted percentages of mammograms categorized as dense, which were standardized to the joint age and BMI distribution in the overall study population (19). This procedure estimated the percentage of mammograms each radiologist would classify as dense if each radiologist’s patients had the same distribution of age, race/ethnicity, and BMI as in the entire population. The difference between the unadjusted percent dense and the estimated percent dense weighted to a standard population is shown in Supplemental Figure 1. Some women contributed multiple screening exams during the study period. Accounting for clustering of density assessments due to multiple exams per woman using generalized estimating equations with an independent working correlation structure produced similar results. Therefore, we used the simpler logistic regression model.
Table 1.
Characteristics of the study patient population (N=145,123).
| Characteristic* | N | % |
|---|---|---|
| Age | ||
| 40–49 | 39,222 | 27.0 |
| 50–59 | 47,525 | 32.8 |
| 60–69 | 37,108 | 25.6 |
| 70–89 | 21,268 | 14.7 |
| Race/ethnicity | ||
| Non-Hispanic White | 115,905 | 79.9 |
| Non-Hispanic African-American | 14,532 | 10.0 |
| Non-Hispanic Asian/Pacific Islander | 2,632 | 1.8 |
| Non-Hispanic Other | 2,963 | 2.0 |
| Hispanic | 5,812 | 4.0 |
| Unknown | 3,279 | 2.3 |
| Body mass index (kg/m2) | ||
| <18.5 | 3,082 | 2.1 |
| 18.5–24.9 | 47,855 | 33.0 |
| 25.0–29.9 | 38,508 | 26.5 |
| 30.0–34.9 | 22,486 | 15.5 |
| ≥35.0 | 18,648 | 12.9 |
| Unknown | 14,544 | 12.2 |
| PROSPR Research Center | ||
| Dartmouth/Brigham & Women’s | 32,104 | 22.1% |
| University of Pennsylvania | 33,975 | 23.4% |
| University of Vermont | 79,044 | 54.5% |
Characteristic at first screening mammography exam during the study period. 52,800 women contributed multiple exams to the study.
Data were available on consecutive screening mammograms for 45,313 women. We compared the density assessments at the first two available consecutive mammograms per patient, with stratification according to whether the mammograms were interpreted by the same or different radiologists. A chi-square test was used to determine if the discordance in dense/non-dense rating on consecutive mammograms was different when the exams were interpreted by the same vs. different radiologists.
Role of the funding source
This work was funded by the National Cancer Institute. The funding source had no role in the design of the study; the collection, analysis, and interpretation of the data; or the approval of the final version of the manuscript.
RESULTS
The final study population for analysis consisted of 216,783 screening mammograms from 145,123 women, which were interpreted by 83 radiologists (16 from the University of Pennsylvania site, 39 from the University of Vermont site, and 28 from the Dartmouth/Brigham and Women’s site). The mean age of the patient population was 57.9 years (standard deviation, 10.8 years; median 57.0; range 40–89 years). Approximately 80% of patients were Non-Hispanic White and more than half were overweight or obese (Table 1). Overall, 36.9% of mammograms were rated as dense (heterogeneously or extremely dense).
Use of the four breast density categories varied substantially across radiologists (Figure 1). The median percent of mammograms rated dense (heterogeneously or extremely dense) was 38.7%, with an interquartile range of 28.9–50.9% and a full range of 6.3% to 84.5% (Table 2). Twenty-five percent of radiologists rated fewer than 28.9% of their patients’ mammograms as having dense breasts, while the highest twenty-five percent of radiologists rated at least 50.9% of their patients’ mammograms as having dense breasts. Among the four specific density categories, the absolute degree of variation was widest for the heterogeneously dense category, for which the interquartile range across radiologists was 24.2–44.6%. Variation was markedly lower for the extremely dense category (interquartile range 1.9–8.5%).
Figure 1.
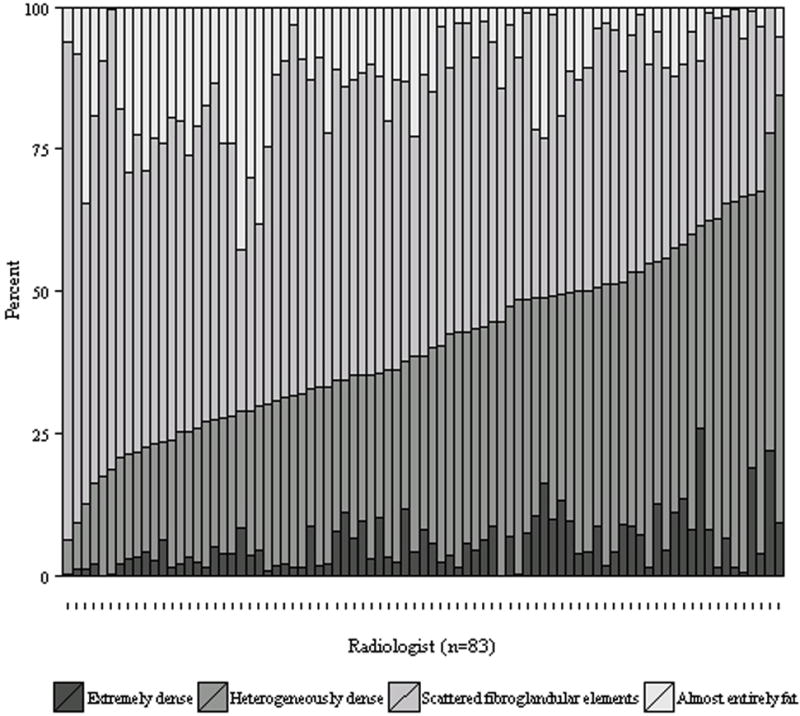
Distribution of BI-RADS breast density assessments by radiologist. The radiologists are arranged in ascending order of percent of mammograms rated as dense (extremely or heterogeneously dense).
Table 2.
The distribution of breast density assessment categories among 83 radiologists, based on 216,783 screening mammograms, as interpreted during routine clinical practice.
| Percent of Mammograms in Each Density Category*
|
|||
|---|---|---|---|
| Density assessment | Median | Range | 25th–75th percentile |
| All Centers (N=83 radiologists) | |||
| Almost entirely fatty | 10.9 | 0.0, 42.6 | 4.3, 19.3 |
| Scattered fibroglandular densities | 48.3 | 10.3, 87.7 | 37.1, 54.1 |
| Heterogeneously dense | 33.8 | 6.1, 75.3 | 24.2, 44.6 |
| Extremely dense | 4.0 | 0.0, 25.8 | 1.9, 8.5 |
| Heterogeneously or extremely dense | 38.7 | 6.3, 84.5 | 28.9, 50.9 |
| Dartmouth/Brigham & Women’s (N=28) | |||
| Heterogeneously or extremely dense | 44.1 | 21.7, 67.5 | 37.2, 52.1 |
| University of Pennsylvania (N=16) | |||
| Heterogeneously or extremely dense | 47.9 | 23.6, 66.6 | 31.8, 55.6 |
| University of Vermont (N=39) | |||
| Heterogeneously or extremely dense | 30.1 | 6.3, 84.5 | 24.2, 46.7 |
For each density category we computed the percentage of exams that each radiologist classified in that specific category. The distribution of these 83 percentages is then described using the median, range (minimum, maximum), and interquartile range (25th – 75th percentile). For example, for the heterogeneously dense category, the median percentage of exams in that category among the 83 radiologists was 33.8%. The range indicates that one radiologist rated only 6.1% of exams as heterogeneously dense while another rated 75.3% as heterogeneously dense. Twenty five percent of the radiologists assigned 24.2% or less of their exams to the heterogeneously dense category while the top quartile assigned 44.6% or more to that category.
Stratification by PROSPR center revealed substantial variation in density assessment across radiologists within each center (Table 2). The full range was largest at the University of Vermont and centered upon a lower median than at the University of Pennsylvania and Dartmouth/Brigham & Women’s.
Multivariable adjustment for patient age, race, and BMI had little impact on the variation across radiologists in the percent of mammograms rated as dense (Supplemental Figure 1). The median and interquartile range after adjustment were 40.1% and 20.9%, respectively.
Stratification by patient age and BMI revealed substantial variation across radiologists in the percent of mammograms rated as dense within nearly all age/BMI categories (Table 3). Among women with BMI 18.5–24.9 kg/m2, there was wide variation in density assessments across radiologists among both younger women (interquartile range 21% for women aged 40–49) and older women (interquartile range 25% for women aged 60–69).
Table 3.
Distribution of percent of mammograms rated as heterogeneously or extremely dense among radiologists, stratified by age and body mass index.
| Age | Body Mass Index (kg/m2) | Sample size | Percent of Mammograms Rated Dense* | |||
|---|---|---|---|---|---|---|
| Mammograms | Radiologists† | Median | Range | 25th – 75th percentile | ||
| 40–49 | <18.5 | 1,201 | 82 | 88 | 36, 100 | 81, 94 |
| 40–49 | 18.5–24.9 | 20,028 | 83 | 77 | 16, 97 | 64, 85 |
| 40–49 | 25.0–29.9 | 13,233 | 83 | 54 | 8, 90 | 38, 69 |
| 40–49 | 30.0–34.9 | 7,445 | 83 | 39 | 2, 91 | 23, 54 |
| 40–49 | 35+ | 6,789 | 83 | 19 | 1, 71 | 11, 33 |
|
| ||||||
| 50–59 | <18.5 | 1,425 | 82 | 80 | 29, 100 | 69, 88 |
| 50–59 | 18.5–24.9 | 24,247 | 83 | 63 | 12, 94 | 51, 75 |
| 50–59 | 25.0–29.9 | 18,648 | 83 | 40 | 6, 84 | 28, 55 |
| 50–59 | 30.0–34.9 | 10,764 | 83 | 25 | 2, 72 | 15, 38 |
| 50–59 | 35+ | 9,073 | 83 | 11 | 1, 51 | 6, 22 |
|
| ||||||
| 60–69 | <18.5 | 1,118 | 83 | 72 | 16, 100 | 58, 81 |
| 60–69 | 18.5–24.9 | 18,177 | 83 | 50 | 6, 91 | 38, 63 |
| 60–69 | 25.0–29.9 | 15,918 | 83 | 27 | 3, 77 | 18, 40 |
| 60–69 | 30.0–34.9 | 9,405 | 83 | 16 | 1, 62 | 9, 27 |
| 60–69 | 35+ | 7,339 | 83 | 7 | 0, 38 | 4, 15 |
|
| ||||||
| 70–89 | <18.5 | 849 | 81 | 62 | 8, 98 | 46, 75 |
| 70–89 | 18.5–24.9 | 10,740 | 83 | 40 | 3, 90 | 26, 54 |
| 70–89 | 25.0–29.9 | 10,212 | 83 | 19 | 1, 75 | 12, 30 |
| 70–89 | 30.0–34.9 | 5,452 | 83 | 11 | 0, 59 | 6, 20 |
| 70–89 | 35+ | 3,003 | 83 | 5 | 0, 32 | 2, 11 |
“Dense” includes heterogeneously dense and extremely dense. Adjusted for patient race/ethnicity.
Radiologists interpreting fewer than five mammograms in a given age/BMI category were excluded from statistics for that category.
For women with consecutive exams during the study period, the mean duration between first and second mammogram was 1.2 years both for women with mammograms read by different radiologists (median 1.1, interquartile range 1.0–1.3) and for women with mammograms read by the same radiologist (median 1.1, interquartile range 1.0–1.2). Among women with consecutive mammograms read by different radiologists (N=34,271 women), 32.6% had a different density assessment at the two exams (Table 4). The most common change was from heterogeneously dense to scattered fibroglandular densities (9.6%), and vice versa (6.8%). With density dichotomized as dense or non-dense, 17.2% of women with consecutive exams read by different radiologists had discordant density ratings at the two exams (Table 4); 27.0% of women with dense breasts at the first exam were deemed to have non-dense breasts at the second exam and 11.4% of women with non-dense breasts at the first exam were deemed to have dense breasts at the second exam. The discordance rate for dense/non-dense was significantly smaller when consecutive exams were read by the same radiologist vs. a different radiologist (X2=645, 1 degree of freedom, p<0.001). Among women with consecutive mammograms read by the same reader (N=11,042 women), 10.0% had discordant ratings for dense vs. non-dense at the two exams.
Table 4.
Mammographic breast density assessment among women with two consecutive mammograms during the study period.
| All women | |||||
|---|---|---|---|---|---|
| Density at Second Exam | |||||
| Density at First Exam | Almost entirely fat | Scattered fibroglandular densities | Heterogeneously dense | Extremely dense | Total |
| Almost entirely fat | 4877 (10.8%) | 2424 (5.3%) | 48 (0.1%) | 2 (0%) | 7351 (16.2%) |
| Scattered fibroglandular densities | 1918 (4.2%) | 16409 (36.2%) | 2820 (6.2%) | 76 (0.2%) | 21223 (46.8%) |
| Heterogeneously dense | 96 (0.2%) | 3866 (8.5%) | 9384 (20.7%) | 748 (1.7%) | 14094 (31.1%) |
| Extremely dense | 7 (0%) | 99 (0.2%) | 1249 (2.8%) | 1290 (2.8%) | 2645 (5.8%) |
| Total | 6898 (15.2%) | 22798 (50.3%) | 13501 (29.8%) | 2116 (4.6%) | 45313 (100%) |
|
| |||||
| Women with exams interpreted by different radiologists | |||||
| Density at Second Exam | |||||
| Density at First Exam | Almost entirely fat | Scattered fibroglandular densities | Heterogeneously dense | Extremely dense | Total |
| Almost entirely fat | 3321 (9.7%) | 1969 (5.7%) | 43 (0.1%) | 2 (0%) | 5335 (15.6%) |
| Scattered fibroglandular densities | 1617 (4.7%) | 12047 (35.2%) | 2319 (6.8%) | 69 (0.2%) | 16052 (46.8%) |
| Heterogeneously dense | 82 (0.2%) | 3302 (9.6%) | 6872 (20.1%) | 606 (1.8%) | 10862 (31.7%) |
| Extremely dense | 5 (0%) | 87 (0.3%) | 1057 (3.1%) | 873 (2.5%) | 2022 (5.9%) |
| Total | 5025 (14.7%) | 17405 (50.8%) | 10291 (30.0%) | 1550 (4.5%) | 34271 (100%) |
|
| |||||
| Women with exams interpreted by the same radiologist | |||||
| Density at Second Exam | |||||
| Density at First Exam | Almost entirely fat | Scattered fibroglandular densities | Heterogeneously dense | Extremely dense | Total |
| Almost entirely fat | 1556 (14.1%) | 455 (4.1%) | 5 (0%) | 0 (0%) | 2016 (18.3%) |
| Scattered fibroglandular densities | 301 (2.7%) | 4362 (39.5%) | 501 (4.5%) | 7 (0.1%) | 5171 (46.8%) |
| Heterogeneously dense | 14 (0.1%) | 564 (5.1%) | 2512 (22.7%) | 142 (1.3%) | 3232 (29.3%) |
| Extremely dense | 2 (0%) | 12 (0.1%) | 192 (1.7%) | 417 (3.8%) | 623 (5.6%) |
| Total | 1873 (17%) | 5393 (48.8%) | 3210 (29.1%) | 566 (5.1%) | 11042 (100%) |
DISCUSSION
Our findings demonstrate that there is wide variation among radiologists in the percent of mammograms rated dense (ranging from 6.3% to 84.5% in our sample), which persists after adjustment for patient factors. Additionally, 17.2% of women (more than 1 in 6) with consecutive mammograms interpreted by different radiologists during a short time period are re-classified in dense vs. non-dense categories. This variation has important implications for debates regarding mandatory density reporting, clinical management of patients who are told they have dense breasts, and for investigators using radiologists’ subjective measures of breast density in cancer research.
The widespread enactment of breast density notification laws presents physicians with the challenging task of discussing the potential benefits and harms of supplemental breast cancer screening in the absence of consensus guidelines (10). Overall, our findings suggest that a woman’s likelihood of being told she has dense breasts will vary substantially based on which radiologist interprets her mammogram. Primary care providers should therefore use caution when considering supplemental breast cancer screening options for a woman on the basis of her reported breast density. While patient-provider discussions of supplemental screening may be triggered by mandatory density reporting, physicians should consider density information as only one subjective factor among many relevant risk factors that should be incorporated into decision-making about screening. Policymakers should be aware that density assessment as currently practiced is subjective and highly variable across radiologists. Density reporting laws that suggest consideration of supplemental screening for women with dense breasts should include language acknowledging that density is a subjective measure that should be considered in the wider context of factors that influence the likelihood of a false-negative mammogram and future breast cancer risk. Notably, women with dense breasts, but at otherwise low or average breast cancer risk, do not have high false-negative rates on mammography (20). A variety of validated models are available for providers to characterize a patient’s breast cancer risk (21–23). Additional evidence is urgently needed to support the development of guidelines regarding supplemental screening based on both breast density and other established risk factors.
Our results illustrate the population-level effect of the moderate reliability in density assessment previously reported in earlier studies using test sets. A recent study using a test set of 282 mammograms read by 19 radiologists found a mean kappa statistic of 0.46 for inter-radiologist agreement, with wide variation in the kappa statistic across radiologist pairs (ranging from 0.02 to 0.72) (16). Other test set studies have estimated kappa statistics ranging from 0.43–0.58 for inter-radiologist agreement (13, 14). Test set studies have also demonstrated that intra-radiologist agreement is higher (kappa approximately 0.70) compared to inter-radiologist agreement (13, 16). Importantly, inter-radiologist agreement was also poorer than intra-radiologist agreement in our study, and the majority of women in our study who had multiple mammograms in the study period had them interpreted by different radiologists.
Our complementary approach sought to compare the distribution of breast density assessments across radiologists in clinical practice. We focused particularly on variation in the percent of patients characterized as dense or non-dense, as this dichotomization is linked to mandatory density notification laws now enacted in about half of US states. The fraction of patients with dense breasts varied widely across radiologists, ranging from 6.3% to 84.5%. The middle 50% of radiologists varied by at least 20 percentage points in the fraction of patients rated as dense, even after adjusting for patient factors. Notably, there was less variation in the use of the extremely dense category. Based on our results, providers and policymakers may wish to distinguish between these categories, since women with extremely dense breasts are most likely to be consistently rated as dense.
Our analyses of consecutive mammograms demonstrate the magnitude of discordance when women have mammograms interpreted by different radiologists within a short time period. No prior studies of clinically-recorded density assessments from consecutive mammograms have reported density concordance when limited to exams interpreted by different radiologists. One study included data from 87,066 women undergoing digital mammography (average 483 days between exams) at facilities within the Breast Cancer Surveillance Consortium (17). A kappa statistic of 0.54 was estimated for agreement between the consecutive density measures, though this included a mix of mammogram pairs that were interpreted by either the same or different radiologists. A prior study limited to consecutive mammograms (N=11,755 women) interpreted by the same radiologist within a two year time period observed an overall kappa statistic of 0.59 for intra-radiologist agreement (15). Our results show that with an average of just over one year between mammograms, more than one in six women will change density status if the exams are interpreted by different radiologists. The biological change in breast density over a one year period is expected to be small, with quantitative tools estimating an average 1% decline in percent breast density per year (24, 25). Notably, the discordance in density assessment in our study included differential classification in both directions: downgrading density and upgrading density.
The American College of Radiology and other organizations have highlighted the lack of reproducibility of breast density assessment in a statement cautioning about the potential unintended harms of mandatory breast density notification to patients (26). Our results provide further evidence of the need for objective, standardized measures of breast density. A number of automated software programs have been developed for density quantification (27); these provide highly reproducible (28), objective measures of density typically on a continuous scale from 0–100%. Further research is needed to examine whether such automated tools can identify women who would benefit from supplemental breast cancer screening in addition to mammography.
Our study was limited to assessments by radiologists practicing in the clinical networks of the three PROSPR breast cancer screening research centers. While these included a large number of academic and community practice breast imaging facilities in four states, the degree of variation in breast density assessment may differ in other clinical settings around the country. We observed somewhat greater variation in density assessment among radiologists within the University of Vermont practices, likely reflecting the predominance of small community hospital radiology facilities served by generalist radiologists in the statewide Vermont PROSPR network. The PROSPR consortium is currently collecting additional information regarding radiology facility characteristics to evaluate predictors of variation in density assessment. Notably, all exams included in this study were interpreted prior to any enactment of density notification legislation in the four included states. A recent single-institution study demonstrated a trend of radiologists to downgrade breast density readings immediately after the implementation of their state’s breast density notification legislation suggesting additional subjectivity (30). The potential impact of these laws on the degree of variation in density assessment is currently unknown. Finally, it is unclear whether the emerging adoption of digital breast tomosynthesis for breast cancer screening will have an impact on breast density assessment, particularly among practices that abandon concomitant 2D digital mammography in favor of synthetic 2D images created from the reconstructed tomosynthesis views.
The overall distribution of breast density in our study population was comparable to that reported in a prior large national study (8). Compared to the US population, our study population had somewhat lower rate of overweight/obesity – 61% of those with known BMI, compared to the US rate of 68.6% (31) – that is consistent with the typically healthier cancer screening population. Our study included a comparable frequency of African American women to the US population, but a higher percent of non-Hispanic White women and a lower fraction of Hispanic and Asian women. Variation in density assessment may differ at radiology practices serving a different demographic mix of patients, particularly if serving a large proportion of Asian patients.
Our study was limited in that quantitative density measures were not available for comparison to the radiologist’s subjective assessment. Rather, we used multivariable statistical models to account for variation across radiologists in patient case mix defined by age, race, and BMI. Age and BMI are the strongest known determinants of mammographic breast density (8, 32), and Asian women have elevated breast density that persists after adjustment for age and BMI (33). Other factors for which we did not adjust, including postmenopausal hormone use and reproductive history, have been associated with breast density but their effects are quite modest in comparison to those of age and BMI (34). We found that adjustment for age, race, and BMI had little effect on the degree of variation in breast density assessment observed across radiologists. Adjustment for additional patient factors that have modest association with density and/or low population prevalence (e.g., postmenopausal hormone use) is unlikely to substantially change our results. Finally, we note that our results likely reflect not only variation in radiologist interpretation of images but also the variation in the mammography machines and software used to produce digital mammographic images that is routinely present across facilities and within facilities over time in clinical practice.
As the research and clinical communities seek to develop more reliable means of assessing breast density and identifying women in need of supplement screening, our findings suggest that women, clinicians, and policymakers should consider the substantial variability in density assessment when considering screening options or risk stratification based on density information. The results presented here may also be useful as comparison data for radiologists reviewing their density assessment practice, analogous to what is available for assessing recall rate, cancer detection rate, and other breast imaging statistics within the range of values across peers (12, 35). Radiologists at the extremes of the distribution reported here may wish to review the BI-RADS guidance for characterizing breast tissue composition. As breast density increasingly becomes utilized in screening decision-making, the development of further professional standards, potentially including increased training and/or utilization of automated density quantification tools, may lead to more effective clinical care.
Supplementary Material
Supplemental Figure 1. Paired unadjusted and multivariable-adjusted percent of patients with dense breasts (heterogeneously or extremely dense), by radiologist. For each radiologist a black line connects the unadjusted percent with dense breasts (blue triangle) to the percent with dense breasts after adjusting for patient age, race/ethnicity and body mass index (red circle). Exams missing race/ethnicity and BMI were excluded from both the unadjusted and multi-variable adjusted results.
Acknowledgments
The authors thank the participating PROSPR Research Centers for the data they have provided for this study. A list of the PROSPR investigators and contributing research staff is provided at: http://healthcaredelivery.cancer.gov/prospr/.
GRANT SUPPORT:
This work was supported by the National Cancer Institute (NCI)-funded Population-based Research Optimizing Screening through Personalized Regimens (PROSPR) consortium (grants U01 CA163304, U54 CA163303, U54 CA163313, and U54 CA163307).
Footnotes
AUTHOR CONTRIBUTIONS:
Conception and design: Brian L. Sprague, PhD; Emily F. Conant, MD; Tracy Onega, PhD; Michael P. Garcia, MS; Elisabeth F. Beaber, PhD; Sally D. Herschorn, MD; Constance D. Lehman, MD, PhD; Anna N. A. Tosteson, ScD; Ronilda Lacson, MD, PhD; Mitchell D. Schnall, MD, PhD; Despina Kontos, PhD; Jennifer S. Haas, MD, MSc; Donald L. Weaver, MD; and William E. Barlow, PhD
Acquisition of data: Brian L. Sprague, PhD; Emily F. Conant, MD; Tracy Onega, PhD; Sally D. Herschorn, MD; Anna N. A. Tosteson, ScD; Ronilda Lacson, MD, PhD; Mitchell D. Schnall, MD, PhD; Despina Kontos, PhD; Jennifer S. Haas, MD, MSc; Donald L. Weaver, MD; and William E. Barlow, PhD
Analysis and interpretation of data: Brian L. Sprague, PhD; Emily F. Conant, MD; Tracy Onega, PhD; Michael P. Garcia, MS; Elisabeth F. Beaber, PhD; Sally D. Herschorn, MD; Constance D. Lehman, MD, PhD; Anna N. A. Tosteson, ScD; Ronilda Lacson, MD, PhD; Mitchell D. Schnall, MD, PhD; Despina Kontos, PhD; Jennifer S. Haas, MD, MSc; Donald L. Weaver, MD; and William E. Barlow, PhD
Drafting of the manuscript: Brian L. Sprague, PhD
Critical revision of the manuscript: Emily F. Conant, MD; Tracy Onega, PhD; Michael P. Garcia, MS; Elisabeth F. Beaber, PhD; Sally D. Herschorn, MD; Constance D. Lehman, MD, PhD; Anna N. A. Tosteson, ScD; Ronilda Lacson, MD, PhD; Mitchell D. Schnall, MD, PhD; Despina Kontos, PhD; Jennifer S. Haas, MD, MSc; Donald L. Weaver, MD; and William E. Barlow, PhD
Final approval of the article: Brian L. Sprague, PhD; Emily F. Conant, MD; Tracy Onega, PhD; Michael P. Garcia, MS; Elisabeth F. Beaber, PhD; Sally D. Herschorn, MD; Constance D. Lehman, MD, PhD; Anna N. A. Tosteson, ScD; Ronilda Lacson, MD, PhD; Mitchell D. Schnall, MD, PhD; Despina Kontos, PhD; Jennifer S. Haas, MD, MSc; Donald L. Weaver, MD; and William E. Barlow, PhD
References
- 1.Carney PA, Miglioretti DL, Yankaskas BC, Kerlikowske K, Rosenberg R, Rutter CM, et al. Individual and combined effects of age, breast density, and hormone replacement therapy use on the accuracy of screening mammography. Annals of Internal Medicine. 2003;138(3):168–75. doi: 10.7326/0003-4819-138-3-200302040-00008. [DOI] [PubMed] [Google Scholar]
- 2.Boyd NF, Guo H, Martin LJ, Sun L, Stone J, Fishell E, et al. Mammographic density and the risk and detection of breast cancer. N Engl J Med. 2007;356(3):227–36. doi: 10.1056/NEJMoa062790. [DOI] [PubMed] [Google Scholar]
- 3.Are You Dense Inc. 24 Density Reporting Bills and A Growing Number of Introduced Bills in 2016. Available from URL: http://areyoudenseadvocacy.org/worxcms_published/news_page200.shtml [accessed March 16, 2016]
- 4.Dehkordy SF, Carlos RC. Dense breast legislation in the United States: state of the states. J Am Coll Radiol. 2013;10(12):899–902. doi: 10.1016/j.jacr.2013.09.007. [DOI] [PubMed] [Google Scholar]
- 5.Ray KM, Price ER, Joe BN. Breast density legislation: mandatory disclosure to patients, alternative screening, billing, reimbursement. AJR Am J Roentgenol. 2015;204(2):257–60. doi: 10.2214/AJR.14.13558. [DOI] [PubMed] [Google Scholar]
- 6.U.S. Congress. S.370 Breast Density and Mammography Reporting Act of 2015. 2015 Accessed at https://www.congress.gov/bill/114th-congress/senate-bill/370 on May 28, 2015.
- 7.U.S. Food and Drug Administration. Mammography Quality Standards Act; Regulatory Amendments. Federal Register. 2015;80(117):35020. Accessed at http://www.gpo.gov/fdsys/pkg/FR-2015–06–18/pdf/2015–14352.pdf on July 31, 2015. [Google Scholar]
- 8.Sprague BL, Gangnon RE, Burt V, Trentham-Dietz A, Hampton JM, Wellman RD, et al. Prevalence of mammographically dense breasts in the United States. J Natl Cancer Inst. 2014;106(10) doi: 10.1093/jnci/dju255. [DOI] [PMC free article] [PubMed] [Google Scholar]
- 9.Siu AL. Screening for Breast Cancer: U.S. Preventive Services Task Force Recommendation Statement. Ann Intern Med. 2016;164(4):279–96. doi: 10.7326/M15-2886. [DOI] [PubMed] [Google Scholar]
- 10.Haas JS, Kaplan CP. The Divide Between Breast Density Notification Laws and Evidence-Based Guidelines for Breast Cancer Screening: Legislating Practice. JAMA Intern Med. 2015;175(9):1439–40. doi: 10.1001/jamainternmed.2015.3040. [DOI] [PMC free article] [PubMed] [Google Scholar]
- 11.American College of Radiology. ACR Breast Imaging Reporting and Data System, Breast Imaging Atlas. 4th. Reston, VA: American College of Radiology; 2003. ACR BI-RADS® - Mammography. [Google Scholar]
- 12.American College of Radiology. ACR BI-RADS Atlas: Breast Imaging Reporting and Data System. 5th. Reston, VA: American College of Radiology; 2013. ACR BI-RADS® - Mammography. [Google Scholar]
- 13.Kerlikowske K, Grady D, Barclay J, Frankel SD, Ominsky SH, Sickles EA, et al. Variability and accuracy in mammographic interpretation using the American College of Radiology Breast Imaging Reporting and Data System. J Natl Cancer Inst. 1998;90(23):1801–9. doi: 10.1093/jnci/90.23.1801. [DOI] [PubMed] [Google Scholar]
- 14.Berg WA, Campassi C, Langenberg P, Sexton MJ. Breast Imaging Reporting and Data System: inter- and intraobserver variability in feature analysis and final assessment. AJR Am J Roentgenol. 2000;174(6):1769–77. doi: 10.2214/ajr.174.6.1741769. [DOI] [PubMed] [Google Scholar]
- 15.Spayne MC, Gard CC, Skelly J, Miglioretti DL, Vacek PM, Geller BM. Reproducibility of BI-RADS breast density measures among community radiologists: a prospective cohort study. Breast J. 2012;18(4):326–33. doi: 10.1111/j.1524-4741.2012.01250.x. [DOI] [PMC free article] [PubMed] [Google Scholar]
- 16.Gard CC, Aiello Bowles EJ, Miglioretti DL, Taplin SH, Rutter CM. Misclassification of Breast Imaging Reporting and Data System (BI-RADS) Mammographic Density and Implications for Breast Density Reporting Legislation. Breast J. 2015;21(5):481–9. doi: 10.1111/tbj.12443. [DOI] [PMC free article] [PubMed] [Google Scholar]
- 17.Harvey JA, Gard CC, Miglioretti DL, Yankaskas BC, Kerlikowske K, Buist DS, et al. Reported mammographic density: film-screen versus digital acquisition. Radiology. 2013;266(3):752–8. doi: 10.1148/radiol.12120221. [DOI] [PMC free article] [PubMed] [Google Scholar]
- 18.Beaber EF, Kim JJ, Schapira MM, Tosteson AN, Zauber AG, Geiger AM, et al. Unifying screening processes within the PROSPR consortium: a conceptual model for breast, cervical, and colorectal cancer screening. J Natl Cancer Inst. 2015;107(6):djv120. doi: 10.1093/jnci/djv120. [DOI] [PMC free article] [PubMed] [Google Scholar]
- 19.Graubard BI, Korn EL. Predictive margins with survey data. Biometrics. 1999;55(2):652–9. doi: 10.1111/j.0006-341x.1999.00652.x. [DOI] [PubMed] [Google Scholar]
- 20.Kerlikowske K, Zhu W, Tosteson AN, Sprague BL, Tice JA, Lehman CD, et al. Identifying women with dense breasts at high risk for interval cancer: a cohort study. Ann Intern Med. 2015;162(10):673–81. doi: 10.7326/M14-1465. [DOI] [PMC free article] [PubMed] [Google Scholar]
- 21.Tice JA, Cummings SR, Smith-Bindman R, Ichikawa L, Barlow WE, Kerlikowske K. Using clinical factors and mammographic breast density to estimate breast cancer risk: development and validation of a new predictive model. Ann Intern Med. 2008;148(5):337–47. doi: 10.7326/0003-4819-148-5-200803040-00004. [DOI] [PMC free article] [PubMed] [Google Scholar]
- 22.Gail MH, Brinton LA, Byar DP, Corle DK, Green SB, Schairer C, et al. Projecting individualized probabilities of developing breast cancer for white females who are being examined annually. J Natl Cancer Inst. 1989;81(24):1879–86. doi: 10.1093/jnci/81.24.1879. [DOI] [PubMed] [Google Scholar]
- 23.Anothaisintawee T, Teerawattananon Y, Wiratkapun C, Kasamesup V, Thakkinstian A. Risk prediction models of breast cancer: a systematic review of model performances. Breast Cancer Res Treat. 2012;133(1):1–10. doi: 10.1007/s10549-011-1853-z. [DOI] [PubMed] [Google Scholar]
- 24.Maskarinec G, Pagano I, Lurie G, Kolonel LN. A longitudinal investigation of mammographic density: the multiethnic cohort. Cancer Epidemiol Biomarkers Prev. 2006;15(4):732–9. doi: 10.1158/1055-9965.EPI-05-0798. [DOI] [PubMed] [Google Scholar]
- 25.Hart V, Reeves KW, Sturgeon SR, Reich NG, Sievert LL, Kerlikowske K, et al. The Effect of Change in Body Mass Index on Volumetric Measures of Mammographic Density. Cancer Epidemiol Biomarkers Prev. 2015;24(11):1724–30. doi: 10.1158/1055-9965.EPI-15-0330. [DOI] [PMC free article] [PubMed] [Google Scholar]
- 26.American College of Radiology. ACR Statement on Reporting Density in Mammography Reports and Patient Summaries. Reston, VA: 2012. Accessed at http://www.acr.org/About-Us/Media-Center/Position-Statements/Position-Statements-Folder/Statement-on-Reporting-Breast-Density-in-Mammography-Reports-and-Patient-Summaries on March 16, 2016. [Google Scholar]
- 27.He W, Juette A, Denton ER, Oliver A, Marti R, Zwiggelaar R. A Review on Automatic Mammographic Density and Parenchymal Segmentation. Int J Breast Cancer. 2015;2015:276217. doi: 10.1155/2015/276217. [DOI] [PMC free article] [PubMed] [Google Scholar]
- 28.Alonzo-Proulx O, Mawdsley GE, Patrie JT, Yaffe MJ, Harvey JA. Reliability of automated breast density measurements. Radiology. 2015;275(2):366–76. doi: 10.1148/radiol.15141686. [DOI] [PubMed] [Google Scholar]
- 29.Eng A, Gallant Z, Shepherd J, McCormack V, Li J, Dowsett M, et al. Digital mammographic density and breast cancer risk: a case-control study of six alternative density assessment methods. Breast Cancer Res. 2014;16(5):439. doi: 10.1186/s13058-014-0439-1. [DOI] [PMC free article] [PubMed] [Google Scholar]
- 30.Gur D, Klym AH, King JL, Bandos AI, Sumkin JH. Impact of the new density reporting laws: radiologist perceptions and actual behavior. Acad Radiol. 2015;22(6):679–83. doi: 10.1016/j.acra.2015.02.009. [DOI] [PubMed] [Google Scholar]
- 31.National Center for Health Statistics. Health, United States, 2014. Hyattsville, MD: 2015. [PubMed] [Google Scholar]
- 32.Boyd NF, Martin LJ, Bronskill M, Yaffe MJ, Duric N, Minkin S. Breast tissue composition and susceptibility to breast cancer. J Natl Cancer Inst. 2010;102(16):1224–37. doi: 10.1093/jnci/djq239. [DOI] [PMC free article] [PubMed] [Google Scholar]
- 33.del Carmen MG, Halpern EF, Kopans DB, Moy B, Moore RH, Goss PE, et al. Mammographic breast density and race. AJR Am J Roentgenol. 2007;188(4):1147–50. doi: 10.2214/AJR.06.0619. [DOI] [PubMed] [Google Scholar]
- 34.Vachon CM, Kuni CC, Anderson K, Anderson VE, Sellers TA. Association of mammographically defined percent breast density with epidemiologic risk factors for breast cancer (United States) Cancer Causes Control. 2000;11(7):653–62. doi: 10.1023/a:1008926607428. [DOI] [PubMed] [Google Scholar]
- 35.Rosenberg RD, Yankaskas BC, Abraham LA, Sickles EA, Lehman CD, Geller BM, et al. Performance benchmarks for screening mammography. Radiology. 2006;241(1):55–66. doi: 10.1148/radiol.2411051504. [DOI] [PubMed] [Google Scholar]
Associated Data
This section collects any data citations, data availability statements, or supplementary materials included in this article.
Supplementary Materials
Supplemental Figure 1. Paired unadjusted and multivariable-adjusted percent of patients with dense breasts (heterogeneously or extremely dense), by radiologist. For each radiologist a black line connects the unadjusted percent with dense breasts (blue triangle) to the percent with dense breasts after adjusting for patient age, race/ethnicity and body mass index (red circle). Exams missing race/ethnicity and BMI were excluded from both the unadjusted and multi-variable adjusted results.