

Abstract
Thyroid hormone (TH) regulates many cellular events underlying perinatal brain development in vertebrates. Whether and how TH regulates brain development when neural circuits are first forming is less clear. Furthermore, although the molecular mechanisms that impose spatiotemporal constraints on TH action in the brain have been described, the effects of local TH signaling are poorly understood. We determined the effects of manipulating TH signaling on development of the optic tectum in stage 46–49 Xenopus laevis tadpoles. Global TH treatment caused large-scale morphological effects in tadpoles, including changes in brain morphology and increased tectal cell proliferation. Either increasing or decreasing endogenous TH signaling in tectum, by combining targeted DIO3 knockdown and methimazole, led to corresponding changes in tectal cell proliferation. Local increases in TH, accomplished by injecting suspensions of tri-iodothyronine (T3) in coconut oil into the midbrain ventricle or into the eye, selectively increased tectal or retinal cell proliferation, respectively. In vivo time-lapse imaging demonstrated that local TH first increased tectal progenitor cell proliferation, expanding the progenitor pool, and subsequently increased neuronal differentiation. Local T3 also dramatically increased dendritic arbor growth in neurons that had already reached a growth plateau. The time-lapse data indicate that the same cells are differentially sensitive to T3 at different time points. Finally, TH increased expression of genes pertaining to proliferation and neuronal differentiation. These experiments indicate that endogenous TH locally regulates neurogenesis at developmental stages relevant to circuit assembly by affecting cell proliferation and differentiation and by acting on neurons to increase dendritic arbor elaboration.
SIGNIFICANCE STATEMENT Thyroid hormone (TH) is a critical regulator of perinatal brain development in vertebrates. Abnormal TH signaling in early pregnancy is associated with significant cognitive deficits in humans; however, it is difficult to probe the function of TH in early brain development in mammals because of the inaccessibility of the fetal brain in the uterine environment and the challenge of disambiguating maternal versus fetal contributions of TH. The external development of tadpoles allows manipulation and direct observation of the molecular and cellular mechanisms underlying TH's effects on brain development in ways not possible in mammals. We find that endogenous TH locally regulates neurogenesis at developmental stages relevant to circuit assembly by affecting neural progenitor cell proliferation and differentiation and by acting on neurons to enhance dendritic arbor elaboration.
Keywords: dendrite development, in vivo imaging, neural progenitor cell, neurogenesis, retinotectal, thyroxine
Introduction
Thyroid hormone (TH) regulates neurogenesis during perinatal brain development in mammals (Eayrs and Taylor, 1951; Eayrs, 1955; Legrand, 1967; Nicholson and Altman, 1972a,b; Denver et al., 1999; Anderson, 2001; Zoeller and Rovet, 2004; Bernal, 2007; Mohan et al., 2012; Wang et al., 2014), but the effects of TH during earlier stages of brain development are unclear. It is difficult to test the effects of TH on early brain development in mammals because of the inaccessibility of the fetal brain and the inability to disambiguate the maternal versus fetal contributions of TH. By contrast, the external development of tadpoles allows manipulation and direct observation of TH's effects on cell proliferation, neuronal differentiation, and morphological changes underlying brain development. Although a surge of circulating TH drives metamorphosis in mature tadpoles (2–6 months after fertilization, depending on husbandry conditions; Nieuwkoop and Faber, 1956; Kelley, 1996), younger tadpoles are acutely sensitive to TH (Gudernatsch, 1912; Tata, 1968; Shi, 2000).
Thyroxine (T4) is produced in the thyroid gland and circulates throughout the body. T4 is converted locally in the brain to tri-iodothyronine (T3), the active form of TH, by type-II 5-deiodinase. Similarly, local expression of type-III 5-deiodinase (DIO3) converts T3 to an inactive form. During brain development, T3 predominantly binds thyroid hormone receptor α (TRα), a transcription factor that represses gene expression when unliganded (Oppenheimer and Schwartz, 1997; Havis et al., 2006; Bernal, 2007; Choi et al., 2015; Wen and Shi, 2015). This combination of circulating levels of T4 and expression of deiodinases and TRs governs spatial and temporal TH signaling in the brain. Nevertheless, most studies on TH in brain development manipulate circulating levels of TH without addressing how local TH signaling affects specific components of a developing TH-sensitive neural circuit. We investigated potential local effects of TH signaling on development of the Xenopus laevis tadpole optic tectum, the homolog of the mammalian superior colliculus, when tadpoles are about 1 week old and begin to forage for food. Neural progenitor cell (NPC) proliferation, neuronal differentiation, and retinotectal circuit assembly have been well characterized during this developmental period (Bestman et al., 2008, 2012, 2015). We used spatial and temporal manipulations of TH signaling, including global and local delivery of T3, targeted DIO3 knockdown in the tectum, and drug treatments, combined with analysis of brain morphology, neurogenesis, cell death, neuronal differentiation, and gene expression. We also used time-lapse in vivo imaging to examine distinct responses of neural progenitor cells and neurons to T3 over time. Our data show that localized increases in TH signaling induce rapid and robust increases in cell proliferation, neuronal differentiation, and dendrite arbor development and that blocking endogenous TH synthesis reduces proliferation in the optic tectum. We conclude that TH at these developmental stages drives neurogenic events essential for neural circuit assembly.
Materials and Methods
Animals.
We used albino X. laevis tadpoles that were bred on site. Tadpoles of either sex were reared in 0.1× Steinberg's solution (12 h light/dark cycle at 22°C). Tadpoles were selected for study based on their developmental stage using the morphological criteria of Nieuwkoop and Faber (1956) at the beginning of each experiment. Xenopus tadpoles are free-swimming 3–4 d after fertilization [stages 38–41, as defined by Nieuwkoop and Faber (1956))]. By 5–7 d, tadpoles have exhausted their yolk stores and begin to forage for food. We use tadpoles during these stages (stages 46–49) while the retinotectal circuit continues to undergo substantial development (Tao and Poo, 2005; Bestman et al., 2008, 2012, 2015; Deeg et al., 2009; Pratt and Aizenman, 2009; Shen et al., 2011, 2014). Under standard rearing conditions in our laboratory, stage 46 lasts 1 d, stage 47 continues for 2–3 d, stage 48 lasts 5 or more days, and stage 49 typically lasts an additional 5–6 d. Thus stage 46 tadpoles will typically progress to stage 48 after 1 week and to stage 49 over 2 weeks. During hormone bath experiments, we kept the tadpoles in bowls with 100 ml of 0.1× Steinberg's solution (see below for details about hormone experiments). Tadpoles were fed tadpole powder (Xenopus Express) twice a day, and waste was removed as needed. During in vivo imaging experiments, tadpoles were housed individually in wells of six-well tissue culture plates. We anesthetized tadpoles in 0.02% MS222 before electroporation, coconut oil injection, and during in vivo imaging. All animal procedures were performed in accordance with The Scripps Research Institute's institutional animal care and use committee's regulations. The number of animals used in each experiment is listed in the figure legends.
Hormone and drug treatments.
For systemic treatment experiments in which T3 was delivered in rearing solution, T3 (20 μg/ml; Sigma) was dissolved in 20 mm NaOH stock solution and stored at −20°C. Aliquots of T3 stock were thawed and diluted to 50 nm in Steinberg's solution, a concentration that is effective in activating TH signaling in the tadpole brain (Denver et al., 2009). Methimazole (MMI; 0.114 g/ml) was dissolved in double-distilled H2O and stored at −20°C. Aliquots of MMI stock were thawed and diluted to 1 mm in Steinberg's solution. Except where stated otherwise, tadpoles used in hormone treatment experiments were kept in bowls with 100 ml of Steinberg's solution (20–30 tadpoles per bowl). To deliver T3 locally to the eye and midbrain, we prepared suspensions of crystalline T3 in melted (35°C) coconut oil (20 mg/ml), vortexed the mixture for ∼5 min, and diluted it to four concentrations (5 mg/ml, 1 mg/ml, 500 μg/ml, 100 μg/ml) in coconut oil.
Chloro-deoxyuridine incorporation to label dividing cells.
Chloro-deoxyuridine (CldU; 10 mg/ml; 105478, MP Biomedicals) was dissolved in distilled H2O to generate 38.1 mm stock, which was then diluted to 10 mm in Steinberg's solution. We placed tadpoles in 10 mm CldU solution for 2 h and then either killed them immediately (see below) or returned them to their treatment bowl for pulse/chase analysis.
Euthanasia and tissue fixation.
Tadpoles were killed with an overdose of anesthesia (1.0% MS222) and fixed in 4% phosphate-buffered paraformaldehyde overnight at 4°C. We then washed the tadpoles with PBS and dissected the brains into PBS with 0.1% Triton X-100 (PBS-TX). Tadpoles that were used for coconut oil experiments in the eye and the brain were fixed with 2% trichloro-acetic acid for 2 h and placed into PBS before being embedded in paraffin.
Whole-mount immunostaining and imaging.
Tadpole brains were washed in PBS-TX, placed in blocking buffer (2.5% normal goat serum in PBS-TX) for 1 h, and incubated overnight in the primary antibody [phospho-Histone3 (pH3), 1:1000, Sigma-Aldrich, H0412, made in rabbit, RRID: AB_477043; BrdU, 1:200, Accurate, made in rat, RRID: AB_609568; HuC/D, 1:200, Invitrogen, A21271, made in mouse, RRID: AB_221448; GFP, 1:200, Millipore, ab3080, made in rabbit, RRID: AB_91337] in blocking buffer at 4°C with gentle rotation. We then washed the brains three times in PBS-TX, incubated them in the appropriate secondary antibody [pH3, BrdU, GFP with Alexa Fluor 488 (1:400), HuC/D with Alexa Fluor 633 (1:400); Life Technologies] for 3–4 h, washed them again in PBS-TX, and incubated them for 15 min in Sytox-O (1:1000 in PBS-TX). Brains were washed in PBS once and coverslipped in a well on a slide with Prolong Gold antifade mounting medium (Life Technologies). Immunostained brains were imaged on a FluoView 500 confocal microscope or a Nikon multiphoton microscope.
Quantification of animal length and brain morphology.
We measured the body lengths of fixed tadpoles from snout to tail tip in ImageJ from images taken with an Infinity1 camera mounted on a Nikon dissecting microscope. We measured the volume of the tectum by tracing the cross-sectional area of the tectum every five optical sections (6.2 μm) with a Wacom graphic tablet using ImageJ (RRID: SCR_003070). Tectum volume was calculated using the formula for the volume of a cone frustum using the cross-sectional areas from every other five optical sections as the top and bottom of the frustum and adding the volume segments to obtain total tectum volume. To measure the tectum width/length ratio, we measured the width of the tectum (defined as a line connecting the most lateral extent of where the cell body layer meets the neuropil on either side of the brain) and the length of the tectum (defined as a line connecting the anterior tectal commissure to the point at which the midline of the ventricular zone starts to extend laterally). The width/length ratios were measured from a z-projection of the same confocal stacks used to measure tectal volume. We used the width/length ratio as a measure of change in tectum morphology because it appeared to be a more sensitive measure of the effects of T3 than total volume (Fig. 1F–H). The width/length ratio has previously been shown to be a sensitive indicator of metamorphic change in the tadpole brain (Coen et al., 2007).
Figure 1.

T3 changes brain morphology. A, Protocol for T3 treatment. Stage 47 tadpoles were split into two groups: control bath and T3 bath (50 nm). All animals were killed after 6 d, brains were stained with Sytox-O to label nuclei, and imaged on a confocal microscope. Prolif. Zone, Proliferation zone. B, Representative z-projections of control and T3-treated brains stained with Sytox-O are shown as montages. Treatment with T3 induced substantial changes in morphology in the telencephalon, pretectum, optic tectum, and hindbrain. Also indicated are the neuropil, cell body layer, and proliferative zone of the optic tectum. C, Representative confocal z-projections of tecta from the two experimental groups. The fuchsia and blue lines in the control (left) show where measurements of tectal length and width were taken, respectively. D, E, T3 induced an increase in the volume (D) and width/length ratio (E) of the tectum (**p < 0.01, ***p < 0.001). F, Volume and width/length ratio significantly covaried (r2 = 0.57, p < 0.01).
Quantification of cell number.
We counted the number of CldU+, pH3+, and dying Sytox-O+ cells from optical stacks of whole imaged tecta in ImageJ. The area of the tectum that was quantified was delineated by the anterior commissure on the rostral side, the most caudal extent of the midbrain ventricle, the dorsal surface of the brain, and the top 40 or 55 optical sections of tectum were used to delineate the ventral extent of the region of interest. For CldU and pH3, we counted cells that met a threshold fluorescence intensity of at least three times the intensity of background. We counted brightly labeled Sytox-O+ cells, a measure of apoptotic cells, as described by Faulkner et al. (2015), that met a threshold intensity of at least 1.5 times the intensity of their nearest neighboring cells. Dying Sytox-O+ cells were also characterized as having a relatively small, condensed nucleus. A significant portion of these cells also colocalize with activated capase-3 (Faulkner et al., 2015).
For analysis of CldU labeling in paraffin sections, we killed tadpoles, fixed them with 2% trichloro-acetic acid (see above), and embedded the entire tadpole in paraffin using a paraffin embedding system (Thermo Fisher Scientific). We cut the heads using a rotary microtome into 5-μm-thick slices and mounted the sections onto Superfrost slides (Thermo Fisher Scientific) in a warm water bath. We incubated the slides in a 50°C incubator overnight, cooled the slides, and deparaffinized them in xylene. Slides were washed in a descending gradient of EtOH, washed in deionized water, and washed in PBS. The sections were dried briefly and outlined with a PAP pen (Sigma), washed further with PBS, incubated with blocking buffer (see above) for 1 h, and incubated with a primary antibody against BrdU (1:200, made in rat; Accurate) overnight. We washed the slides with PBS, incubated the sections with an anti-rat biotinylated secondary antibody for 90 min, washed with PBS, incubated with the ABC kit (Vector Laboratories) for 45 min, washed with PBS, and revealed immunolabel with a diaminobenzidine-based colorimetric reaction. We washed the sections with PBS and water, stained them with a hematoxolin solution for 1 min, washed with water, dehydrated in an ascending series of EtOH, cleared in xylene, and coverslipped with DPX. We counted CldU+ cells (see Fig. 7D, brown precipitate, arrowheads) in every other section in at least 10 sections per eye (∼5 sections nasal/temporal to the punctum caecum). CldU+ cells in the retina were found in the ventral and dorsal ciliary margin. We counted CldU+ cells in every other section in at least 10 sections in the midbrain, starting from the caudal end of the midbrain and moving rostrally. We counted all CldU+ cells that lined the midbrain ventricle; this includes cells from the tectum and tegmentum.
Figure 7.

Local delivery of T3 alters tectal morphology and increases NPC proliferation and cell death. A, Representative confocal z-projections of tecta labeled for pH3 (green) and Sytox-O (red) taken at day 7 from four of the treatment groups in this experiment. B–D, Plots of quantified neuronal attributes for each day of treatment for six experimental groups. B, T3 treatments increased the width/height ratio of optic tecta starting on day 5 relative to control groups (2-way ANOVA, effect of treatment, p < 0.001). C, T3 increased the number of pH3+ cells in the tadpole tecta relative to control groups (2-way ANOVA, effect of treatment, p < 0.001). D, Bath application of T3 and the highest doses of T3CO significantly increased the number of dying Sytox-O+ cells on days 6 and 7 (2-way ANOVA, effect of treatment, p < 0.001). The number of dying Sytox-O+ cells in the 500 μg/ml T3CO group did not differ from control groups. n = 7–11 brains per treatment and time point.
Electroporation, morpholinos, plasmids, and in vivo imaging.
Optic tecta were electroporated with plasmids or morpholinos as described previously (Bestman and Cline, 2014; Bestman et al., 2015). Morpholinos against the 5′UTR region of DIO3 (DIO3 MO: GCAGTGCAACATGGTGCTCAGCCCT) or control morpholinos (control MO: TAACTCGCATCGTAGATTGACTAAA) were designed by GeneTools. For in vivo imaging of NPC proliferation and neuronal differentiation, we electroporated optic tecta of stage 46 tadpoles with a construct, called pSox2-bd::GFP, that drives GFP expression in Sox2-expressing NPCs (Bestman et al., 2012). We counted the GFP+ cells that had morphological features of either neurons (pear-shaped cell body, dendritic arbor, and a fine axonal process, often tipped with a growth cone) or NPCs (columnar-shaped cell body in or adjacent to the ventricular zone extending a process with end feet adjacent to the pia). These criteria for identification of NPCs and neurons have been described previously (Bestman et al., 2012). Cells that had ambiguous features were designated as unclassifiable. We quantified the change in the number of GFP+ neurons or NPCs and the total number of GFP+ cells over the 3 d of imaging, relative to the numbers on first day of imaging.
To test for efficacy of morpholino-mediated knockdown of DIO3, we electroporated optic tecta of stage 46 tadpoles with control morpholinos or morpholinos against DIO3 along with two plasmids: pSox2bd::Gal4/UAS::DIO3-t2A-eGFP and UAS::tRFPnls. All tRFP+ cells had also been transfected with the DIO3-t2A-eGFP plasmid, since the tRFP can only be expressed in the presence of Gal4. DIO3 MO-mediated knockdown of DIO3 would also decrease GFP expression in RFP+ cells, as described by Faulkner et al. (2015). After 2–3 d, we imaged GFP and RFP in tecta using a PerkinElmer spinning-disk confocal microscope. We established image acquisition conditions in tecta electroporated with control MO to ensure that eGFP fluorescence in individual cells was not saturated. We used tRFP expression at the largest cross-sectional area in the nucleus as the search criterion and measured the eGFP intensity in the green channel. We also calculated the percentage of tRFP+ cells that were also eGFP+. Cells were considered to be eGFP+ if intensity of GFP fluorescence was more than three times the background intensity, taken from areas free of visible label. There was some bleedthrough of tRFP into the green channel, but the level of fluorescence was almost always less than three times the background. The eGFP fluorescence intensity was analyzed in ImageJ. We analyzed at least 10 cells per tadpole (control MO, n = 19; DIO3 MO, n = 13).
To label optic tectal neurons for in vivo time-lapse imaging of dendritic arbor structure, we sparsely electroporated optic tecta of stage 46 tadpoles with a GFP-expressing plasmid (pα-actinin::GAL4/UAS::eGFP) and imaged fields containing one to three neurons with a two-photon microscope starting 6 d later. Immediately after collecting the first image, we injected either T3-free melted coconut oil (ControlCO) or T3 in coconut oil (T3CO) and imaged the same cells each day over the following 3 d. 3D renderings of the entire dendritic arbor structures were generated in Imaris (RRID:SCR_007370), and the entire extent of the dendritic arbor of each neuron was reconstructed across all three time points. We quantified dendritic branch tip number and total dendritic arbor branch length.
Quantification of gene expression.
We performed two experiments that quantified changes in gene expression. First, two groups of 10 stage 46 tadpoles were electroporated with either DIO3 MO or control MO and killed 5 d later by overdose of MS222 (1%). Second, 32 stage 46 tadpoles were split into two groups and placed into either Steinberg's solution (control) or Steinberg's solution with 50 nm T3. Tadpoles were killed either 2 or 4 d later by overdose of MS222. We quickly dissected the brains rostral to the hindbrain–spinal cord junction, placed them into Trizol (Life Technologies), and froze them in −80°C. We extracted RNA per the manufacturer's instructions for Trizol, measured the amount of RNA extracted on a NanoDrop, and reverse transcribed the mRNA using the iScript kit (Bio-Rad), using 200 ng of RNA per reaction. We performed quantitative PCR (qPCR) using 2 ng of cDNA per reaction using the iTaq Universal SYBR Green Supermix kit (Bio-Rad) on a Bio-Rad CFX96 thermocylcer. A description of primers used is in Table 1. All reactions were done with technical triplicates; outlier reactions (deviations more than 1.5 times the SD from the mean) within a set of triplicates were removed from analysis. We used a two-step reaction with a 10 s 95° melt step, followed by a 30 s 60° annealing and an extension step for 40 cycles, with fluorescence measured at the end of every 60° step. At the end of 40 cycles, we evaluated the melt curves for secondary products. None of the primers used in this study generated secondary products.
Table 1.
Primers used for quantification of gene expression
| Gene | Gene name | Primer direction | Primer sequence | Amplicon size (bp) | Two-way ANOVA results (versus rps13 + rpl32) |
||
|---|---|---|---|---|---|---|---|
| Time | Treatment | Interaction | |||||
| trα | Thyroid Hormone Receptor α | For | TCCAGACAGCGAGACCCTAA | 91 | 0.449 | 0.866 | 0.0053 |
| Rev | GGCATCAGAGACAACACCCA | ||||||
| trβ | Thyroid Hormone Receptor β | For | AGATCATGTCCCTCCGAGCA | 114 | 0.0004 | <0.0001 | 0.0818 |
| Rev | CCACACCGAGTCCTCCATTT | ||||||
| nrep | Neuronal Regeneration Related Protein | For | TGTAGCGGGAGCAATCACAA | 162 | 0.0019 | <0.0001 | 0.0004 |
| Rev | ACATTCAGAAACCTGCCCCT | ||||||
| pcna | Proliferating Cell Nuclear Antigen | For | TTCTTGTGCGAAGGATGGGG | 150 | <0.0001 | <0.0001 | 0.508 |
| Rev | CGCAATGCAAATGTGAGCTG | ||||||
| mcm5 | Minichromosome Maintenance Complex Component 5 | For | GTGCTTGCTGCTTTCTTCTCT | 81 | <0.0001 | <0.0001 | 0.0207 |
| Rev | CTCTCCGCCAAAACTATCGC | ||||||
| gapdh | Glyceraldehyde-3-Phosphate Dehydrogenase | For | AATCTACTGGAGTCTTCACAACCA | 139 | 0.636 | 0.0309 | 0.135 |
| Rev | GAGTTCTCATATTTCTCATGGTTCA | ||||||
| ywhaz | Tyrosine 3-Monooxygenase/Tryptophan 5-Monooxygenase Activation Protein, Zeta | For | AATGCCACGCAACCAGAAAG | 101 | <0.0001 | 0.0019 | 0.0276 |
| Rev | ATATCTGACTTTGCATCGCCG | ||||||
| hprt1 | Hypoxanthine Phosphoribosyltransferase 1 | For | ATGCAGCCGATCTGGAGAAA | 72 | 0.176 | 0.0009 | 0.77 |
| Rev | CTCGAGCCAGCCTTTCAGTC | ||||||
| rps13 | Ribosomal Protein S13 | For | ATGTCAAGGAACAGATCTTCAAACT | 131 | |||
| Rev | GAGGATTCTCAGGATTTTATTACCA | ||||||
| rpl32 | Ribosomal Protein L32 | For | GCTCTTCATCGGGCTGTCTA | 77 | |||
| Rev | CTTGGTGAGAGGTCTGAGGG | ||||||
Forward and reverse primer sequences that were used for quantification of expression for specified genes are shown. Analysis using two-way ANOVA compared with the ribosomal proteins, rps13 and rpl132, is shown.
We evaluated five candidate genes for use as a reference (Table 2) based on the following two criteria: (1) to determine how the genes respond to T3 treatment, we used two-way ANOVA on all data points normalized to the highest data point for each gene across all treatments and time points; and (2) we examined stability of potential reference genes using the geNorm (RRID:SCR_006763) and NormFinder (RRID:SCR_003387) analysis tools in Excel (Microsoft). rps13 and rpl32 met our criteria to be used as reference genes, so we evaluated the expression of target genes using the comparative Ct method against the mean expression per brain of these genes.
Table 2.
Candidates evaluated for use as reference genes
| Gene | Percent difference of T3 from Control |
Two-way ANOVA results |
geNorm M-value | NormFinder Stability value | |||
|---|---|---|---|---|---|---|---|
| Day 2 | Day 4 | Time | Treatment | Interaction | |||
| gapdh | 16.4 | 60.0 | 0.576 | 0.025 | 0.266 | 0.607 | 0.0186 |
| ywhaz | 67.6 | 49.2 | <0.001 | <0.001 | 0.125 | 0.568 | 0.0711 |
| hprt1 | 54.9 | 109.9 | 0.542 | <0.001 | 0.421 | 0.563 | 0.0454 |
| rps13 | 1.9 | 19.8 | 0.012 | 0.516 | 0.627 | 0.710 | 0.0819 |
| rpl32 | 13.9 | 30.0 | 0.008 | 0.111 | 0.43 | 0.736 | 0.0692 |
Candidates were evaluated to determine if the genes respond to T3 treatment and for their stability as potential reference genes using geNorm and NormFinder analysis tools.
Statistics.
We used GraphPad Prism (RRID:SCR_002798) to analyze our data for statistical differences. We used regression analysis to evaluate the relationship of optic tectum volume and width/length ratio. Data with only two groups were evaluated with Student's t test. Data sets with more than two groups were evaluated with ANOVA, and post hoc comparisons were made with Tukey's multiple comparisons test. Data sets with two dimensions (e.g., time vs treatment) were evaluated with two-way ANOVA, and post hoc comparisons were made with either Tukey's multiple comparisons test or Dunnett's test when multiple groups were compared with a control group when appropriate. Data sets with repeated measurements (e.g., changes in dendrite morphology) were evaluated with two-way repeated-measures ANOVA and post hoc tests with Sidak's multiple comparison test across treatment groups within the same day. Within-animal differences (e.g., left eye vs right eye coconut oil experiment) were evaluated with paired t tests. We set α = 0.05 for all tests.
Results
T3 treatment changes brain morphology
To determine whether TH treatment affects tadpole brain development, we exposed stage 47 tadpoles to either control solution (Steinberg's rearing solution) or T3 (50 nm in Steinberg's solution), as schematized in Figure 1A. We killed all animals after 6 d, stained the brains with Sytox-O to label nuclei, and imaged them on a confocal microscope. Six days of treatment with T3 induced massive changes in brain morphology (Fig. 1B). The most obvious morphological change was a decrease in the rostrocaudal length of the brain, primarily due to substantial rearrangement of the neural structures of the brain. The telencephalon became more compact and less like two distinct lobes. Areas of the dorsal pretectum descended to more ventral areas of the brain. The optic tectum increased in volume, growing wider while the rostrocaudal length decreased (Fig. 1C–F), and the dorsoventral height of the midbrain increased by ∼40%. Focusing on the optic tectum, we found that T3 induced an increase in the tectal volume (Fig. 1D; p < 0.01, t test) and width/length ratio (Fig. 1E; p < 0.001). We also found that the tectal volume and width/length ratio significantly covaried (Fig. 1F; r2 = 0.57, p < 0.01). These results show that continuous 6 d treatment with T3 alters tectal morphology, leading to an increase in tectal volume, and that the width/length ratio adequately captures that change. These changes suggest that the brain can respond to premature exposure to T3 with metamorphic-like changes in brain morphology (Allen, 1924; Hughes, 1976; Kollros, 1981; Gona et al., 1988; Coen et al., 2007).
T3 increases tectal cell proliferation
The T3-induced increase in optic tectal volume may be attributable to a number of cellular processes, including changes in NPC proliferation and survival. Tectal NPCs are located adjacent to the midbrain ventricle. NPCs give rise to neurons that are subsequently displaced laterally from the ventricle and become the neuronal cell body layers (Gona et al., 1988; Bestman et al., 2012; Fig. 2A). To test the effects of T3 on NPC proliferation and neurogenesis in the optic tectum, we placed tadpoles into either control solution or T3 solution and 24 h later exposed animals to the thymidine analog CldU for 2 h. Tadpoles were killed right after CldU exposure, or at day 3 or day 6 after the CldU pulse, and processed to visualize CldU, as shown in the schematic of the protocol (Fig. 2B). CldU labeling in control and T3-treated animals killed right after the 2 h CldU pulse is strong and is confined to NPCs in the optic tectal proliferative zone adjacent to the ventricle (Fig. 2C, Day 1). Tadpoles treated with T3 for 1 d and killed immediately after CldU treatment have significantly more CldU+ cells (n = 13; 166.4 ± 8.4, mean + SEM) in the ventricular zone than control tadpoles (n = 15; 122.9 ± 8.8; t test, p = 0.00104). On day 3, intensely labeled CldU+ cells are located lateral to the proliferative zone and more weakly labeled cells are located adjacent to the ventricle in control tadpoles. In the day 3 T3-treated tadpoles, intensely labeled CldU+ cells are located laterally from the ventricle, and the intensity of CldU+ immunolabeling in cells closer to the ventricle is substantially weaker than in control animals. On day 6, in control tadpoles, CldU+ cells are located throughout the cell body layer, with a gradient of increasing labeling intensity extending from the ventricle to the lateral edge of the cell body layer. This pattern is consistent with asymmetric division of NPCs and dilution of the CldU label as NPCs in the ventricle continue to divide (Denver et al., 2009; Sharma and Cline, 2010; Bestman et al., 2012). In tecta of day 6 T3-treated tadpoles, few intensely labeled CldU+ cells can be detected at the lateral edge of the cell body layer. CldU+ label in cells adjacent to the ventricle was very weak and only detected with enhanced contrast. Quantification was not possible for tadpoles killed on days 3 and 6, because of the dilution of CldU and decreased immunolabeling intensity. Results from this experiment show that exposure to T3 increases NPC cell proliferation. Continuous treatment with T3 for 6 d dilutes CldU label from continued NPC proliferation, as previously reported (Nicholson and Altman, 1972a; Straznicky and Gaze, 1972; Denver et al., 2009).
Figure 2.

T3 treatment increases NPC proliferation in the optic tectum. A, Dorsal aspect of a Xenopus tadpole head illustrating the major subdivisions of the brain and retinal innervation of the optic tectum. B, Schematic of area highlighted in red box in A illustrating the cellular makeup of the tadpole retinotectal circuit. The contralateral retinal ganglion cell axons (blue) synapse on dendrites of tectal neurons (black nuclei) in the neuropil. NPCs (green nuclei) situated along the ventricle generate neurons that make up the cell body layers. C, Protocol for T3 and CldU treatments, followed by immunohistochemical (IHC) labeling for CldU. Stage 47 tadpoles were placed in either control bath or T3 bath (50 nm). Tadpoles were exposed to CldU for 2 h at the end of the first 24 h. Groups of tadpoles were killed on day 1 (immediately after 2 h CldU exposure), day 3, or day 6. C, Confocal z-projections of representative tecta from tadpoles in each group killed at the designated time point. A high-magnification view of each tectum within the dashed box is shown to the right. Black and white images were inverted so CldU labeling is black. Quantification showed that 1 d treatment with T3 significantly increased tectal NPC proliferation (see Results). CldU labeling in the T3 group progressively decreased over days 3 and 6, consistent with dilution of CldU. n = 6–8 brains per group.
To test the hypothesis that long-term T3 exposure increases proliferation in the tadpole optic tectum throughout the T3 treatment period, we placed stage 47 tadpoles into either control Steinberg's solution or T3 (50 nm) for 7 d (Fig. 3A). Groups of tadpoles from both treatments were killed 2, 4, and 7 d after onset of treatment, and brains were immunostained for pH3, which labels cells in M phase of the cell cycle (Fig. 3B). Long-term treatment with T3 significantly increased the number of pH3+ cells in the ventricular zone on day 2 (p < 0.01), day 4 (p < 0.001), and day 7 (p < 0.01, ANOVA, post hoc Tukey's test), indicating that continuous T3 treatment increases NPC proliferation throughout the exposure period for up to at least 7 d. These data also show that T3 treatment was able to significantly counteract the normal decreased rate of proliferation seen as tadpoles age.
Figure 3.

T3 increases tectal NPC proliferation. A, Protocol for T3 treatments, followed by immunohistochemical (IHC) labeling for pH3. Stage 47 tadpoles were put into either control bath or T3 bath (50 nm) for 7 d. Tadpoles from both groups were killed 2, 4, and 7 d after onset of treatment. B, Representative confocal z-projections of optic tecta immunolabeled for pH3 (green) and counterstained with Sytox-O (red). C, Treatment with T3 significantly increased the number of pH3+ cells in the ventricular zone at all three time points (**p < 0.01, ***p < 0.001). n = 10–14 brains per group.
Local control of endogenous TH metabolism regulates tectal cell proliferation
The previous experiments indicate that exogenous TH increases NPC proliferation in the optic tectum in premetamorphic tadpole stages; however, whether endogenous TH affects proliferation in the CNS at these developmental stages is unknown. To address this issue, we manipulated components of the TH signaling pathway shown in Figure 4A. Animals were treated as schematized in Figure 4B. We placed tadpoles into control Steinberg's solution or Steinberg's solution containing the goitrogen MMI (1 mm), which blocks the synthesis of T4 in the thyroid gland (Fig. 4A). The optic tecta of half the tadpoles were also electroporated with either DIO3 MO or control MO. Tecta of the other half of the tadpoles were electroporated with DIO3 MO or control MO 5 d later (Fig. 4B). Targeted knockdown of DIO3 in the optic tectum is expected to decrease metabolism of active T3 to inactive T2 and thereby increase local T3 signaling (Fig. 4A). Tadpoles were killed 5 d after electroporation, and brains were either labeled with pH3 antibodies or processed for qPCR to test for changes in expression of neural regeneration related protein (nrep), a transcript that is known to increase in response to elevated TH signaling (Das et al., 2006). Figure 4C shows representative images of tecta from animals treated for 5 d with MMI and DIO3 MO. We found that in the day 5 group, DIO3 knockdown without MMI significantly increased the number of pH3+ cells in the tectum (Fig. 4D, ANOVA and Tukey's post hoc test). Treatment with MMI alone significantly decreased the number of pH3+ cells, and the combination of DIO3 knockdown and MMI treatment was intermediate between both DIO3 knockdown alone and MMI alone. These results suggest that DIO3 MO increases local TH signaling and that MMI decreases circulating TH levels. The intermediate response to both DIO3 MO and MMI suggests that 5 days of MMI treatment is not sufficient to deplete residual T4 in the brain so that DIO3 knockdown in the tectum can still increase local T3 signaling. In the day 10 group, in which half of the animals were pretreated with MMI before DIO3 MO electroporation (Fig. 4B, bottom), the overall level of proliferation was lower than the day 5 group, consistent with the normal decrease in proliferation over this interval (Fig. 3C). Tadpoles with DIO3 knockdown alone had more pH3+ cells compared with the other day 10 treatment groups. Importantly, proliferation in the DIO3 MO/MMI treatment group was comparable with that seen with MMI alone. These data suggest that DIO3 knockdown increased local action of TH, which is sufficient to increase proliferation. Furthermore, the data indicate that MMI treatment for 5 d is sufficient to decrease circulating levels of TH, thereby decreasing proliferation, but pretreatment with MMI is required to decrease circulating TH sufficiently, so that DIO3 knockdown cannot increase local TH signaling and increase proliferation. Finally, qPCR showed that DIO3 MO significantly increased midbrain expression of nrep relative to control MO (DIO3 MO, 1.34 ± 0.08; control MO, 1.03 ± 0.08; Mann–Whitney U test, p < 0.05, n = 10 per group), consistent with the idea that DIO3 MO increases proliferation by increasing local TH signaling. Together, the results show that endogenous TH regulates neurogenesis in the optic tectum long before the surge in endogenous levels of circulating TH that promotes metamorphosis. The results further indicate that increasing or decreasing endogenous TH signaling has corresponding effects on tectal cell proliferation, suggesting that the NPC proliferation rate may be homeostatically regulated by mechanisms that govern endogenous TH signaling.
Figure 4.
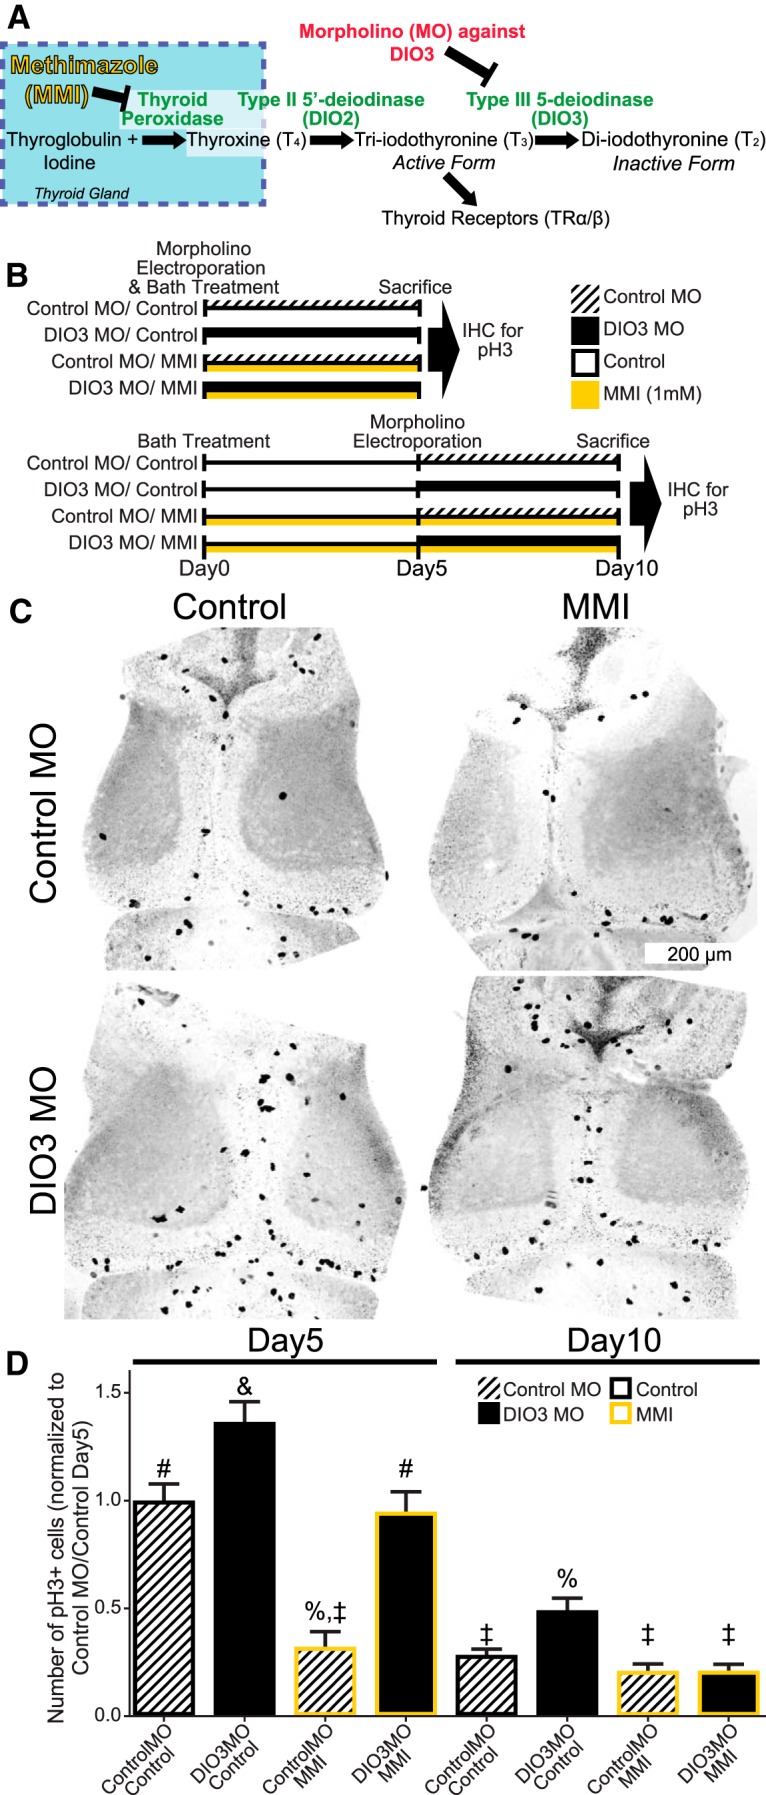
Local control of endogenous TH metabolism regulates tectal NPC proliferation. A, Schematic of TH synthesis and control of local TH action and availability. MMI blocks TH synthesis, and DIO3 expression increases the local availability of T3. B, Timeline of experiment. Tadpoles were placed in control bath or bath containing MMI. Half the tadpoles in each treatment group were electroporated with DIO3 MO or control MO; the other half were electroporated 5 d later. Tadpoles were killed 5 d after electroporation, and brains were labeled for pH3. C, Representative confocal z-projections of tecta showing pH3+ labeling. Images were inverted and contrast was increased to reveal nonlabeled features of the brain. D, Bar graph of the number of pH3+ cells. In the day5 treatment group, DIO3 MO alone significantly increased cell proliferation in the tectum and MMI treatment alone significantly decreased cell proliferation. The combination of DIO3 MO and MMI bath was intermediate between both conditions. In the day10 ControlMO/control bath group, cell proliferation was lower than the corresponding day 5 group. DIO3 MO alone significantly increased tectal cell proliferation relative to control. Cell proliferation in the MMI alone and DIO3MO plus MMI treatment groups were comparable and not different from control for day 5 and day 10 groups. The 10 d treatment with MMI was sufficient to counteract the effect of DIO3 MO on local availability of T3. Symbols above bars indicate significant differences from post hoc analysis. n = 11–18 brains per group.
To test the efficacy of morpholino-mediated knockdown of DIO3 expression, we used an in vivo imaging assay described by Faulkner et al. (2015) that can be used when specific antibodies against the target protein are not available. We electroporated optic tecta of stage 46 tadpoles with two plasmids: pSox2bd::Gal4/UAS::DIO3-t2A-eGFP and UAS::tRFPnls (Fig. 5A). Tadpoles were coelectroporated with either control MO or DIO3 MO. If DIO3 MO blocks translation of the DIO3-t2A-GFP transcript, then we expect to see a decrease in eGFP intensity in RFP+ cells compared with control MO, and some cells may be RFP+ with no detectable GFP. We measured eGFP intensity in tRFP+ cells (Fig. 5B,C) and found that DIO3 MO significantly decreased eGFP expression compared with cells transfected with control MO (Fig. 5D; t test, p < 0.01). DIO3 MO treatment also significantly decreased the percentage of tRFP+ cells that were eGFP+ (Fig. 5E; t test, p < 0.0001).
Figure 5.

Validation of morpholino-mediated DIO3 knockdown. A, Tadpoles were coelectroporated with pSox2bd::gal4-UAS::DIO3-t2A-eGFP and UAS::tRFPnls plasmids and either control morpholino (Control MO, left) or morpholino against DIO3 (DIO3 MO, right). With Control MO, cells express DIO3, eGFP, and tRFPnls. DIO3 MO inhibits translation of DIO3 and eGFP but does not affect tRFPnls expression. B, C, Example images of right tecta (ventricle indicated by dotted line) treated with either Control MO (B) or DIO3 MO (C), illustrating expression of eGFP (green) and tRFPnls (magenta). We analyzed only tRFP+ cells, which were either positive for eGFP (white arrows) or negative (below 3× threshold) for eGFP (blue arrowheads). Cells that expressed only eGFP (yellow arrowheads) were not analyzed. Scale bar, 100 μm. D, DIO3 MO significantly reduced eGFP intensity in tRFP+ cells. E, DIO3 MO significantly reduced the percentage of tRFP + cells that were eGFP+. **p < 0.01, ****p < 0.0001); n = 13–19 brains per group.
Local delivery of T3 to the midbrain alters tectal morphology, cell proliferation, and cell death
Systemic exposure of tadpoles of the stages used in our studies to 50 nm T3 causes gross morphological effects, including changes in the shape of the mouth and head, shortened body length caused by premature tail resorption, and weight loss, because of impaired mobility and feeding behaviors and changes in the gut, consistent with previous studies showing differential spatiotemporal tissue-specific sensitivity to TH (Tata, 1968). These tadpoles typically do not survive longer than 7–10 d, likely because precocious TH-induced changes to the mouth, gut, and lungs are not temporally coordinated with other metamorphic changes, such as limb development. To determine whether T3 mediates changes in tectal development by acting directly on tectal cells and to circumvent ambiguities arising from systemic T3 treatment, we adapted methods from previously published studies (Kaltenbach, 1970; Kaltenbach and Hobbs, 1972; Leatherland, 1987). We injected T3 emulsified in coconut oil directly into the midbrain ventricle. To identify a concentration of T3CO that only affects the brain and not the rest of the body, we tested three concentrations of T3CO (5 mg/ml, 1 mg/ml, 500 μg/ml) compared with two control groups: a group that was injected with ControlCO and a group that was not injected with CO (NoCO). We had a positive control group that was treated with T3 in Steinburg's solution. Tadpoles from each group were killed each day for 7 d to capture T3-mediated changes in tectal development. T3 in Steinberg's solution affected the whole tadpole, inducing changes in craniofacial features (e.g., extension of Meckel's cartilage; Fig. 6A) and a decrease in body length (Fig. 6B), consistent with previous work showing that TH acts throughout the tadpole body to induce restructuring of organs and tissues, including the brain (Denver, 1998; Shi, 2000). The two highest concentrations of T3CO (1 and 5 mg/ml) also significantly decreased body length and affected craniofacial features (Fig. 6A,B). By contrast, the body length and gross morphology of tadpoles injected with 500 μg/ml T3CO were not different from the ControlCO and NoCo groups (Fig. 6A,B).
Figure 6.

Dose-dependent effect of local delivery of T3 on gross morphology and body length. A, Photomicrographs of tadpoles from four designated treatment groups. Tadpoles were treated with T3 (50 mm) in the bath or injected in the brain ventricle with T3CO at three different concentrations. Control animals were reared in control bath or injected with coconut oil without T3 (ControlCO). The inset image at bottom left shows coconut oil droplet (arrow) in the ventricle. B, Bath application of T3 affected the whole tadpole, quantified here as a decrease in body length. The two highest concentrations of T3 CO also significantly decreased body length (2-way ANOVA, effect of treatment, p < 0.001) and changed craniofacial features (see arrowheads in photomicrographs in A). Tadpoles injected with 500 μg/ml T3CO had body length and overall appearance comparable with control groups. n = 8–16 tadpoles per treatment and time point.
We then dissected the brains from the tadpoles used for body-length measurements (described above) and immunostained them for pH3 and Sytox-O (Fig. 7A). Measurements of the tectal width/length ratio showed that all doses of T3CO increased tectal size to a comparable extent (Fig. 7B), which was also similar to the increased tectal size seen in animals exposed to T3 in Steinberg's solution. The lowest dose of T3CO maintained an elevated NPC proliferation rate throughout the 7 d experiment but showed no increase in cell death (Fig. 7C,D). The increase in apoptosis seen with 1 and 5 mg/ml T3CO, as well as with T3 in Steinberg's solution, may either be attributable to indirect systemic effects on feeding behaviors or gut function (Tata, 1968; Denver et al., 2009) or might be similar to increases in cell death that occur during metamorphosis (Kollros and Thiesse, 1985; Gona et al., 1988; Coen et al., 2007). The observation that local 500 μg/ml T3CO induces changes in tectal morphology without affecting body morphology suggests that T3 is acting directly on the brain and that the changes in tectal morphology are not a result of non-neural side effects on the gut or elsewhere in the body. Together, the data in Figures 6 and 7 indicate that local injection of 500 μg/ml T3CO into the midbrain ventricle will allow us to study the effect of local increases in tectal T3 on tectal development.
T3 acts locally to increase cell proliferation in the retina and optic tectum
During metamorphosis, TH acts directly on the retina, inducing asymmetric proliferation to reorient the eye upward (Kaltenbach and Hobbs, 1972; Hoskins and Grobstein, 1984, 1985a,b; Mann and Holt, 2001). T3-mediated effects in the tectum, reported above, may depend on afferent input from retinal ganglion cells. To test whether local T3 delivery to the eye or tectum affects neurogenesis in the tectum or retina, respectively, we injected either T3 500 μg/ml CO or ControlCO into the midbrain ventricle near the tectum or into the left eye (Fig. 8A–C). Tadpoles were killed after 2 d, which is sufficient to detect increased proliferation in the tectal proliferative zone in response to T3 (Fig. 3C). Local delivery of T3CO into the midbrain ventricle increased the number of CldU+ cells in the proliferative zone in the midbrain compared with the control in which ControlCO was injected into the midbrain ventricle (Fig. 8D,E; ANOVA and Tukey's post hoc test, p < 0.001). Furthermore, T3CO injection into the midbrain ventricle did not affect CldU labeling in the retina, nor did T3CO injection into the eye affect proliferation in the brain. These results show that T3 acts directly in the optic tectum to stimulate proliferation.
Figure 8.

T3 acts locally to increase cell proliferation in the retina and optic tectum. A, Timeline of experiment. B, C, Animals were treated with control coconut oil (ControlCO) or T3CO injected into the left eye (B) or into the midbrain ventricle near the tectum (C). Arrowheads point to CO. Note that the coconut oil in B is dyed with Oil Red O to enhance visibility. D, Left column, Diagrams of local CO treatments in the eye or brain. Arrows point to location of CO in the eye or tectum. Red and green mark left and right retinas and their projections, respectively. Right panels, Photomicrographs of sections through the head showing the brain and the eyes immunolabeled for CldU and counterstained with hematoxylin. Arrowheads point to CldU+ cells in the ciliary margin in the eye and proliferative zone in the brain. Insets at bottom right show increased magnification of CldU+ cells in the ventral ciliary margin. E, T3CO delivery to the brain ventricle significantly increased cell proliferation in the midbrain ventricular zone; local T3CO delivery in the eye did not affect proliferation in the midbrain. F, G, Comparisons of the numbers of CldU+ cells in the ciliary margins of the left and right eyes for animals in the four experimental groups (schematized in D, left). Data for dorsal (F) and ventral (G) ciliary margins are shown separately. T3CO treatment in the left eye increased cell proliferation in dorsal (F) and ventral (G) ciliary margins of the left eye. The proliferation rate in the eye was not increased when T3CO was injected into the brain ventricle (G; ANOVA and Tukey's post hoc test,**p < 0.01,***p < 0.001).
Local delivery of T3CO into the left eye increased the number of CldU+ cells in the dorsal (Fig. 8F; paired t test, p < 0.01) and ventral (Fig. 8G; paired t test, p < 0.001) ciliary margins compared with the uninjected right eye. The fact that T3 increased proliferation in both the ventral and dorsal ciliary margins indicates that the retina of stage 47 tadpoles is not yet asymmetrically sensitive to the effects of TH signaling, as seen during metamorphosis (Hoskins and Grobstein, 1984, 1985a), possibly because DIO3 expression is not yet elevated in the dorsal retina, which dampens T3 signaling in retina of older tadpoles (Marsh-Armstrong et al., 1999). These results further indicate that local delivery of T3 in coconut oil effectively limits T3 action to particular parts of a developing neural circuit, leaving other parts unaffected.
Local delivery of T3 expands the proliferative pool of NPCs in the tectum
Prior studies suggest that hyperthyroid rat pups have a transient increase in cell proliferation and that elevated TH signaling triggers NPCs in cerebellum to prematurely exit from the cell cycle and differentiate into neurons (Nicholson and Altman, 1972a). Our data in Figure 2 suggest that tectal NPCs continue to divide in the presence of T3. To directly test the effect of T3 on NPC proliferation and differentiation in vivo, we conducted in vivo time-lapse imaging experiments to determine the effects of local administration of T3 on cell proliferation and neuronal differentiation in tadpole tecta. We electroporated the optic tecta of stage 46 tadpoles with pSox2bd::GFP plasmids to express GFP in NPCs and their neuronal progeny (Bestman et al., 2012) and on the same day injected either ControlCO or T3CO into the midbrain ventricle (Fig. 9A). Starting the following day, we imaged the GFP-expressing NPCs and neurons at daily intervals for 3 d on a custom-built laser-scanning two-photon microscope. This electroporation procedure sparsely labels NPCs in the ventricular zone with GFP, so their proliferation and differentiation into neurons can be visualized over subsequent days, while still maintaining sufficient levels of GFP for imaging (Bestman et al., 2012), as schematized (Fig. 9B) and illustrated in Figure 9C and Movie 1. Representative images of GFP-expressing NPCs and neurons are shown in single optic tectal lobes from animals treated with ControlCO or T3CO over 3 d of in vivo imaging (Fig. 9D). Increases in the numbers of GFP+ cells and increased complexity of neuronal dendrites and axons can be seen over the time course in control and T3CO-treated tecta. T3CO significantly increased the total number of GFP+ cells by day3 (Fig. 9E; two-way repeated-measures ANOVA, p < 0.05). Separate analyses of NPCs and neurons show that the increase occurred in the NPC population (p < 0.05) but not in the neuronal population (Fig. 9F,G). These data suggest that T3 expands the progenitor pool over the first 3 d of T3 exposure, without increasing neuronal differentiation.
Figure 9.

Local delivery of T3 expands the proliferative pool in the tectum. A, Timeline of experiment. Brains were electroporated with Sox2bd::eGFP reporter plasmids, and the midbrain ventricle was injected with either ControlCO or T3CO (500 μg/ml). Starting the following day, GFP+ cells were imaged daily for 3 d in vivo on a two-photon microscope. B, Schematic of the cellular makeup of the tadpole retinotectal circuit in the left hemisphere. Cells are randomly labeled with GFP, which spreads throughout the cell, including the processes. C, Still image of Movie 1. Two-photon z-projection of a NPC (left) and neuron (right). GFP+ cells were counted and classified as NPCs or neurons based on morphology. NPCs have a distinctive endfoot adjacent to the pial surface of the brain and filopodia along the single process. Young neurons like the one illustrated here have dendritic arbors near the soma and an axon that projects through the tectum with a growth cone at the end. See Movie 1 for more detail. D, Representative two-photon z-projections of images taken of the left tecta from tadpoles treated with ControlCO (top) or T3CO (bottom). E, Plot of change in the relative total number of GFP+ cells. T3CO significantly increased the number of GFP+ cells by day 3 (repeated-measures ANOVA and Sidak's multiple comparison test, *p < 0.05). F, G, Plot of change in the relative number of NPCs (F) and neurons (G). T3CO significantly increased the relative number of NPCs but did not affect the relative number of neurons over 3 days of treatment. n = 14–16 tectal lobes per group.
Two-photon z-projection of a NPC (left) and neuron (right). GFP+ cells were counted and classified as NPCs or neurons based on morphology. NPCs have a distinctive endfoot adjacent to the dorsal surface of the brain and filopodia along the single process. Young neurons like the one illustrated here have dendritic arbors near the soma and an axon that projects through the tectum with a growth cone at the end. (Image from Fig. 9C.)
Local delivery of T3 significantly increases optic tectal neuronal differentiation
To determine how longer exposures to T3 change tectal cell fate, we injected stage 46 tadpole midbrain ventricles with either ControlCO or T3CO and then electroporated them 6 d later (late stage 47 to early stage 48) with pSox2::GFP plasmids. We collected in vivo two-photon time-lapse images of the tecta once per day over the following 3 d (Fig. 10A). Representative images of control and T3CO-treated tectal lobes are shown in Figure 10C over the 3 d time course of the experiment. Quantitative analysis showed that the number of GFP+ cells did not vary between the two groups over the 3 d of imaging (Fig. 10D), but distinguishing NPCs from neurons showed that the relative numbers of NPCs significantly decreased over 3 d in tecta treated with T3CO (Fig. 10E; two-way repeated-measures ANOVA, p < 0.05), and there is a corresponding increase in GFP+ neurons (Fig. 10F; p < 0.05). T3CO increased the proportion of GFP+ cells that were neurons relative to controls, even on the first day of imaging after 24 h of T3CO treatment. Furthermore, the relative proportion of neurons in the tecta treated with T3CO continued to increase over the next 2 d of imaging (Fig. 10G). The relative increase in neurons was balanced by a corresponding decrease in the proportion of NPCs, as the NPCs change fate and differentiate into neurons. The time-lapse imaging data in Figures 9 and 10 suggest that T3 initially promotes NPC proliferation and after a delay promotes NPCs to exit the cell cycle and differentiate into neurons. The data also suggest that under control conditions the relative rate of differentiation of NPCs into neurons is lower than in the presence of T3.
Figure 10.

Local delivery of T3 increases neuronal differentiation. A, Timeline of experiment. The midbrain ventricle was injected with either ControlCO or T3CO (500 μg/ml). After 6 d, brains were electroporated with GFP reporter plasmids. GFP+ cells were imaged in vivo on a two-photon microscope daily for 3 d. B, Schematic of the cellular makeup of the tadpole retinotectal circuit in the left hemisphere. Cells are randomly labeled with GFP, which spreads throughout the cell, including the processes. C, Z-projections of images taken of the left tecta from tadpoles treated with ControlCO (top) or T3CO (bottom). GFP+ cells were counted and classified as NPCs or neurons. D, The number of GFP+ cells was comparable in T3CO-treated (n = 14 tecta) and ControlCO-treated (n = 16 tecta) animals over the 3 d of imaging. E, F, Plot of change in the relative number of NPCs (E) and neurons (F) over 3 days in vivo. T3CO significantly decreased the relative number of NPCs and increased the relative number of neurons on day 3 compared with controls. G, T3CO increased the proportion of GFP+ cells that were neurons compared with ControlCO on all 3 d examined (repeated-measures ANOVA and Sidak's multiple comparison test, *p < 0.05).
We also analyzed the effect of T3CO on differentiation by immunolabeling for HuC/D, a neuron-specific marker, in GFP-expressing cells after pSox2bd::GFP electroporation, using the experimental protocol shown in Figure 11A. Animals were injected in the midbrain ventricle with ControlCO or T3CO. Six days later, optic tecta were electroporated with pSox2bd::GFP, and animals were killed after 3 d and immunolabeled for HuC/D and GFP. Representative confocal images of tecta treated with ControlCO or T3CO are shown in Figure 11B. We identified GFP+ cells that were HuC/D positive, as neurons (Fig. 11C and Movie 2), and GFP+ cells along the ventricle that were HuC/D negative as NPCs (Fig. 11D). T3CO increased the proportion of GFP+ cells that were HuC/D+ (i.e., neurons) relative to the ControlCOs (Fig. 11E; p < 0.01), corroborating the observations from the in vivo imaging experiments. Together, the experiments in Figures 9–11 indicate that local delivery of T3 to the midbrain rapidly expands the progenitor pool and subsequently enhances differentiation of NPCs into neurons.
Figure 11.

Local delivery of T3 increases tectal cell differentiation. A, Timeline of experiment. The protocol was similar to the experiment in Figure 10, except that tectal neuronal differentiation was evaluated using immunohistochemical labeling (IHC) for HuC/D, a neuron-specific marker (purple), and for GFP (green). B, Confocal z-projections of representative tecta from the ControlCO and T3CO groups. C, D, GFP+ neurons were positive for HuC/D immunolabel (C, arrowhead), whereas GFP+ NPCs were HuC/D negative (D, arrow) and located in the HuC/D-free proliferative zone. See Movie 2. E, Local T3CO treatment increased the proportion of neurons (GFP+ and Hu+; t test, **p < 0.01). n = 18–19 tecta hemispheres per group.
GFP+ neurons were positive for HuC/D immunolabel, whereas GFP+ NPCs were HuC/D negative and located in the HuC/D-free proliferative zone.
T3 treatment increases dendritic arborization in tectal neurons
Optic tectal neurons typically elaborate complex dendritic arbors over 5 d, after which arbor growth rate stabilizes (Wu and Cline, 1998; He et al., 2016). Our data show that T3 treatment induces a change in tectal morphology 4 d after onset of treatment (Figs. 1, 7), suggesting that TH may have a rapid effect on neuronal structure. To assess whether structurally stable dendritic arbors are sensitive to T3, we sparsely electroporated optic tecta of stage 46 tadpoles with p-actinin::GAL4/UAS::eGFP to label NPCs and 6 d later collected in vivo time-lapse two-photon images of GFP-labeled neurons using the protocol shown in Figure 10A. Immediately after collecting the first image, the animals were divided into two groups, and the midbrain ventricle was injected with either ControlCO or T3CO. Tecta were then imaged at daily intervals over the following 3 d (Fig. 12A). Representative images and reconstructions of neurons from ControlCO- and T3CO-treated tecta are shown in Figure 12B. Total dendritic branch length on day 0 did not differ significantly between the two groups (ControlCO, 627 ± 46 μm; T3CO, 511 ± 100 μm; t test, p = 0.28) and was comparable with that seen in prior studies (Nedivi et al., 1998; Wu and Cline, 1998; Chiu et al., 2008). The sample control neuron has a complex dendritic arbor on the first day of imaging, and the arbor structure remains relatively stable over the next 3 d of imaging in vivo. By contrast, the representative T3CO neuronal arbor was also complex at the first image, before T3CO treatment, but dramatically increased dendritic arbor complexity over the following 3 d of imaging during exposure to T3. Quantification of dendritic branch tip numbers and total dendritic branch length showed that T3CO increased in dendritic branch tip number (Fig. 12C) and total dendritic arbor length (Fig. 12D), so they were significantly greater than controls on days 2 and 3 after T3CO treatment. These results show that tectal neurons with structurally stable dendritic arbors respond to local increases in T3 by rapidly increasing dendritic arbor complexity.
Figure 12.

Local T3 treatment increases tectal cell dendritic arbor elaboration. A, Timeline of experiment. Brains were sparsely electroporated with GFP reporter plasmids. After 6 d, two-photon images of individual GFP+ neurons were collected as a baseline. The midbrain ventricle was then injected with either ControlCO or T3CO (500 μg/ml), and GFP+ neurons were imaged daily for the following 3 d. B, Z-projections (top) and dendritic arbor reconstructions (bottom) of GFP+ tectal cells treated with ControlCO or T3CO. Scale bar, 50 μm. C, D, T3CO significantly increased dendritic branch tip number (C) and total dendritic arbor branch length (D) over the 3 d of imaging. Data are normalized to day 0 (repeated-measures ANOVA and Sidak's multiple comparison test, *p < 0.05, ***p < 0.001). n = 7–11 arbors per group.
T3 induces changes in gene expression pertaining to proliferation and differentiation
The results above indicate that T3 treatment increases tectal cell proliferation and neuronal differentiation and enhances dendritic arbor growth even in relatively stable neurons. TH treatment induces the expression of hundreds of genes in the brains of stage 52–54 Xenopus tadpoles (Denver et al., 1997; Das et al., 2006). We tested whether T3 changes the expression of genes known to affect aspects of proliferation and neuronal differentiation by performing qPCR on mRNA extracted from brains taken from tadpoles treated with T3 (50 nm) in Steinberg's solution for 2 or 4 d or controls, as schematized in Figure 13A. First, we evaluated five potential reference genes using two-way ANOVA across hormone treatment and time, as described in Materials and Methods. The percentage difference in expression for each potential reference gene in T3-treated tadpole brains was higher than the control at both time points (Table 2), but only three of these genes (gapdh, ywhaz, hprt1) were significantly affected by T3. Expression of the two other genes (rps13 and rpl32) was significantly affected by time, as was expression of ywhaz. We examined the stability of the genes using two analysis tool packages available for Excel. Both analyses suggested that all five genes were relatively stable, with geNorm M values <1 and NormFinder stability values <0.1. Thus, all the potential reference genes tested in this study had similar stability. Given that our primary interest was to identify differences in gene expression in response to hormone treatment, we used rps13 and rpl32, because they showed no significant effect of T3 treatment on their expression.
Figure 13.
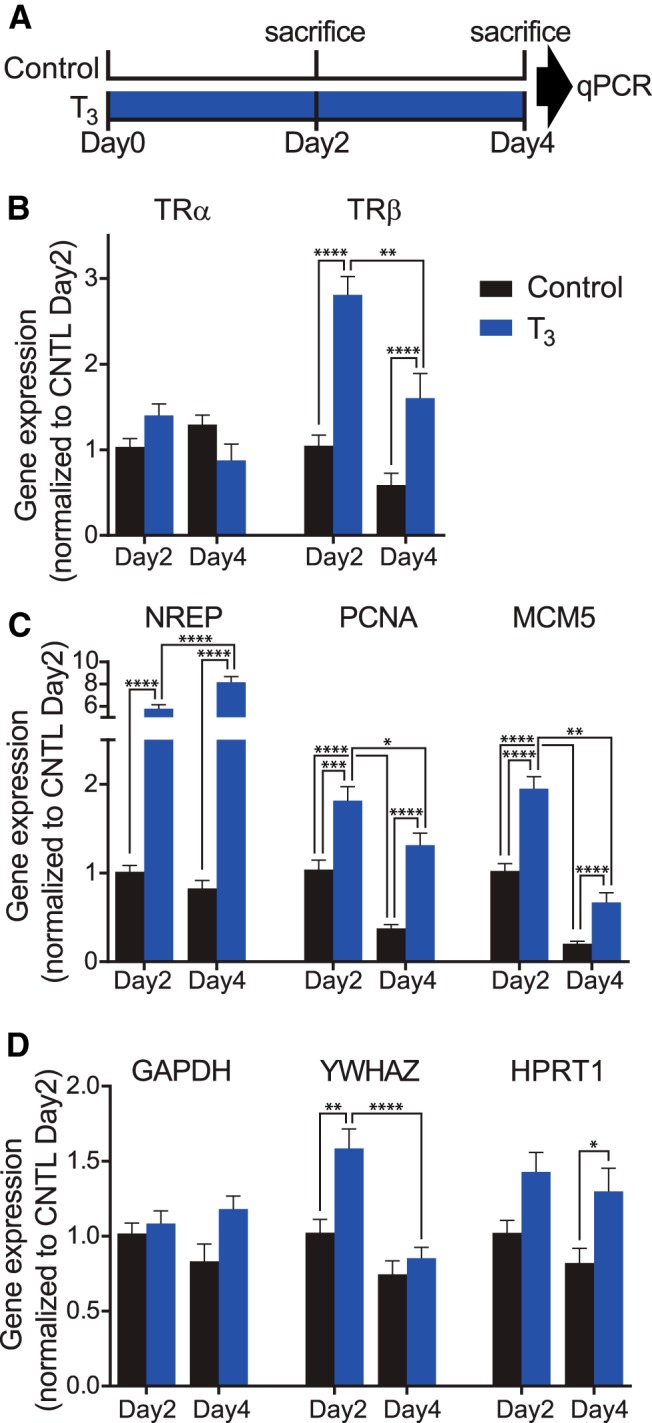
T3 induces genes relevant to TH signaling and brain development. A, Tadpoles were placed into either control bath or T3 bath for either 2 or 4 d and killed. mRNA was extracted from brains and analyzed via qPCR. B, Two-way ANOVA showed a significant interaction effect for time and treatment for trα expression, but post hoc analysis did not return specific differences between groups. T3 treatment significantly increased trβ expression on days 2 and 4 relative to controls. C, T3 treatment significantly increased expression of nrep, pcna, and mcm5 on days 2 and 4 relative to control. Also of note is that expression of pcna and mcm5 in control bath tadpoles significantly decreased from day 2 to day 4. D, Two-way ANOVA showed a significant interaction effect for hormone treatment; T3 treatment increased expression of putative reference genes gapdh, ywhaz, and nrpt1 relative to control. Post hoc analysis showed significant differences between specific groups for expression of ywhaz and nrpt1. n = 8 brains per group.
We examined the effects of time and hormone treatment on expression of eight genes using the comparative ΔΔCt method with the average expression of rps13 and rpl32 as a reference. Expression of trα followed a significant interaction effect, with T3 inducing a marginal increase in expression on day2 and a marginal decrease in expression on day4 (Fig. 13A). It has been previously shown that 4 d of T3 treatment decreases trα expression in Xenopus tropicalis tadpole brains (Duarte-Guterman and Trudeau, 2010). T3 treatment increased expression of trβ approximately threefold on both day 2 and day 4 relative to control (Fig. 13B). T3 treatment increased the expression of nrep, which is highly expressed throughout rat prenatal brain tissue and in adult brains in the subgranular zone in the dentate gyrus and in the subventricular zone (Studler et al., 1993). nrep expression increased sixfold and eightfold on days 2 and 4, respectively (Fig. 13C). T3 also increased expression of proliferating cell nuclear antigen (pcna) and minichromosome maintenance complex component 5 (mcm5; Fig. 13C), both of which are increased in proliferating cells (Maga and Hubscher, 2003; Ryu and Driever, 2006). This suggests that T3 activates the molecular pathways necessary for increased neuronal proliferation, consistent with experiments described above. Also of note is that expression of pcna and mcm5 in the control groups significantly decreased from day 2 to day 4, consistent with the decrease in proliferation seen over this interval in control animals (Sharma and Cline, 2010), and in the presence of T3 (Figs. 3C, 4D). We also examined the expression of putative reference genes. As mentioned above, two-way ANOVA showed that gapdh, ywhaz, and hprt1 all significantly increased expression in response to T3 treatment (Table 2); however, post hoc analysis indicated that significant differences between groups were only observed for expression of ywhaz and hprt1 (Fig. 13D). It is possible that changes in expression of these genes are related to their regulation of cellular metabolism. T3-induced increase in gapdh expression has been reported in brains of Silurana tropicalis tadpoles (Duarte-Guterman and Trudeau, 2010). These data show that exogenous treatment with T3 induces substantial changes in gene expression, including genes that regulate TH signaling (trβ), neurite outgrowth (nrep), and proliferation (pcna and mcm5) and even genes that are typically used for reference (gapdh, ywhaz, hprt1).
Discussion
Our data lead to three major conclusions regarding where and when TH acts on developing brain cells. First, the brain is sensitive to increases in TH signaling at developmental stages when functional neural circuits are first forming. Second, local TH signaling rapidly alters the fate of NPCs by initially expanding the tectal progenitor pool and then increasing NPC differentiation into neurons. Third, increased TH signaling enhances dendritic arbor elaboration in differentiated neurons. Together, these data show that endogenous TH locally regulates cell fate and neuronal development during early brain development.
Several lines of evidence indicate that TH regulates multiple aspects of neurogenesis, including cell proliferation, survival, migration, and neuronal differentiation in the later stages of mammalian brain development, as shown in rodent cerebellum, hippocampus, and cortical structures (Legrand, 1979; Madeira et al., 1991; Martinez-Galan et al., 1997, 2004; Mohan et al., 2012; Nicholson and Altman, 1972a,b,c). The spatial and temporal aspects of TH signaling are controlled by mechanisms that regulate TH bioavailability, including changes in DIO3 expression (Chatonnet et al., 2011; Peeters et al., 2013). Our experiments specifically address the question of whether TH signaling affects neurogenesis at relatively early stages of brain development when circuits are first assembling. Global increases in TH signaling widely affect tadpole morphology, with different tissues and different brain regions showing differential sensitivity to TH, as previously reported (Tata, 1968). This brain region-specific sensitivity to TH likely reflects local regulation of mechanisms controlling TH signaling. Our data show that both global and local increases in TH signaling increased tectal cell proliferation by expanding the pool of NPCs and that blocking endogenous TH production with MMI reduced tectal cell proliferation. These observations show that tectal cell proliferation at these early stages of development is sensitive to local changes in TH signaling and that dysregulation of endogenous TH signaling affects NPC proliferation in the CNS. Furthermore, increased TH signaling counteracts the normal decrease in tectal cell proliferation between stages 46 and 48 (Sharma and Cline, 2010). The TH-induced expansion of the proliferative pool occurs by increasing the number of cell divisions of each NPC, indicated by dilution of CldU label in T3-treated tadpole brains (Nicholson and Altman, 1972a; Denver et al., 2009).
The T3-induced expansion of the progenitor pool does not lead to an immediate increase in neurons. We combined local delivery of T3 with time-lapse in vivo imaging experiments, in which we follow the fate of GFP-labeled NPCs for periods over 9 d of local T3 exposure. This showed a rapid increase in NPCs in response to T3, with no change in neuron number over the first 3 d of treatment, followed by a decrease in the proportion of GFP+ NPCs and an increase in the proportion of GFP+ neurons between 7 and 9 d after the onset of treatment. The delayed effect on differentiation suggests that T3 affects NPC fate differently over time; initially T3 maintains NPCs in the cell cycle, after which T3 triggers a change in cell fate to generate differentiated neurons. The mechanisms underlying the different responses of tectal NPCs to TH over time remain to be elucidated.
Hyperthyroidism affects dendritic arbor growth in mammalian neurons, as is well documented in Purkinje cells both in vivo and in vitro (Nicholson and Altman, 1972b; Legrand, 1979; Heuer and Mason, 2003; Koibuchi, 2013). Furthermore, treatment of hypothyroid animals with TH increases dendritic arbor growth (Legrand, 1979). Our in vivo imaging demonstrated that T3 treatment increased dendritic arborization nearly twofold in tectal neurons that were already 6 d old, which normally have relatively stable arbors (Wu and Cline, 1998; He et al., 2016). Many studies have demonstrated a correlation between increased dendritic arbor complexity and increased synaptic inputs. For instance, electron microscopic studies have shown that virtually all terminal dendritic branches in optic tectal neurons receive synaptic inputs (Li et al., 2011), and electrophysiological studies show that mature tectal neurons with complex dendritic arbors have more synaptic inputs (Wu et al., 1996; Niell et al., 2004; Akerman and Cline, 2006; Haas et al., 2006; Sanchez et al., 2006; Shen et al., 2009, 2011). Together, these studies suggest that the T3-mediated increase in dendritic arborization may correlate with increased synaptic connectivity within the tectal circuit. Another interesting possibility is that the TH-mediated increase in tectal cell dendrite arbor size may retrogradely increase elaboration of retinal ganglion cell axon arbors, similar to the effects of CPG15 expression in tectal neurons (Cantallops et al., 2000). Therefore, TH signaling is expected to affect several aspects of retinotectal circuit function that are sensitive to dendritic arbor size and synaptic connectivity, including the size of visual receptive fields, visual information processing and visually guided behavior, as well as multisensory integration (Tao and Poo, 2005; Bestman and Cline, 2008; Bestman et al., 2008; Deeg et al., 2009; Pratt and Aizenman, 2009; Shen et al., 2011, 2014).
One mechanism that may facilitate T3-induced dendritic growth is a change in activity of the small GTPases, including RhoA (Van Aelst and Cline, 2004). Our qPCR data show that nrep expression increased nearly sixfold within 2 d of T3 treatment, consistent with previous results (Das et al., 2006). nrep is ubiquitously and highly expressed during the late stages of fetal brain development in mice and decreases postnatally except in the cerebellum, hippocampus, and subventricular zone, all areas where cell proliferation persists after birth (Studler et al., 1993). NREP promotes neurite outgrowth in PC12 cells and in cultured rodent hippocampal neurons by a mechanism that is blocked by activation of Rho kinase, a downstream effector of RhoA (Fujitani et al., 2004). Time-lapse in vivo imaging studies indicate that Xenopus tectal cell dendritic arbors elaborate by decreasing RhoA activity and increasing Rac1 and cdc42 activity downstream of visually driven glutamatergic activity (Li et al., 2000, 2002; Sin et al., 2002). Together, these data suggest that a T3-induced increase in NREP may contribute to tectal neuron dendritic arborization by decreasing Rho kinase activity and modulating cytoskeletal rearrangements downstream of glutamatergic synaptic input (Van Aelst and Cline, 2004). A similar mechanism may operate in Purkinje cells; RhoA and Rac1 are highly expressed in Purkinje cells in fetal brain, but RhoA expression in Purkinje cells decreases postnatally (Richard et al., 2008), correlating with increased dendritic arbor elaboration.
The spatial and temporal control of TH signaling during brain development is tightly regulated by changes in expression of TRs, deiodinases, and TH transporters (Chatonnet et al., 2011; Peeters et al., 2013). DIO3 is highly expressed in neurogenic regions of the tadpole midbrain (Morvan Dubois et al., 2006) and at early stages of mammalian brain development (Chatonnet et al., 2011). Furthermore, DIO3 expression is homeostatically regulated by T3, such that high T3 increases DIO3 expression, which effectively decreases local T3 levels (Chatonnet et al., 2011). We show that TH acts locally in the midbrain to increase tectal NPC proliferation, neuronal differentiation, and dendritic arbor elaboration. T3CO injected into the midbrain ventricle increased proliferation locally but did not affect the eye, and vice versa. Moreover, electroporating DIO3 morpholinos into the tectum increased tectal cell proliferation. Conversely, the goitrogen MMI reduced tectal cell proliferation by decreasing circulating T4. Our observation that tectal DIO3 knockdown reverses the effects of 5 d MMI treatment indicates that local DIO3 knockdown increased tectal T3 levels sufficiently to affect NPC fate, despite systemic MMI-dependent decreased T4 levels. This combination of treatments demonstrates the potency of DIO3 in regulating local TH signaling. By contrast, stage 41 tadpoles (2–3 d younger than tadpoles our experiments) treated with TH do not exhibit increased neural cell proliferation, even though chemically blocking TH signaling at these stages decreased proliferation (Fini et al., 2012). These experiments emphasize the dynamic regulation of TH signaling in the brain. High DIO3 expression during embryonic and premetamorphic tadpole stages (Morvan Dubois et al., 2006; Tindall et al., 2007) indicates that TH signaling is tempered during early brain development, as previously noted in mammalian development (Chatonnet et al., 2011). These results indicate that homeostatic control of local T3 action within the optic tectum normally maintains tectal cell neurogenesis within certain tolerances. Although DIO3 expression is regulated by T3 levels (Mann and Holt, 2001; Chatonnet et al., 2011), the identity of feedback signals that trigger homeostatic control of cell proliferation remains an important open question.
In conclusion, we demonstrated that local TH signaling affects brain development at tadpole stages when animals must establish neural circuits necessary to forage for food and avoid predators. Using spatial and temporal control over TH signaling components, including targeted delivery of DIO3 morpholinos to the tectum and local delivery of T3 in coconut oil, combined with time-lapse in vivo imaging to identify distinct responses to T3 in NPCs and neurons over the T3 exposure time, we show that TH signaling regulates neural cell proliferation and differentiation and, separately, that T3 induces a large-scale increase in structural complexity in neuronal dendritic arbors that had already reached a growth plateau. These data indicate that local exposure of the optic tectum to T3 mediates distinct effects in target cells at different points in the life of NPCs and neurons.
Footnotes
This work was supported by grants from the National Institutes of Health (EY011261 and P30 EY019005 to H.T.C. and K99 ES022992 to C.K.T.), an endowment from the Hahn Family Foundation to H.T.C., and a California Institute of Regenerative Medicine fellowship to C.K.T. We thank Dr. Robert Denver and members of the Cline laboratory for comments and discussion on this manuscript.
References
- Akerman CJ, Cline HT. Depolarizing GABAergic conductances regulate the balance of excitation to inhibition in the developing retinotectal circuit in vivo. J Neurosci. 2006;26:5117–5130. doi: 10.1523/JNEUROSCI.0319-06.2006. [DOI] [PMC free article] [PubMed] [Google Scholar]
- Allen BM. Brain development in anuran larvae after thyroid or pituitary gland removal. Endocrinology. 1924;8:639–651. doi: 10.1210/endo-8-5-639. [DOI] [Google Scholar]
- Anderson GW. Thyroid hormones and the brain. Front Neuroendocrinol. 2001;22:1–17. doi: 10.1006/frne.2000.0208. [DOI] [PubMed] [Google Scholar]
- Bernal J. Thyroid hormone receptors in brain development and function. Nat Clin Pract Endocrinol Metab. 2007;3:249–259. doi: 10.1038/ncpendmet0424. [DOI] [PubMed] [Google Scholar]
- Bestman J, Santos da Silva J, Cline HT. Dendrite development. In: Stuart G, Spruston N, Hausser M, editors. Dendrites. Oxford: Oxford UP; 2008. pp. 69–94. [Google Scholar]
- Bestman JE, Cline HT. The RNA binding protein CPEB regulates dendrite morphogenesis and neuronal circuit assembly in vivo. Proc Natl Acad Sci U S A. 2008;105:20494–20499. doi: 10.1073/pnas.0806296105. [DOI] [PMC free article] [PubMed] [Google Scholar]
- Bestman JE, Cline HT. Morpholino studies in Xenopus brain development. Methods Mol Biol. 2014;1082:155–171. doi: 10.1007/978-1-62703-655-9_11. [DOI] [PubMed] [Google Scholar]
- Bestman JE, Lee-Osbourne J, Cline HT. In vivo time-lapse imaging of cell proliferation and differentiation in the optic tectum of Xenopus laevis tadpoles. J Comp Neurol. 2012;520:401–433. doi: 10.1002/cne.22795. [DOI] [PMC free article] [PubMed] [Google Scholar]
- Bestman JE, Huang LC, Lee-Osbourne J, Cheung P, Cline HT. An in vivo screen to identify candidate neurogenic genes in the developing Xenopus visual system. Dev Biol. 2015;408:269–291. doi: 10.1016/j.ydbio.2015.03.010. [DOI] [PMC free article] [PubMed] [Google Scholar]
- Cantallops I, Haas K, Cline HT. Postsynaptic CPG15 promotes synaptic maturation and presynaptic axon arbor elaboration in vivo. Nat Neurosci. 2000;3:1004–1011. doi: 10.1038/79823. [DOI] [PubMed] [Google Scholar]
- Chatonnet F, Picou F, Fauquier T, Flamant F. Thyroid hormone action in cerebellum and cerebral cortex development. J Thyroid Res. 2011;2011:145762. doi: 10.4061/2011/145762. [DOI] [PMC free article] [PubMed] [Google Scholar]
- Chiu SL, Chen CM, Cline HT. Insulin receptor signaling regulates synapse number, dendritic plasticity, and circuit function in vivo. Neuron. 2008;58:708–719. doi: 10.1016/j.neuron.2008.04.014. [DOI] [PMC free article] [PubMed] [Google Scholar]
- Choi J, Suzuki KT, Sakuma T, Shewade L, Yamamoto T, Buchholz DR. Unliganded thyroid hormone receptor alpha regulates developmental timing via gene repression in Xenopus tropicalis. Endocrinology. 2015;156:735–744. doi: 10.1210/en.2014-1554. [DOI] [PMC free article] [PubMed] [Google Scholar]
- Coen L, Le Blay K, Rowe I, Demeneix BA. Caspase-9 regulates apoptosis/proliferation balance during metamorphic brain remodeling in Xenopus. Proc Natl Acad Sci U S A. 2007;104:8502–8507. doi: 10.1073/pnas.0608877104. [DOI] [PMC free article] [PubMed] [Google Scholar]
- Das B, Cai L, Carter MG, Piao YL, Sharov AA, Ko MS, Brown DD. Gene expression changes at metamorphosis induced by thyroid hormone in Xenopus laevis tadpoles. Dev Biol. 2006;291:342–355. doi: 10.1016/j.ydbio.2005.12.032. [DOI] [PubMed] [Google Scholar]
- Deeg KE, Sears IB, Aizenman CD. Development of multisensory convergence in the Xenopus optic tectum. J Neurophysiol. 2009;102:3392–3404. doi: 10.1152/jn.00632.2009. [DOI] [PMC free article] [PubMed] [Google Scholar]
- Denver RJ. The molecular basis of thyroid hormone-dependent central nervous system remodeling during amphibian metamorphosis. Comp Biochem Physiol C. 1998;119:219–228. doi: 10.1016/s0742-8413(98)00011-5. [DOI] [PubMed] [Google Scholar]
- Denver RJ, Pavgi S, Shi YB. Thyroid hormone-dependent gene expression program for Xenopus neural development. J Biol Chem. 1997;272:8179–8188. doi: 10.1074/jbc.272.13.8179. [DOI] [PubMed] [Google Scholar]
- Denver RJ, Ouellet L, Furling D, Kobayashi A, Fujii-Kuriyama Y, Puymirat J. Basic transcription element-binding protein (BTEB) is a thyroid hormone-regulated gene in the developing central nervous system—evidence for a role in neurite outgrowth. J Biol Chem. 1999;274:23128–23134. doi: 10.1074/jbc.274.33.23128. [DOI] [PubMed] [Google Scholar]
- Denver RJ, Hu F, Scanlan TS, Furlow JD. Thyroid hormone receptor subtype specificity for hormone-dependent neurogenesis in Xenopus laevis. Dev Biol. 2009;326:155–168. doi: 10.1016/j.ydbio.2008.11.005. [DOI] [PubMed] [Google Scholar]
- Duarte-Guterman P, Trudeau VL. Regulation of thyroid hormone-, oestrogen- and androgen-related genes by triiodothyronine in the brain of Silurana tropicalis. J Neuroendocrinol. 2010;22:1023–1031. doi: 10.1111/j.1365-2826.2010.02047.x. [DOI] [PMC free article] [PubMed] [Google Scholar]
- Eayrs JT. The cerebral cortex of normal and hypothyroid rats. Acta Anat. 1955;25:160–183. doi: 10.1159/000141068. [DOI] [PubMed] [Google Scholar]
- Eayrs JT, Taylor SH. The effect of thyroid deficiency induced by methyl thiouracil on the maturation of the central nervous system. J Anat. 1951;85:350–358. [PMC free article] [PubMed] [Google Scholar]
- Faulkner RL, Wishard TJ, Thompson CK, Liu HH, Cline HT. FMRP regulates neurogenesis in tadpoles. Eneuro. 2015;2:e0055. doi: 10.1523/ENEURO.0055-14.2014. [DOI] [PMC free article] [PubMed] [Google Scholar]
- Fini JB, Le Mével S, Palmier K, Darras VM, Punzon I, Richardson SJ, Clerget-Froidevaux MS, Demeneix BA. Thyroid hormone signaling in the Xenopus laevis embryo is functional and susceptible to endocrine disruption. Endocrinology. 2012;153:5068–5081. doi: 10.1210/en.2012-1463. [DOI] [PubMed] [Google Scholar]
- Fujitani M, Yamagishi S, Che YH, Hata K, Kubo T, Ino H, Tohyama M, Yamashita T. P311 accelerates nerve regeneration of the axotomized facial nerve. J Neurochem. 2004;91:737–744. doi: 10.1111/j.1471-4159.2004.02738.x. [DOI] [PubMed] [Google Scholar]
- Gona AG, Uray NJ, Hauser KF. Developmental neurobiology of the frog: proceedings of a symposium in honor of Jerry J. Kollros; December 27–30, 1987; held in New Orleans, Louisiana. New York: Liss; 1988. [Google Scholar]
- Gudernatsch JF. Feeding experiments on tadpoles. I. The influence of specific organs given as food on growth and differentiation. A contribution to the knowledge of organs with internal secretion. Arch Entwicklung Org. 1912;35:457–483. doi: 10.1007/BF02277051. [DOI] [Google Scholar]
- Haas K, Li J, Cline HT. AMPA receptors regulate experience-dependent dendritic arbor growth in vivo. Proc Natl Acad Sci U S A. 2006;103:12127–12131. doi: 10.1073/pnas.0602670103. [DOI] [PMC free article] [PubMed] [Google Scholar]
- Havis E, Le Mevel S, Morvan Dubois G, Shi DL, Scanlan TS, Demeneix BA, Sachs LM. Unliganded thyroid hormone receptor is essential for Xenopus laevis eye development. EMBO J. 2006;25:4943–4951. doi: 10.1038/sj.emboj.7601356. [DOI] [PMC free article] [PubMed] [Google Scholar]
- Heuer H, Mason CA. Thyroid hormone induces cerebellar Purkinje cell dendritic development via the thyroid hormone receptor α1. J Neurosci. 2003;23:10604–10612. doi: 10.1523/JNEUROSCI.23-33-10604.2003. [DOI] [PMC free article] [PubMed] [Google Scholar]
- He HY, Shen W, Hiramoto M, Cline HT. Experience-dependent bimodal plasticity of inhibitory neurons in early development. Neuron. 2016;90:1203–1214. doi: 10.1016/j.neuron.2016.04.044. [DOI] [PMC free article] [PubMed] [Google Scholar]
- Hoskins SG, Grobstein P. Induction of the ipsilateral retinothalamic projection in Xenopus laevis by thyroxine. Nature. 1984;307:730–733. doi: 10.1038/307730a0. [DOI] [PubMed] [Google Scholar]
- Hoskins SG, Grobstein P. Development of the ipsilateral retinothalamic projection in the frog Xenopus laevis. I. Retinal distribution of ipsilaterally projecting cells in normal and experimentally manipulated frogs. J Neurosci. 1985a;5:911–919. doi: 10.1523/JNEUROSCI.05-04-00911.1985. [DOI] [PMC free article] [PubMed] [Google Scholar]
- Hoskins SG, Grobstein P. Development of the ipsilateral retinothalamic projection in the frog Xenopus laevis. III. The role of thyroxine. J Neurosci. 1985b;5:930–940. doi: 10.1523/JNEUROSCI.05-04-00930.1985. [DOI] [PMC free article] [PubMed] [Google Scholar]
- Hughes A. Metamorphic changes in the brain and spinal cord. In: Llinás RR, Precht W, editors. Frog neurobiology: a handbook. Berlin-Heidelberg: Springer; 1976. pp. 856–863. [Google Scholar]
- Kaltenbach JC. Local metamorphic action of thyroxine analogues in Rana pipiens larvae. J Exp Zool. 1970;174:55–63. doi: 10.1002/jez.1401740106. [DOI] [PubMed] [Google Scholar]
- Kaltenbach JC, Hobbs AW. Local action of thyroxine on amphibian metamorphosis. V. Cell division in the eye of anuran larvae effected by thyroxine-cholesterol implants. J Exp Zool. 1972;179:157–166. doi: 10.1002/jez.1401790203. [DOI] [PubMed] [Google Scholar]
- Kelley DB. Sexual differentiation in Xenopus laevis. In: Tinsley R, Kobel H, editors. The biology of Xenopus. Oxford: Oxford UP; 1996. pp. 143–176. [Google Scholar]
- Koibuchi N. The role of thyroid hormone on functional organization in the cerebellum. Cerebellum. 2013;12:304–306. doi: 10.1007/s12311-012-0437-8. [DOI] [PubMed] [Google Scholar]
- Kollros JJ. Metamorphosis, a problem in developmental biology. Ed 2. New York: Plenum; 1981. [Google Scholar]
- Kollros JJ, Thiesse ML. Growth and death of cells of the mesencephalic fifth nucleus in Xenopus laevis larvae. J Comp Neurol. 1985;233:481–489. doi: 10.1002/cne.902330407. [DOI] [PubMed] [Google Scholar]
- Leatherland JF. Thyroid response to ovine thyrotropin challenge in cortisol- and dexamethasone-treated rainbow trout, Salmo gairdneri. Comp Biochem Physiol A Comp Physiol. 1987;86:383–387. doi: 10.1016/0300-9629(87)90347-1. [DOI] [PubMed] [Google Scholar]
- Legrand J. Analysis of the morphogenetic action of thyroid hormone on young rat cerebellum. Arch Anat Microsc Mo rph Exp. 1967;56:205–244. [PubMed] [Google Scholar]
- Legrand J. Morphogenetic actions of thyroid hormones. Trends Neurosci. 1979;2:234–236. doi: 10.1016/0166-2236(79)90091-2. [DOI] [Google Scholar]
- Li J, Erisir A, Cline H. In vivo time-lapse imaging and serial section electron microscopy reveal developmental synaptic rearrangements. Neuron. 2011;69:273–286. doi: 10.1016/j.neuron.2010.12.022. [DOI] [PMC free article] [PubMed] [Google Scholar]
- Li Z, Van Aelst L, Cline HT. Rho GTPases regulate distinct aspects of dendritic arbor growth in Xenopus central neurons in vivo. Nat Neurosci. 2000;3:217–225. doi: 10.1038/72920. [DOI] [PubMed] [Google Scholar]
- Li Z, Aizenman CD, Cline HT. Regulation of rho GTPases by crosstalk and neuronal activity in vivo. Neuron. 2002;33:741–750. doi: 10.1016/S0896-6273(02)00621-9. [DOI] [PubMed] [Google Scholar]
- Madeira MD, Cadete-Leite A, Andrade JP, Paula-Barbosa MM. Effects of hypothyroidism upon the granular layer of the dentate gyrus in male and female-adult rats—a morphometric study. J Comp Neurol. 1991;314:171–186. doi: 10.1002/cne.903140116. [DOI] [PubMed] [Google Scholar]
- Maga G, Hubscher U. Proliferating cell nuclear antigen (PCNA): a dancer with many partners. J Cell Sci. 2003;116:3051–3060. doi: 10.1242/jcs.00653. [DOI] [PubMed] [Google Scholar]
- Mann F, Holt CE. Control of retinal growth and axon divergence at the chiasm: lessons from Xenopus. Bioessays. 2001;23:319–326. doi: 10.1002/bies.1046. [DOI] [PubMed] [Google Scholar]
- Marsh-Armstrong N, Huang H, Remo BF, Liu TT, Brown DD. Asymmetric growth and development of the Xenopus laevis retina during metamorphosis is controlled by type III deiodinase. Neuron. 1999;24:871–878. doi: 10.1016/S0896-6273(00)81034-X. [DOI] [PubMed] [Google Scholar]
- Martinez-Galan JR, Pedraza P, Santacana M, Escobar del Ray F, Morreale de Escobar G, Ruiz-Marcos A. Early effects of iodine deficiency on radial glial cells of the hippocampus of the rat fetus. A model of neurological cretinism. J Clin Invest. 1997;99:2701–2709. doi: 10.1172/JCI119459. [DOI] [PMC free article] [PubMed] [Google Scholar]
- Martinez-Galan JR, del Rey FE, de Escobar GM, Santacana M, Ruiz-Marcos A. Hypothyroidsm alters the development of radial glial cells in the term fetal and postnatal neocortex of the rat. Dev Brain Res. 2004;153:109–114. doi: 10.1016/j.devbrainres.2004.08.002. [DOI] [PubMed] [Google Scholar]
- Mohan V, Sinha RA, Pathak A, Rastogi L, Kumar P, Pal A, Godbole MM. Maternal thyroid hormone deficiency affects the fetal neocorticogenesis by reducing the proliferating pool, rate of neurogenesis and indirect neurogenesis. Exp Neurol. 2012;237:477–488. doi: 10.1016/j.expneurol.2012.07.019. [DOI] [PubMed] [Google Scholar]
- Morvan Dubois G, Sebillot A, Kuiper GG, Verhoelst CH, Darras VM, Visser TJ, Demeneix BA. Deiodinase activity is present in Xenopus laevis during early embryogenesis. Endocrinology. 2006;147:4941–4949. doi: 10.1210/en.2006-0609. [DOI] [PubMed] [Google Scholar]
- Nedivi E, Wu GY, Cline HT. Promotion of dendritic growth by CPG15, an activity-induced signaling molecule. Science. 1998;281:1863–1866. doi: 10.1126/science.281.5384.1863. [DOI] [PMC free article] [PubMed] [Google Scholar]
- Nicholson JL, Altman J. The effects of early hypo- and hyperthyroidism on the development of rat cerebellar cortex. I. Cell proliferation and differentiation. Brain Res. 1972a;44:13–23. doi: 10.1016/0006-8993(72)90362-9. [DOI] [PubMed] [Google Scholar]
- Nicholson JL, Altman J. The effects of early hypo- and hyperthyroidism on the development of the rat cerebellar cortex. II. Synaptogenesis in the molecular layer. Brain Res. 1972b;44:25–36. doi: 10.1016/0006-8993(72)90363-0. [DOI] [PubMed] [Google Scholar]
- Nicholson JL, Altman J. Synaptogenesis in the rat cerebellum: effects of early hypo- and hyperthyroidism. Science. 1972c;176:530–532. doi: 10.1126/science.176.4034.530. [DOI] [PubMed] [Google Scholar]
- Niell CM, Meyer MP, Smith SJ. In vivo imaging of synapse formation on a growing dendritic arbor. Nat Neurosci. 2004;7:254–260. doi: 10.1038/nn1191. [DOI] [PubMed] [Google Scholar]
- Nieuwkoop PD, Faber J. Normal table of Xenopus laevis (Daudin): a systematical and chronological survey of the development from the fertilized egg till the end of metamorphosis. New York: Garland; 1956. [Google Scholar]
- Oppenheimer JH, Schwartz HL. Molecular basis of thyroid hormone-dependent brain development. Endocr Rev. 1997;18:462–475. doi: 10.1210/edrv.18.4.0309. [DOI] [PubMed] [Google Scholar]
- Peeters RP, Hernandez A, Ng L, Ma M, Sharlin DS, Pandey M, Simonds WF, St Germain DL, Forrest D. Cerebellar abnormalities in mice lacking type 3 deiodinase and partial reversal of phenotype by deletion of thyroid hormone receptor alpha1. Endocrinology. 2013;154:550–561. doi: 10.1210/en.2012-1738. [DOI] [PMC free article] [PubMed] [Google Scholar]
- Pratt KG, Aizenman CD. Multisensory integration in mesencephalic trigeminal neurons in Xenopus tadpoles. J Neurophysiol. 2009;102:399–412. doi: 10.1152/jn.91317.2008. [DOI] [PMC free article] [PubMed] [Google Scholar]
- Richard V, Dulon D, Hafidi A. Expression of Rho GTPases Rho-A and Rac1 in the adult and developing gerbil cerebellum. Int J Dev Neurosci. 2008;26:723–732. doi: 10.1016/j.ijdevneu.2008.07.010. [DOI] [PubMed] [Google Scholar]
- Ryu S, Driever W. Minichromosome maintenance proteins as markers for proliferation zones during embryogenesis. Cell Cycle. 2006;5:1140–1142. doi: 10.4161/cc.5.11.2779. [DOI] [PubMed] [Google Scholar]
- Sanchez AL, Matthews BJ, Meynard MM, Hu B, Javed S, Cohen Cory S. BDNF increases synapse density in dendrites of developing tectal neurons in vivo. Development. 2006;133:2477–2486. doi: 10.1242/dev.02409. [DOI] [PubMed] [Google Scholar]
- Sharma P, Cline HT. Visual activity regulates neural progenitor cells in developing Xenopus CNS through Musashi1. Neuron. 2010;68:442–455. doi: 10.1016/j.neuron.2010.09.028. [DOI] [PMC free article] [PubMed] [Google Scholar]
- Shen W, Da Silva JS, He H, Cline HT. Type A GABA-receptor-dependent synaptic transmission sculpts dendritic arbor structure in Xenopus tadpoles in vivo. J Neurosci. 2009;29:5032–5043. doi: 10.1523/JNEUROSCI.5331-08.2009. [DOI] [PMC free article] [PubMed] [Google Scholar]
- Shen W, McKeown CR, Demas JA, Cline HT. Inhibition to excitation ratio regulates visual system responses and behavior in vivo. J Neurophysiol. 2011;106:2285–2302. doi: 10.1152/jn.00641.2011. [DOI] [PMC free article] [PubMed] [Google Scholar]
- Shen W, Liu HH, Schiapparelli L, McClatchy D, He HY, Yates JR, 3rd, Cline HT. Acute synthesis of CPEB is required for plasticity of visual avoidance behavior in Xenopus. Cell Rep. 2014;6:737–747. doi: 10.1016/j.celrep.2014.01.024. [DOI] [PMC free article] [PubMed] [Google Scholar]
- Shi Y-B. Amphibian metamorphosis: from morphology to molecular biology. New York: Wiley; 2000. [Google Scholar]
- Sin WC, Haas K, Ruthazer ES, Cline HT. Dendrite growth increased by visual activity requires NMDA receptor and Rho GTPases. Nature. 2002;419:475–480. doi: 10.1038/nature00987. [DOI] [PubMed] [Google Scholar]
- Straznicky K, Gaze R. The development of the tectum in Xenopus laevis: an autoradiographic study. J Embryol Exp Morphol. 1972;28:87–115. [PubMed] [Google Scholar]
- Studler JM, Glowinski J, Lévi-Strauss M. An abundant mRNA of the embryonic brain persists at a high level in cerebellum, hippocampus and olfactory bulb during adulthood. Eur J Neurosci. 1993;5:614–623. doi: 10.1111/j.1460-9568.1993.tb00527.x. [DOI] [PubMed] [Google Scholar]
- Tao HW, Poo MM. Activity-dependent matching of excitatory and inhibitory inputs during refinement of visual receptive fields. Neuron. 2005;45:829–836. doi: 10.1016/j.neuron.2005.01.046. [DOI] [PubMed] [Google Scholar]
- Tata JR. Early metamorphic competence of Xenopus larvae. Dev Biol. 1968;18:415–440. doi: 10.1016/0012-1606(68)90050-X. [DOI] [PubMed] [Google Scholar]
- Tindall AJ, Morris ID, Pownall ME, Isaacs HV. Expression of enzymes involved in thyroid hormone metabolism during the early development of Xenopus tropicalis. Biol Cell. 2007;99:151–163. doi: 10.1042/BC20060074. [DOI] [PubMed] [Google Scholar]
- Van Aelst L, Cline HT. Rho GTPases and activity-dependent dendrite development. Curr Opin Neurobiol. 2004;14:297–304. doi: 10.1016/j.conb.2004.05.012. [DOI] [PubMed] [Google Scholar]
- Wang Y, Wang Y, Dong J, Wei W, Song B, Min H, Teng W, Chen J. Developmental hypothyroxinaemia and hypothyroidism limit dendritic growth of cerebellar Purkinje cells in rat offspring: involvement of microtubule-associated protein 2 (MAP2) and stathmin. Neuropathol Appl Neurobiol. 2014;40:398–415. doi: 10.1111/nan.12074. [DOI] [PubMed] [Google Scholar]
- Wen L, Shi YB. Unliganded thyroid hormone receptor alpha controls developmental timing in Xenopus tropicalis. Endocrinology. 2015;156:721–734. doi: 10.1210/en.2014-1439. [DOI] [PMC free article] [PubMed] [Google Scholar]
- Wu G, Malinow R, Cline HT. Maturation of a central glutamatergic synapse. Science. 1996;274:972–976. doi: 10.1126/science.274.5289.972. [DOI] [PubMed] [Google Scholar]
- Wu GY, Cline HT. Stabilization of dendritic arbor structure in vivo by CaMKII. Science. 1998;279:222–226. doi: 10.1126/science.279.5348.222. [DOI] [PubMed] [Google Scholar]
- Zoeller RT, Rovet J. Timing of thyroid hormone action in the developing brain: clinical observations and experimental findings. J Neuroendocrinol. 2004;16:809–818. doi: 10.1111/j.1365-2826.2004.01243.x. [DOI] [PubMed] [Google Scholar]
Associated Data
This section collects any data citations, data availability statements, or supplementary materials included in this article.
Supplementary Materials
Two-photon z-projection of a NPC (left) and neuron (right). GFP+ cells were counted and classified as NPCs or neurons based on morphology. NPCs have a distinctive endfoot adjacent to the dorsal surface of the brain and filopodia along the single process. Young neurons like the one illustrated here have dendritic arbors near the soma and an axon that projects through the tectum with a growth cone at the end. (Image from Fig. 9C.)
GFP+ neurons were positive for HuC/D immunolabel, whereas GFP+ NPCs were HuC/D negative and located in the HuC/D-free proliferative zone.