

Abstract
Drug resistance elicited by cancer cells continue to cause huge problems world-wide, for example, tens of thousands of patients are suffering from taxol-resistant human ovarian cancer. However, its biochemical mechanisms remain unclear. Sphingolipid metabolic dysregulation has been increasingly regarded as one of the drug-resistant mechanisms for various cancers, which in turn provides potential targets for overcoming the resistance. In the current study, a well-established LC-MS based sphingolipidomic approach was applied to investigate the sphingolipid metabolism of A2780 and taxol-resistant A2780 (A2780T) human ovarian cancer cell lines. 102 sphingolipids (SPLs) were identified based on accurate mass and characteristic fragment ions, among which 12 species have not been reported previously. 89 were further quantitatively analyzed by using multiple reaction monitoring technique. Multivariate analysis revealed that the levels of 52 sphingolipids significantly altered in A2780T cells comparing to those of A2780 cells. These alterations revealed an overall increase of sphingomyelin levels and significant decrease of ceramides, hexosylceramides and lactosylceramides, which concomitantly indicated a deviated SPL metabolism in A2780T. This is the most comprehensive sphingolipidomic analysis of A2780 and A2780T, which investigated significantly changed sphingolipid profile in taxol-resistant cancer cells. The aberrant sphingolipid metabolism in A2780T could be one of the mechanisms of taxol-resistance.
Ovarian cancer is the most aggressive gynecologic cancer and thus a leading cause of cancer-related mortality in women worldwide1. At present, the most effective strategy for ovarian cancer is combination therapy based on cytoreductive surgery and chemotherapy with taxanes (e.g. taxol), but intrinsic or acquired tumor chemoresistance remains the most important clinical problem and a major obstacle to a successful therapy2. According to a systematic literature review, 69 of the total 137 acquired drug-resistant cell lines were resistant to taxol3. Seventy-five percent of ovarian cancer patients initially respond to platinum or taxane based chemotherapy; however, most of them eventually develop chemotherapy resistance4. Many factors can lead to drug resistance, including increased drug efflux, drug inactivation, alterations in drug target, processing of drug-induced damage, and evasion of apoptosis5. Mechanisms including overexpression of drug resistant associated proteins6 and activation of some signaling pathways7 have been implicated in resistance to taxol, but the overall molecular mechanisms of taxol resistance still need further elucidation.
Sphingolipids (SPLs) are a kind of membrane and intracellular lipids that typically play structural roles and act as signaling molecules and/or modulators of signaling pathways associated with cell survival8. Besides the most widely studied bioactive SPL - ceramide, the relationship between cancer and other SPL has been extensively studied, including sphingosine 1-phosphate (S1P)9, glucosylceramide (GluCer)10, sphingosine and C1P11. Growing evidence showed that sphingolipids are deeply involved in the regulation of apoptosis as well as the apoptosis resistance that is displayed by cancer cells12. Qualitative and quantitative assessment of SPLs could reveal novel biomarkers for early diagnosis of cancer13.
There are several studies focused on the sphingolipidomics of A2780 Human Ovarian Cancer cell line14,15, as well as its fenretinide-resistant16 and multidrug-resistant strains17,18. Valsecchi M et al. have characterized the sphingolipidomes in N-(4-hydroxyphenyl)retinamide (4-HPR) and 4-oxo-N-(4-hydroxyphenyl)retinamide (4-oxo-4-HPR) treated A2780 cells by ESI-MS, revealed that the two drugs differentially affect the early steps of SPL synthesis19. In 4-HPR resistant A2780 cells (A2780/HPR), a remarkable alteration of sphingolipid metabolism with respect to both of the parental sensitive A2780 cells and 2780AD cells has been revealed20. Increasing evidence suggests the change of SPL metabolism can be (one of) the crucial mechanism of drug resistance in A2780 cells. However, till now, there is no sphingolipidomic study on taxol resistant A2780 cells (named as A2780T, TA2780, A2780/Taxol, or A2780/PTX in literature). Therefore, a comprehensive sphingolipidomic study is required for elucidating the mechanisms underlying the resistance of A2780T cells to taxol treatment.
In the current study, SPLs in A2780 and A2780T were comprehensively profiled and quantitatively determined by using a well-established LC-MS approach developed in our lab21. It appears to be a promising tool for viewing overall sphingolipidomic difference between taxol-sensitive and -resistant strain of A2780.
Results
Comprehensive identification of sphingolipids in A2780 cells
Duplicate analyses of pooled samples of A2780 and A2780T cells (QC samples) were carried out to achieve comprehensive profiling of SPLs in these two cell lines. Ultra-high performance liquid chromatography coupled with Q-TOF mass spectrometry (UHPLC-Q-TOF MS) is an effective and sensitive analytical tool to separate and identify SPLs in a complex mixture. By integrating the high efficient separation offered by UHPLC, high-resolution mass spectrum obtained by MS and MS/MS on Q-TOF, as well as comparing the data with those of reference standards and searching against our personal database, totally 102 SPLs have been identified in the pooled samples, among which six ceramides (d18:1/17:3; d18:1/15:3(OH); d18:1/14:3(OH); d18:2/23:1; d18:0/18:3 and d17:0/13:0(OH)), two ceramide-1-phosphates (d18:1/19:0(OH) and d18:1/12:2), one hexosylceramide (d18:1/20:1), and three sphingosines (d16:3; d15:3 and t19:2) are new SPLs. Sixty-seven out of the 102 SPLs were reported for the first time in A2780 cells.
MS signals might be masked by isomeric, isotopic or isobaric ions. For sphingolipidomic profiling of A2780, our improved sphingolipidomic approach showed great potential in differentiating isomeric and isotopic species as that have been observed in PC12 cells21. A major interference in the identification of SPLs is the isomeric species that have exact identical molecular elemental compositions, thus MS/MS data together with optimized separation are essential for discrimination. For instance, the extracted ion chromatogram of m/z 620.5903 at 5 ppm mass accuracy yielded two peaks at 15.894 and 16.061 min. Targeted MS/MS of m/z 620.6 at respective time points gave distinct product ions corresponding to backbone of Cer (d18:1/22:1) (m/z 264.3) and Cer (d18:2/22:0) (m/z 262.3), providing evidence for the identification of these two species (Fig. 1). The targeted ion pairs together with complete chromatographic separation also enabled subsequent quantification of such isomers by using multiple reaction monitoring (MRM) technique. Notably, 4 pairs of isomeric species (A1–A4) were clearly distinguished in our study (Table 1).
Figure 1. Differentiation of isomeric SPLs by targeted MS/MS.

(a) Two peaks were observed at m/z 620.59 in extracted ion chromatogram of TOF MS. Accurate MS/MS data confirmed these peaks corresponding to Cer (d18:1/22:1) and Cer (18:2/22:0) due to the characteristic fragment at 264.3 and 262.3 respectively. In MRM mode, target ion pairs consist of the same parent ion (620.6) but different daughter ions [(b) 264.3 for Cer (d18:1/22:1) and (c) 262.3 for Cer (18:2/22:0)] were employed for the accurate quantitation.
Table 1. Identification and quantification of SPLs in A2780/A2780T cells by using UHPLC-Q-TOF and UHPLC-QQQ MS.
| Class | Name | [M + H]+ m/z | tR (min) | Molecular Formula | Measured Mass | Calculated Mass | Error (ppm) | MS/MS Fragments (m/z) | MRM transitions | |
|---|---|---|---|---|---|---|---|---|---|---|
| SM | d18:1/26:0 | 843.7315 | 18.391 | C49 H99 N2 O6 P | 842.7243 | 842.7241 | 0.23 | 264.2693, 184.0732 | 843.8 | 184.1 |
| d18:1/26:1 | 841.7088 | 17.057 | C49 H97 N2 O6 P | 840.7046 | 840.7084 | −4.52 | 264.2692, 184.0735 | 841.7 | 184.1 | |
| d18:1/25:0 | 829.7152 | 17.641 | C48 H97 N2 O6 P | 828.7085 | 828.7084 | 0.14 | 264.2638, 184.0733 | 829.7 | 184.1 | |
| d18:1/25:1 | 827.6987 | 16.441 | C48 H95 N2 O6 P | 826.6898 | 826.6928 | −3.59 | 264.2655, 184.0736 | 827.7 | 184.1 | |
| d18:1/24:0 | 815.7009 | 16.974 | C47 H95 N2 O6 P | 814.6936 | 814.6928 | 1.01 | 264.2668, 184.0730 | 815.7 | 184.1 | |
| d18:1/24:1 [A1] | 813.6851 | 15.807 | C47 H93 N2 O6 P | 812.6780 | 812.6771 | 1.01 | 264.2697, 184.0735 | 813.7 | 184.1 | |
| d18:1/24:2 | 811.6692 | 14.907 | C47 H91 N2 O6 P | 810.6618 | 810.6615 | 0.35 | 264.2702, 184.0734 | 811.7 | 184.1 | |
| d18:1/24:3 | 809.6528 | 14.173 | C47 H89 N2 O6 P | 808.6456 | 808.6458 | −0.3 | 264.2669, 184.0732 | 809.6 | 184.1 | |
| d18:1/23:0 | 801.6848 | 16.324 | C46 H93 N2 O6 P | 800.6774 | 800.6771 | 0.37 | 264.2674, 184.0731 | 801.7 | 184.1 | |
| d18:1/23:1 [A2] | 799.6689 | 15.174 | C46 H91 N2 O6 P | 798.6615 | 798.6615 | 0.01 | 282.2457, 264.2695, 184.0731 | 799.7 | 184.1 | |
| d18:1/23:2 | 797.6507 | 14.273 | C46 H89 N2 O6 P | 796.6436 | 796.6458 | −2.84 | 264.2667, 184.0731 | 797.6 | 184.1 | |
| d18:1/22:0 | 787.6692 | 15.674 | C45 H91 N2 O6 P | 786.6617 | 786.6615 | 0.32 | 264.2655, 184.0733 | 787.7 | 184.1 | |
| d18:1/22:1 [A3] | 785.6533 | 14.574 | C45 H89 N2 O6 P | 784.6455 | 784.6458 | −0.45 | 264.2688, 184.0731 | 785.7 | 184.1 | |
| d18:1/22:2 | 783.6374 | 13.690 | C45 H87 N2 O6 P | 782.6291 | 782.6302 | −1.32 | 264.2700, 184.0726 | 783.7 | 184.1 | |
| d18:1/21:0 | 773.6527 | 15.057 | C44 H89 N2 O6 P | 772.6453 | 772.6458 | −0.68 | 264.2674, 184.0729 | 773.7 | 184.1 | |
| d18:1/21:1 | 771.6340 | 14.123 | C44 H87 N2 O6 P | 770.6270 | 770.6302 | −4.13 | 264.2679, 184.0728 | 771.7 | 184.1 | |
| d18:1/20:0 | 759.6372 | 14.390 | C43 H87 N2 O6 P | 758.6300 | 758.6302 | −0.21 | 264.2734, 184.0731 | 759.7 | 184.1 | |
| d18:1/19:0 | 745.6213 | 13.757 | C42 H85 N2 O6 P | 744.6138 | 744.6145 | −0.95 | 264.2689, 184.0726 | 745.7 | 184.1 | |
| d18:1/18:0 | 731.6068 | 13.140 | C41 H83 N2 O6 P | 730.6005 | 730.5989 | 2.16 | 264.2678, 184.0731 | 731.6 | 184.1 | |
| d18:1/18:1 | 729.5906 | 12.323 | C41 H81 N2 O6 P | 728.5827 | 728.5832 | −0.75 | 264.2699, 184.0732 | 729.6 | 184.1 | |
| d18:1/17:0 | 717.5911 | 12.573 | C40 H81 N2 O6 P | 716.5841 | 716.5832 | 1.17 | 264.2622, 184.0731 | 717.6 | 184.1 | |
| d18:1/16:0 | 703.5754 | 12.023 | C39 H79 N2 O6 P | 702.5684 | 702.5676 | 1.11 | 264.2694, 184.0731 | 703.6 | 184.1 | |
| d18:1/16:1 | 701.5604 | 11.323 | C39 H77 N2 O6 P | 700.5530 | 700.5519 | 1.53 | 264.2645, 184.0732 | 701.6 | 184.1 | |
| d18:1/15:0 | 689.5595 | 11.573 | C38 H77 N2 O6 P | 688.5521 | 688.5519 | 0.27 | 264.2750, 184.0732 | 689.6 | 184.1 | |
| d18:1/14:0 | 675.5427 | 11.190 | C37 H75 N2 O6 P | 674.5369 | 674.5363 | 0.96 | 264.2676, 184.0732 | 675.5 | 184.1 | |
| d18:2/24:0 [A1] | 813.6848 | 16.074 | C47 H93 N2 O6 P | 812.6774 | 812.6771 | 0.33 | 262.2513, 184.0730 | 813.7 | 184.1 | |
| d18:2/24:3 | 807.6350 | 14.590 | C47 H87 N2 O6 P | 806.6291 | 806.6302 | −1.29 | 262.2523, 184.0731 | 807.6 | 184.1 | |
| d18:2/23:0 [A2] | 799.6690 | 15.424 | C46 H91 N2 O6 P | 798.6615 | 798.6615 | 0.09 | 262.2512, 184.0732 | 799.7 | 184.1 | |
| d18:2/22:0 [A3] | 785.6531 | 14.757 | C45 H89 N2 O6 P | 784.6458 | 784.6458 | −0.07 | 262.2620, 184.0730 | 785.7 | 184.1 | |
| d18:2/20:0 | 757.6213 | 13.490 | C43 H85 N2 O6 P | 756.6138 | 756.6145 | −0.93 | 262.2523, 184.0730 | 757.7 | 184.1 | |
| d18:2/15:0 | 687.5433 | 10.906 | C38 H75 N2 O6 P | 686.5355 | 686.5363 | −1.17 | 262.2503, 184.0716 | 687.5 | 184.1 | |
| d18:1/12:0 [IS-1] | 647.5133 | 10.389 | C35 H71 N2 O6 P | 646.5058 | 646.505 | 1.32 | 264.2699, 184.0732 | 647.5 | 184.1 | |
| DHSM | d18:0/25:0 | 831.7299 | 18.324 | C48 H99 N2 O6 P | 830.7233 | 830.7241 | −0.89 | 184.0745 | ||
| d18:0/24:0 | 817.7156 | 17.524 | C47 H97 N2 O6 P | 816.7082 | 816.7084 | −0.3 | 184.0726 | 817.7 | 184.1 | |
| d18:0/23:0 | 803.6991 | 16.874 | C46 H95 N2 O6 P | 802.6919 | 802.6928 | −1.14 | 266.2781, 184.0724 | 803.7 | 184.1 | |
| d18:0/22:0 | 789.6843 | 16.207 | C45 H93 N2 O6 P | 788.6769 | 788.6771 | −0.31 | 184.0734 | 789.7 | 184.1 | |
| d18:0/20:0 | 761.6530 | 14.907 | C43 H89 N2 O6 P | 760.6456 | 760.6458 | −0.25 | 184.0724 | 761.7 | 184.1 | |
| d18:0/19:0 | 747.6388 | 14.373 | C42 H87 N2 O6 P | 746.6310 | 746.6302 | 1.08 | 184.0727 | 747.6 | 184.1 | |
| d18:0/18:0 | 733.6222 | 13.64 | C41 H85 N2 O6 P | 732.6176 | 732.6145 | 4.15 | 184.0731 | 733.7 | 184.1 | |
| d18:0/17:0 | 719.5692 | 10.673 | C39 H79 N2 O7 P | 718.5617 | 718.5625 | −1.06 | 184.0725 | 719.6 | 184.1 | |
| d18:0/16:0 | 705.5915 | 12.457 | C39 H81 N2 O6 P | 704.5843 | 704.5832 | 1.58 | 184.0735 | 705.6 | 184.1 | |
| d18:0/15:0 | 691.5747 | 11.940 | C38 H79 N2 O6 P | 690.5685 | 690.5676 | 1.35 | 184.0731 | 691.6 | 184.1 | |
| d18:0/14:0 | 677.5576 | 11.523 | C37 H77 N2 O6 P | 676.5519 | 676.5519 | 0.01 | 184.0729 | 677.5 | 184.1 | |
| t18:0/16:0 | 721.5839 | 11.423 | C39 H81 N2 O7 P | 720.5769 | 720.5781 | −1.74 | 264.2685, 184.0719 | 721.6 | 184.1 | |
| Cer | d18:1/24:0 | 650.6451 | 18.458 | C42 H83 N O3 | 649.6379 | 649.6373 | 0.86 | 632.6290, 614.6156, 264.2683 | 650.7 | 264.3 |
| d18:1/24:1 | 648.6293 | 17.157 | C42 H81 N O3 | 647.6220 | 647.6216 | 0.62 | 630.6170, 612.6100, 264.2690 | 648.7 | 264.3 | |
| d18:1/24:2 | 646.6124 | 16.224 | C42 H79 N O3 | 645.6058 | 645.6060 | −0.25 | 264.2703 | 646.7 | 264.3 | |
| d18:1/23:0(OH) | 652.6250 | 16.194 | C41 H81 N O4 | 651.6185 | 651.6166 | 0.94 | 264.2697 | 652.7 | 264.3 | |
| d18:1/23:0 | 636.6288 | 17.707 | C41 H81 N O3 | 635.6213 | 635.6216 | −0.48 | 264.2689 | 636.6 | 264.3 | |
| d18:1/23:1 | 634.6135 | 16.507 | C41 H79 N O3 | 633.6055 | 633.6060 | −0.73 | 264.2670 | 634.6 | 264.3 | |
| d18:1/22:0 | 622.6136 | 17.007 | C40 H79 N O3 | 621.6077 | 621.6060 | 2.77 | 264.2700 | 622.6 | 264.3 | |
| d18:1/22:1 [A4] | 620.5983 | 15.874 | C40 H77 N O3 | 619.5893 | 619.5903 | −1.74 | 264.2684 | 620.5 | 264.3 | |
| d18:1/20:0 | 594.5808 | 15.600 | C38 H75 N O3 | 593.5735 | 593.5747 | −1.22 | 264.2674 | 594.6 | 264.3 | |
| d18:1/18:0 | 566.5521 | 14.340 | C36 H71 N O3 | 565.5440 | 565.5434 | 1.15 | 264.2681 | 566.6 | 264.3 | |
| d18:1/18:1 | 564.5332 | 13.167 | C36 H69 N O3 | 563.5251 | 563.5277 | −4.62 | 264.2660 | 564.5 | 264.3 | |
| d18:1/17:3 | 546.4890 | 10.890 | C35 H63 N O3 | 545.4819 | 545.4808 | 2.1 | 264.2701 | |||
| d18:1/16:0 | 538.5198 | 13.057 | C34 H67 N O3 | 537.5124 | 537.5121 | 0.57 | 264.2684 | 538.5 | 264.3 | |
| d18:1/16:1 | 536.5045 | 12.243 | C34 H65 N O3 | 535.4974 | 535.4964 | 1.74 | 264.2694 | 536.6 | 264.3 | |
| d18:1/15:3(OH) | 534.4521 | 13.906 | C33 H59 N O4 | 533.4449 | 533.4444 | 0.98 | 516.4403, 264.2706 | 534.5 | 264.3 | |
| d18:1/14:3(OH) | 520.4367 | 13.473 | C32 H57 N O4 | 519.4297 | 519.4288 | 1.81 | 502.4256, 264.2679 | 520.4 | 264.3 | |
| d18:2/23:1 | 632.5940 | 15.657 | C41 H77 N O3 | 631.5885 | 631.5903 | −2.86 | 262.2520 | 632.6 | 262.3 | |
| d18:2/22:0 [A4] | 620.5979 | 16.074 | C40 H77 N O3 | 619.5906 | 619.5903 | 0.45 | 602.5864, 262.2610 | 620.5 | 262.3 | |
| d17:1/16:0 | 524.5045 | 12.477 | C33 H65 N O3 | 523.4971 | 523.4964 | 1.27 | 250.2520 | 524.5 | 250.3 | |
| d18:1/12:0 [IS-2] | 482.4574 | 10.990 | C30 H59 N O3 | 481.4501 | 481.4495 | 1.3 | 264.2678 | 482.5 | 264.3 | |
| DHCer | d18:0/24:0 | 652.6607 | 19.112 | C42 H85 N O3 | 651.6533 | 651.6529 | 0.57 | 634.6377, 266.2767 | 652.7 | 266.3 |
| d18:0/18:3 | 562.5197 | 15.924 | C36 H67 N O3 | 561.5122 | 561.5121 | 0.25 | 266.2797 | |||
| d18:0/16:0 | 540.5354 | 13.507 | C34 H69 N O3 | 539.5273 | 539.5277 | −0.86 | 266.2833 | 540.5 | 266.3 | |
| d18:0/17:0(OH) | 570.5458 | 13.408 | C35 H71 N O4 | 569.5383 | 569.5383 | 0.05 | 266.2642 | |||
| d18:0/16:0(OH) | 556.5300 | 12.373 | C34 H69 N O4 | 555.5227 | 555.5227 | 0.05 | 266.2857 | |||
| d18:0/14:0(OH) | 528.4993 | 11.256 | C32 H65 N O4 | 527.4921 | 527.4914 | 1.49 | 266.2831 | |||
| d17:0/13:0(OH) | 500.4682 | 11.323 | C30 H61 N O4 | 499.4608 | 499.4601 | 1.5 | 252.2673 | |||
| C1P | d18:1/19:0(OH) | 676.5279 | 11.823 | C37 H74 N O7 P | 675.5200 | 675.5203 | −0.37 | 264.2673 | 676.5 | 264.3 |
| d18:1/12:2 | 558.3904 | 9.573 | C30 H56 N O6 P | 557.3832 | 557.3845 | −2.44 | 264.2677 | |||
| d18:1/12:0 [IS-3] | 562.4223 | 10.006 | C30 H60 N O6 P | 561.4149 | 561.4158 | −1.72 | 264.2688 | 562.5 | 264.3 | |
| HexCer | d18:1/26:0 | 840.7282 | 18.374 | C50 H97 N O8 | 839.7213 | 839.7214 | −0.11 | 264.2774 | 840.7 | 264.3 |
| d18:1/24:0 | 812.6975 | 16.957 | C48 H93 N O8 | 811.6901 | 811.6901 | −0.07 | 632.6302, 264.2684 | 812.7 | 264.3 | |
| d18:1/24:1 | 810.6800 | 15.807 | C48 H91 N O8 | 809.6728 | 809.6745 | −2.01 | 630.6137, 264.2676 | 810.6 | 264.3 | |
| d18:1/23:0 | 798.6816 | 16.307 | C47 H91 N O8 | 797.6738 | 797.6745 | −0.85 | 618.6106, 264.2682 | 798.7 | 264.3 | |
| d18:1/22:0 | 784.6656 | 15.674 | C46 H89 N O8 | 783.6580 | 783.6588 | −1.02 | 604.6012, 264.2689 | 784.7 | 264.3 | |
| d18:1/20:1 | 754.6178 | 13.173 | C44 H83 N O8 | 753.6105 | 753.6119 | −1.77 | 264.2691 | 754.6 | 264.3 | |
| d18:1/16:0 | 700.5722 | 12.040 | C40 H77 N O8 | 699.5645 | 699.5649 | −0.6 | 264.2694 | 700.6 | 264.3 | |
| d18:1/12:0 [IS-4] | 644.5101 | 10.406 | C36 H69 N O8 | 643.5028 | 643.5023 | 0.78 | 264.2684 | 644.5 | 264.3 | |
| LacCer | d18:1/24:0 | 974.7501 | 16.324 | C54 H103 N O13 | 973.7440 | 973.7429 | 1.05 | 794.6828, 614.6288, 264.2674 | 974.8 | 264.3 |
| d18:1/24:1 | 972.7323 | 15.19 | C54 H101 N O13 | 971.7247 | 971.7273 | −2.65 | 264.2694 | 972.8 | 264.3 | |
| d18:1/22:0 | 946.7175 | 15.057 | C52 H99 N O13 | 945.7100 | 945.7116 | −1.7 | 766.3514, 264.2723 | 946.8 | 264.3 | |
| d18:1/20:0 | 918.6891 | 13.990 | C50 H95 N O13 | 917.6815 | 917.6803 | 1.22 | 264.2665 | |||
| d18:1/18:0 | 890.6541 | 12.660 | C48 H91 N O13 | 889.6463 | 889.6490 | −3.07 | 890.7 | 264.3 | ||
| d18:1/16:0 | 862.6245 | 11.623 | C46 H87 N O13 | 861.6175 | 861.6177 | −0.26 | 844.6130, 520.5112, 502.4944, 264.2688 | 862.7 | 264.3 | |
| d18:1/12:0 [IS-5] | 806.5624 | 10.189 | C42 H79 N O13 | 805.5549 | 805.5551 | −0.26 | 464.4472, 264.2683 | 806.7 | 264.3 | |
| Sa | d19:0 | 316.3202 | 6.532 | C19 H41 N O2 | 315.3141 | 315.3137 | 1.23 | 298.3106, 280.2984 | 316.3 | 298.3 |
| d16:0 | 274.2742 | 4.842 | C16 H35 N O2 | 273.2669 | 273.2668 | 0.43 | 256.2604 | 274.3 | 256.3 | |
| t19:0 | 332.3166 | 6.691 | C19 H41 N O3 | 331.3093 | 331.3086 | 1.87 | 314.3032, 296.2776 | 332.3 | 314.3 | |
| t17:0 | 304.2855 | 5.841 | C17 H37 N O3 | 303.2782 | 303.2773 | 2.68 | 286.2729 | |||
| Capnine | 352.2519 | 5.075 | C17 H37 N O4 S | 351.2445 | 351.2443 | 0.47 | 316.1840 | |||
| Enigmol | 302.3050 | 6.765 | C18 H39 N O2 | 301.2978 | 301.2981 | −1.66 | 284.2934 | 302.4 | 284.3 | |
| Xestoaminol C | 230.2481 | 2.060 | C14 H31 N O | 229.2408 | 229.2406 | 1.01 | 212.2380 | 230.3 | 212.3 | |
| d17:0 [IS-6] | 288.2901 | 6.632 | C17 H37 N O2 | 287.2829 | 287.2824 | 1.65 | 270.2794 | 288.3 | 270.3 | |
| So | d19:1 | 314.3056 | 10.673 | C19 H39 N O2 | 313.2983 | 313.2981 | 0.69 | 296.3320 | 314.3 | 296.3 |
| d18:1 | 300.2898 | 6.741 | C18 H37 N O2 | 299.2824 | 299.2824 | −0.08 | 282.2780, 264.2669 | 300.3 | 282.3 | |
| d16:1 | 272.2582 | 5.418 | C16 H33 N O2 | 271.2505 | 271.2511 | −2.36 | 254.2849 | 272.3 | 254.2 | |
| d16:3 | 268.2277 | 6.458 | C16 H29 N O2 | 267.2203 | 267.2198 | 1.82 | 250.2529, 238.2509 | |||
| d15:3 | 254.2117 | 4.358 | C15 H27 N O2 | 253.2045 | 253.2042 | 1.08 | 236.1994 | |||
| t19:1 | 330.3009 | 6.405 | C19 H39 N O3 | 329.2936 | 329.293 | 1.9 | 312.3288 | 330.3 | 312.3 | |
| t19:2 | 328.2852 | 8.274 | C19 H37 N O3 | 327.2777 | 327.2773 | 1.13 | 310.3129 | 328.3 | 310.3 | |
| t18:1 | 316.2850 | 6.874 | C18 H37 N O3 | 315.2776 | 315.2773 | 0.88 | 298.2911 | 316.3 | 298.3 | |
| t17:1 | 302.2696 | 7.024 | C17 H35 N O3 | 301.2624 | 301.2617 | 2.21 | 284.2947 | 302.3 | 284.3 | |
| N,N-dimethylSo | 328.3210 | 9.473 | C20 H41 N O2 | 327.3136 | 327.3137 | −0.24 | 310.3091 | 328.3 | 310.3 | |
| Halaminol A | 228.2319 | 6.891 | C14 H29 N O | 227.2246 | 227.2249 | −1.17 | 210.0276 | 228.2 | 210.0 | |
| d17:1 [IS-7] | 286.3106 | 6.558 | C18 H39 N O | 285.3034 | 285.3032 | 0.74 | 268.2643 | 286.3 | 268.3 | |
| Sa1P | d17:0 [IS-8] | 368.2574 | 6.774 | C17 H38 N O5 P | 367.2504 | 367.2488 | 4.57 | 368.3 | 270.3 | |
| So1P | d17:1 [IS-9] | 366.2406 | 6.558 | C17 H36 N O5 P | 365.2331 | 365.2331 | 0.03 | 250.2510 | 366.2 | 250.3 |
SM, sphingomyelin; DHSM, dihydrosphingomyelin; Cer, Ceramide; DHCer, dihydroceramide; HexCer, hexosylceramide; LacCer, lactosylceramide; Sa, sphinganine; So, sphingosine; C1P, ceramide-1-phosphate; Sa1P, sphinganine-1-phosphate; So1P, sphingosine-1-phosphate. [A1–A4], 4 pairs of isomeric sphingolipids; [IS], internal standard.
The comprehensive profiling of SPLs provided an overall “picture” of the sphingolipidome of A2780 cells. Generally, sphingomyelin (SM) is the most abundant subclass of SPLs in this cell line. Totally 43 SMs, including 31 dehydrosphingomyelins and 12 dihydrosphingomyelins (DHSMs), were identified based on exact mass and characteristic product ions obtained in targeted MS/MS experiments, 31 of which are reported for the first time in A2780 cell line. All the SMs were found to possess a C18 sphingoid base chain, with d18:1 account for the majority, comparing to the d18:0 and d18:2 backbones. The length of N-acyl chain varies from 14 to 26, and the unsaturation degree ranges from 0 to 5. Notably, the N-acyl chains of all the 12 DHSMs are fully saturated. Two highly unsaturated (total unsaturation degree no less than 4) SMs, SM (d18:1/24:3) and SM (d18:2/24:3), have been detected in A2780 cells for the first time.
In A2780 cells, 26 Cers, including 19 dehydroceramides and 7 dihydroceramides (DHCers), were identified based on the MS information and, in some cases, by comparing the retention time with that of SPLs in PC12 cells in our previous study21. Most Cers detected in the sample were with a d18:1 sphingoid backbone, with carbon number of N-acyl chain ranged from 14 to 24. Three dehydroceramides and 4 DHCers with a hydroxyl group on N-acyl chain have been characterized, among which 2 dehydroceramides and 1 DHCer with short N-acyl chain (carbon number less than 16) were reported for the first time to the best of our knowledge. The other 3 new Cers were species with high degree of unsaturation, for instance, Cer (d18:1/17:3), Cer (d18:2/23:1) and a new DHCer (d18:0/18:3). A notable ceramide was DHCer (d17:0/13:0(OH)), which was a very uncommon DHCer with odd carbon number sphingoid backbone.
Due to the limitation of chromatographic separation, galactosylceramide and glucosylceramide cannot be distinguished, thus these two hexose-linked ceramides were represented as HexCer. All C1P, HexCer, and lactosylceramide (LacCer) species exclusively bared a d18:1 sphingoid base backbone. The dominant HexCers and LacCers are d18:1/24:1, d18:1/24:0 and d18:1/16:0. Two novel C1Ps, i.e. C1P (d18:1/19:0(OH)) and C1P (d18:1/12:2), were identified in A2780. The former one has an N-acyl chain with odd carbon number and a hydroxyl group, while the latter one has two degrees of unsaturation on the N-acyl fatty chain.
Eighteen sphingoid bases with carbon number ranging from 14 to 20 were successfully identified. Short chain sphingosines with high unsaturation degree (d16:3 & d15:3) and a sphingosine with 3 hydroxyl groups (t19:2) have been discovered as uncommon species.
Quantitative profiling of sphingolipidome in A2780 cells
Comparing to routine LC-MS based approaches, UHPLC coupled with QQQ mass spectrometer in MRM mode provides more sensitive and accurate quantification with wider dynamic range of SPLs. However, the quantification of SPLs cannot be accomplished accurately in LC-MS/MS analysis with a QQQ analyzer solely, as triple-quadruple cannot distinguish isotopic/isobaric ions within 0.1 Da when selecting the precursor ions. For instance, each unsaturated SPL could generate an isotopic interference on SPLs with less degree of unsaturation as exemplified by SM (d18:1/14:0) and SM (d18:0/14:0) (Fig. 2). In our approach, based on foregoing comprehensive profiling by Q-TOF and the optimized chromatographic separation, all the structurally similar SPLs were accurately quantified with elimination of such isotopic/isobaric interference. With the optimized MRM conditions, 89 species from 9 subclasses out of 102 identified SPLs were quantified by using the UHPLC-QQQ MS method. It was found that A2780 and A2780T share most common sphingolipid molecules, except for HexCer (d18:1/20:1) which is only present in A2780. The amounts of SPLs were measured by using the internal standards previously mentioned, duplicate measurements for each sample yielded consistent results in all cases.
Figure 2. Differentiation of isotopic SPLs by accurate MS together with complete separation.

(a) SM (d18:1/14:0) (tR = 11.190 min) yields precursor ions at m/z 675.5427, 676.5459 and 677.5484. The last one is the [M + 2] isotopic ion which will interfere with the precursor ion of (b) SM (d18:0/14:0) (tR = 11.523 min) at m/z 677.5576. If the chromatograph cannot separate the two SPLs completely, the quantification result of SM (d18:0/14:0) will be artificially high.
The quantitative results showed that SMs take the highest proportion of all the SPLs, among which SMs with C18 sphingoid base backbone are the dominant species (Fig. 3). In A2780 cells the most dominant species are SM (d18:1/16:0) which corresponding to [M + H]+ at m/z 703, followed by DHSM (d18:0/16:0) (m/z 705), SM (d18:1/16:1) (m/z 701) with less relative abundance. The d18:1 SMs with C16/C18/C22/C24 N-acyl chain showed relative high levels in both A2780 and A2780T. Forty-two out of the 43 SMs were quantified except for DHSM (d18:0/25:0), whose content is lower than the limit of quantitation (LOQ).
Figure 3. Content of marker sphingomyelins in A2780 and A2780T.

The horizontal and depth axes represent the composition of fatty acid acyl chain and sphingoid base backbone chain, respectively.
A total of 20 Cers have been quantified, but most of them are d18:1 species due to the weak intensity of d18:0 backbone fragment ions (m/z 266.4). According to the finding of Koyanagi et al. in tumors only the content of C16 N-acyl chain ceramide (C16-Cer) are significantly high22, that can explain why other DHCers cannot be quantified exactly. As shown in Fig. 4, the content of individual Cers differ dramatically (at most 500 times), for some common species like d18:1/18:1, d18:1/24:0 and d18:1/24:1, the contents are significantly higher than that of highly unsaturated species d18:1/24:2. In general, the amounts of Cers are significantly higher in A2780 than those in A2780T.
Figure 4. Content of marker ceramides in A2780 and A2780T.
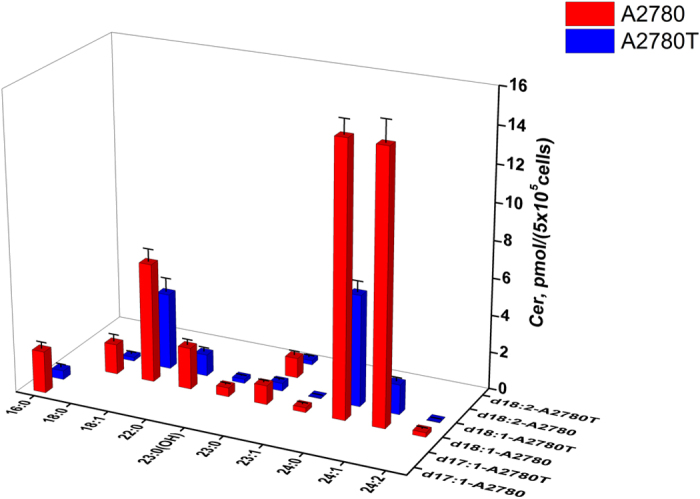
The horizontal and depth axes represent the composition of fatty acid acyl chain and sphingoid base backbone chain, respectively.
Among all the HexCers and LacCers, only d18:1 sphingoid base backbone type was found. All the 12 HexCers and LacCers showed higher intensity in A2780 cells than that in A2780T. Sphinganine, as the precursor of DHCer, showed decrease in A2780T. The overall content of sphingosines was similar in both cell types, but the expression of individual sphingosine was quite different. Higher level of Cer1P (d18:0/20:0) was detected in A2780T (data not shown). Figure 5 showed the trends of all 7 marker HexCers and LacCers between A2780 and A2780T.
Figure 5. Content of marker HexCer and marker LacCer in A2780 and A2780T.
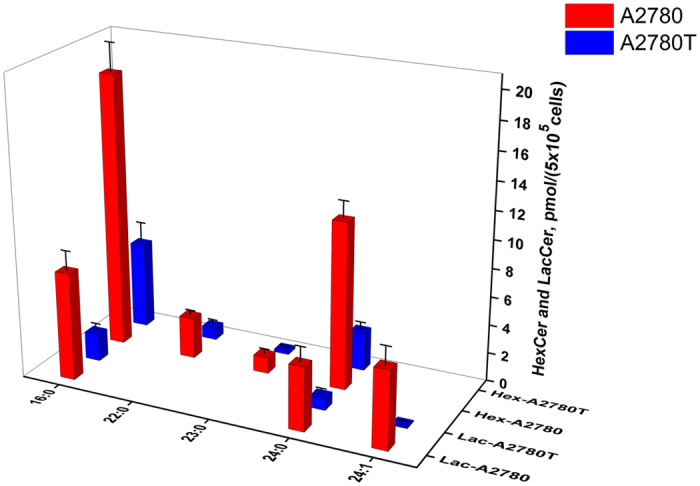
The horizontal axis represents the composition of fatty acid acyl chain of the d18:1 HexCer and d18:1 LacCer.
Multivariate analyses of the sphingolipidomic data
Multivariate analyses were further carried out to view the overall differences between A2780 and A2780Ts, and to identify SPL markers that were significantly changed in A2780T. PLS-DA was used to visualize general clustering among A2780, A2780T, and QC groups firstly (Fig. 6A). After auto scaling of data sets, discrimination feature between the profiles were identified for each model by displaying loadings plots. Loading plots and VIP value in PLS-DA model are commonly used for biomarker selection and identification. According to the results, potential SPL markers that were differentially expressed between A2780 and A2780T groups were identified (Fig. 6B and Table 2), suggesting a SPL alternation was involved in A2780T. A total of 52 potential biomarkers were identified according to the VIP value and scattering-plot, among which most of them are sphingomyelins, several highly unsaturated SPLs [SM (d18:1/24:3), SM (d18:1/24:2) and SM (d18:1/22:2)] were also included. LacCer (d18:1/24:1) showed the largest decline in A2780T, whose content decreased by approximately 70 folds, which contributes most significantly to the classification.
Figure 6.
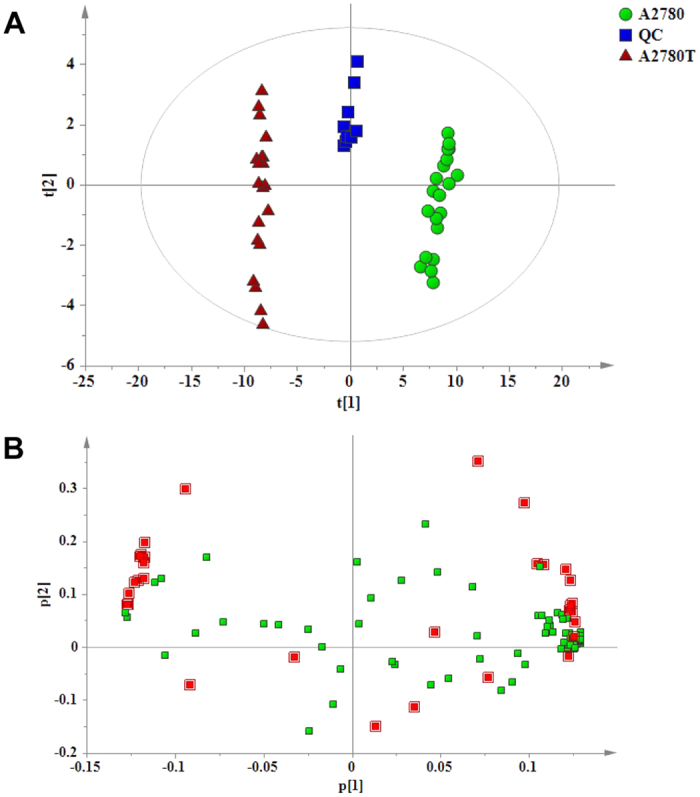
Partial least squares discriminant analysis projecting scatter plots (A) scores plot (A2780 & A2780T group, n = 20; QC, n = 10), (B) loading plot. Red boxes represent the SPLs which contribute significantly to the classification (VIP > 1).
Table 2. Quantification of SPLs (VIP > 1) in A2780 and A2780T.
| SPLs | Content (pmol/5*105 cells) | Change A2780T vs A2780 | p value | VIP | |
|---|---|---|---|---|---|
| A2780 (n = 10) | A2780T (n = 10) | ||||
| SM(d18:2/23:0) | 1.91 ± 0.06 | 1.15 ± 0.03 | ↓ | <0.001 | 1.09801 |
| SM(d18:2/22:0) | 5.68 ± 0.16 | 3.19 ± 0.09 | ↓ | <0.001 | 1.13525 |
| SM(d18:2/20:0) | 1.14 ± 0.03 | 0.30 ± 0.02 | ↓ | <0.001 | 1.16777 |
| SM(d18:1/26:1) | 1.23 ± 0.04 | 0.57 ± 0.02 | ↓ | <0.001 | 1.13507 |
| SM(d18:1/26:0) | 0.39 ± 0.01 | 0.85 ± 0.02 | ↑ | <0.001 | 1.15741 |
| SM(d18:1/25:1) | 1.09 ± 0.03 | 0.81 ± 0.02 | ↓ | <0.001 | 1.01815 |
| SM(d18:1/25:0) | 0.69 ± 01 | 1.16 ± 0.02 | ↑ | <0.001 | 1.11518 |
| SM(d18:1/24:3) | 0.85 ± 0.04 | 0.21 ± 0.01 | ↓ | <0.001 | 1.14943 |
| SM(d18:1/24:2) | 22.5 ± 0.42 | 4.00 ± 0.09 | ↓ | <0.001 | 1.18383 |
| SM(d18:1/24:1) | 94.6 ± 1.80 | 22.5 ± 0.65 | ↓ | <0.001 | 1.18238 |
| SM(d18:1/24:0) | 35.6 ± 0.64 | 55.1 ± 1.33 | ↑ | <0.001 | 1.13437 |
| SM(d18:1/23:2) | 0.72 ± 0.02 | 0.04 ± 0.00 | ↓ | <0.001 | 1.15961 |
| SM(d18:1/23:1) | 8.43 ± 0.18 | 1.27 ± 0.04 | ↓ | <0.001 | 1.18228 |
| SM(d18:1/22:2) | 0.49 ± 0.03 | 0.08 ± 0.01 | ↓ | <0.001 | 1.13820 |
| SM(d18:1/22:1) | 8.00 ± 0.16 | 0.84 ± 0.03 | ↓ | <0.001 | 1.18362 |
| SM(d18:1/21:1) | 0.32 ± 0.01 | 0.05 ± 0.00 | ↓ | <0.001 | 1.14304 |
| SM(d18:1/21:0) | 1.60 ± 0.04 | 0.62 ± 0.02 | ↓ | <0.001 | 1.16306 |
| SM(d18:1/20:0) | 3.89 ± 0.09 | 2.02 ± 0.07 | ↓ | <0.001 | 1.15126 |
| SM(d18:1/19:0) | 0.54 ± 0.03 | 0.15 ± 0.01 | ↓ | <0.001 | 1.11029 |
| SM(d18:1/18:1) | 31.7 ± 0.03 | 5.77 ± 0.01 | ↓ | <0.001 | 1.18432 |
| SM(d18:1/18:0) | 28.7 ± 0.48 | 7.54 ± 0.31 | ↓ | <0.001 | 1.18301 |
| SM(d18:1/17:0) | 4.63 ± 0.12 | 7.27 ± 0.20 | ↑ | <0.001 | 1.11640 |
| SM(d18:1/16:1) | 27.3 ± 0.47 | 40.1 ± 0.91 | ↑ | <0.001 | 1.12871 |
| SM(d18:1/16:0) | 431 ± 20.9 | 606 ± 40.4 | ↑ | <0.001 | 1.11932 |
| SM(d18:1/15:0) | 20.0 ± 0.32 | 14.1 ± 0.26 | ↓ | <0.001 | 1.14185 |
| SM(d18:1/14:0) | 20.9 ± 0.28 | 15.6 ± 0.27 | ↓ | <0.001 | 1.13645 |
| DHSM(d18:0/24:0) | 0.54 ± 0.01 | 4.96 ± 0.13 | ↑ | <0.001 | 1.18082 |
| DHSM(d18:0/23:0) | 0.11 ± 0.00 | 0.81 ± 0.02 | ↑ | <0.001 | 1.17627 |
| DHSM(d18:0/22:0) | 0.74 ± 0.02 | 3.35 ± 0.08 | ↑ | <0.001 | 1.17865 |
| DHSM(d18:0/20:0) | 0.27 ± 0.01 | 0.49 ± 0.02 | ↑ | <0.001 | 1.04670 |
| DHSM(d18:0/18:0) | 1.06 ± 0.03 | 1.87 ± 0.06 | ↑ | <0.001 | 1.12766 |
| DHSM(d18:0/16:0) | 30.1 ± 0.70 | 198 ± 5.28 | ↑ | <0.001 | 1.17911 |
| DHSM(d18:0/14:0) | 0.72 ± 0.02 | 2.59 ± 0.08 | ↑ | <0.001 | 1.17037 |
| DHSM(t18:0/16:0) | 0.11 ± 0.01 | 0.27 ± 0.03 | ↑ | <0.001 | 1.07421 |
| Cer(d18:2/22:0) | 1.07 ± 0.08 | 0.23 ± 0.04 | ↓ | <0.001 | 1.09314 |
| Cer(d18:1/24:2) | 0.24 ± 0.03 | 0.02 ± 0.00 | ↓ | <0.001 | 1.02636 |
| Cer(d18:1/24:1) | 14.6 ± 0.59 | 1.60 ± 0.07 | ↓ | <0.001 | 1.17972 |
| Cer(d18:1/24:0) | 14.6 ± 0.27 | 5.97 ± 0.20 | ↓ | <0.001 | 1.17416 |
| Cer(d18:1/23:1) | 0.26 ± 0.03 | 0.02 ± 0.00 | ↓ | <0.001 | 1.02345 |
| Cer(d18:1/23:0) | 1.02 ± 0.04 | 0.42 ± 0.03 | ↓ | <0.001 | 1.12215 |
| Cer(d18:1/23:0(OH)) | 0.48 ± 0.03 | 0.22 ± 0.02 | ↓ | <0.001 | 1.02341 |
| Cer(d18:1/22:0) | 2.23 ± 0.10 | 1.16 ± 0.08 | ↓ | <0.001 | 1.06470 |
| Cer(d18:1/18:1) | 6.39 ± 0.23 | 4.09 ± 0.25 | ↓ | <0.001 | 1.01738 |
| Cer(d18:1/18:0) | 1.62 ± 0.13 | 0.20 ± 0.04 | ↓ | <0.001 | 1.10112 |
| Cer(d17:1/16:0) | 2.24 ± 0.12 | 0.47 ± 0.06 | ↓ | <0.001 | 1.13502 |
| HexCer(d18:1/24:0) | 11.7 ± 0.40 | 2.70 ± 0.18 | ↓ | <0.001 | 1.16555 |
| HexCer(d18:1/23:0) | 1.14 ± 0.40 | 0.21 ± 0.18 | ↓ | <0.001 | 1.04684 |
| HexCer(d18:1/22:0) | 2.89 ± 0.11 | 0.85 ± 0.11 | ↓ | <0.001 | 1.12835 |
| HexCer(d18:1/16:0) | 19.3 ± 0.67 | 6.11 ± 0.49 | ↓ | <0.001 | 1.15137 |
| LacCer(d18:1/24:1) | 5.48 ± 0.43 | 0.08 ± 0.01 | ↓ | <0.001 | 1.12942 |
| LacCer(d18:1/24:0) | 4.49 ± 0.36 | 0.84 ± 0.12 | ↓ | <0.001 | 1.09150 |
| LacCer(d18:1/16:0) | 7.59 ± 0.45 | 1.93 ± 0.17 | ↓ | <0.001 | 1.11980 |
Discussion
In order to drive study on the metabolism of sphingolipids, a reliable and informative analytical method for the comprehensive profiling of SPLs is essential. By using a combined analytical strategy, which enables the reliable identification and sensitive quantification, the dynamic distribution and interconversion of SPLs have been comprehensively monitored. Our improved sphingolipidomic analyses on A2780 and A2780T encompassed most of the important SPLs including sphinganine, sphingosine, ceramide-1-phosphase, hexosylceramide, lactosylceramide, dehydroceramide and dihydroceramide as well dehydrosphingomyelin and dihydrosphingomyelin subclasses. It is the most comprehensive sphingolipidomic study on A2780/A2780T cells to date, as evidenced by the identification of up to 102 SPLs including 67 species that are reported in the cell line for the first time. Distinguished from previous studies, this research of SPL took advantage of a well-established LC-MS method, and looked into the content variation of individual SPL species instead of the overall content of each subclass, thus provided much more detailed and useful information for revealing the mechanism of taxol-resistance. Most of the identified SPLs can be the metabolic pathway related biomarkers, especially the low abundance species of which the subtle changes may result in altered biological function like drug resistance23. It’s noted that all the rare SPLs (odd number of carbons/high level of unsaturation) in A2780/A2780T are with the low abundance. Similarly, SPLs with odd number of carbons (C15 and C17) have been reported24, and highly unsaturated SPLs were isolated from halotolerant fungus with poor natural abundance25. Even in A2780 cell line, Cer with C23 and C25 N-acetyl chain have already been found19. Discovery of these rare SPL species is one of the research highlights of this study.
Comparing to taxol sensitive A2780 cells, the most notable alteration in A2780T cells was the overall decrease of Cers. Eleven Cers are recognized as biomarkers of A2780T, along with a 1.5 to 13-fold decrease has been observed. Cer is known as an intracellular messenger that is able to regulate many intracellular effectors mediating activation of the apoptotic process. It has been recognized as a kind of tumor suppressor and has been found to act as a major player in the action of many chemotherapeutic drugs26. Dysregulated metabolism of Cers has been identified as a feature of many drug-resistant cancers27, as well as in taxol resistant human ovarian cancer cell line CABA-PTX28. In A2780T cells the depletion of Cers could potentially help the cells to evade Cer-induced apoptosis, and thereby can be a crucial mechanism responsible for the drug resistance of A2780T.
Totally 34 SMs (including 26 dehydrosphingomyelins and 8 DHSMs) were identified as biomarkers, which took most proportion of the biomarkers. Among all the marker SMs, the content of 6 dehydrosphingomyelins increased in taxol-resistant cells compared to sensitive cells by 0.4–1.2 times. Especially, C16-SMs, a kind of high abundance SPL in both A2780 and A2780T, were found to be significantly higher in the taxol resistant cells than those in the sensitive cells. This leads to the increased total SM level in A2780T, same as previously reported in 2780AD cells29. However, the other 20 dehydrosphingomyelin biomarkers decreased by up to 90%. Individually, the content of all d18:2 SMs, d18:1 SMs with unsaturated double bond(s) at the N-acyl chain, as well as d18:1 SMs with saturated N-Acyl chain of C18 to 23 decreased significantly in A2780T comparing to that of A2780. Whilst the content of d18:1 SMs with saturated N-Acyl chain of C16–C17 and C24–C26, as well as all DHSMs, were found to increase significantly in A2780T comparing to A2780. Of note, the increase of DHSMs in A2780T is high up to 8-fold for most species. Dihydrosphingolipids have received increasing attention. Wang et al. have determined that 4-HPR treated MDR cancer cells displayed elevations in DHCer but not dehydroceramides, together with elevated DHSM species rather than dehydrosphingomyelins30. It indicates that dihydrosphingolipids may fulfil a distinctive role in the metabolic pathway comparing to unsaturated sphingolipids. In A2780T, significant increase of dehydrosphingomyelins and DHSMs concomitant with decrease of corresponding DHCers (which was not identified as markers) have been observed. These variations are consistent with the hypothetical “DHCer - DHSM - dehydrosphingomyelin” pathway, and the activity of related enzymes (dihydroceramide desaturase and dihydroceramide synthase) may be altered31.
Cer plays a central role in the sphingolipid metabolism. All the Cers showed consistent trend of decrease in A2780T, except for some extremely low species (DHCers) whose content cannot meet the limit of quantitation. The overall decrease of Cers and accompanying increase of most SMs in A2780T cells, especially, the decrease of two most abundant Cers [Cer (d18:1/24:0) and Cer (d18:1/16:0)] and concomitant increase of corresponding species of SMs [SM (d18:1/24:0) and SM (d18:1/16:0)], clearly indicated SM-related depletion of Cers in A2780T cells. The roles of SMase and SMS in cancer treatment have been well recognized for decades. Their actions have been defined as one of the main routes for the alteration of Cer8. Sphingomyelinases are key enzymes of sphingolipid metabolism that regulate the formation and degradation of ceramide32. Drugs (including taxol) enhanced ceramide-governed cytotoxic response by activating sphingomyelinase27. While SM is the end product in the SM-Cer related pathway, and inhibition of SMS will result in Cer accumulation with effect solely on SM33. Thus, it can be proposed that in A2780T cells, the decreased level of Cers might be resulted from the down-regulated expression/activity of SMase or up-regulated SMS expression/activity. Similar mechanism has been reported that a decrease of the ceramide level via activation of glucosylceramide synthase (GCS) and SMS was detected in chemoresistant HL-60/ADR human promyelocytic leukemia cells34.
Besides Cer and SM, other SPLs and SPL metabolites also have biological activities that could be responsible for the acquisition of a drug resistance phenotype35. Ceramide glycosylation by the enzyme glucosylceramide synthase, which forms glucosylceramide and has been noted in some drug-resistant cell lines, is an important pathway for bypassing apoptosis36,37. Because SPLs comprised of d18:1 sphingosine backbone are the major species found in mammals38, in A2780T only HexCer and LacCer with d18:1 backbone can be detected and further quantified as markers. Additionally, glucosylceramide is known as an intermediate metabolite in the synthesis and degradation of the more complex gangliosides, and a number of drug-resistant cancer cell lines accumulate this noncytotoxic metabolite27. In our case of A2780T, the decrease of glucosylceramide and LacCer can be explained as “activation of ganglioside pathway”8, which enable cancer cells convert Cer into gangliosides to evade the pro-apoptotic function of Cer. The enzymes related to the “glucosylceramide-lactosylceramide-ganglioside pathway”, including glucosylceramidase, glucosylceramide synthase, and lactosylceramide synthase, could have participated in the biological progress.
In A2780T, reduced syntheses of Cer, HexCer, and LacCer were observed, with the concomitant increase of DHSM and total SM levels, in which C16-SMs contributes the vast majority. These represent the main sphingolipid metabolism pattern in A2780T, which is significantly different from the SPL profiles in similar ovarian cancer cell lines. On one hand, comparing with the sphingolipidome in another taxol resistant human ovarian cell line CABA-PTX28, the level of sphingomyelin in A2780T changed significantly. On the other hand, A2780T also showed different sphingolipidomic profile from A2780 cell lines resistant to other drugs. In sharp contrast to the well-studied MDR A2780 cells29, the rise of cellular HexCer (including galactosylceramide and glucosylcermide) levels was not observed in A2780T. And in A2780/HPR cells the glycosphigolipid-dominated alteration20 is also different from the SPL pattern in A2780T, which possesses a distinctive feature of “SM-related depletion of Cers”. It indicated that the resistant mechanism of A2780T could be different from that of either other taxol-resistant cancer cells (CABA-PTX) or A2780 cells resistant to other drugs (MDR A2780 & A2780/HPR). Such interdisciplinary basic scientific research has close relevance to the medical community and it facilitates the applications in rapid detection and classification of disease type (taxol-resistant or not) and medication direction.
Conclusions
Since the role of sphingolipids in cancer cell has been widely recognized, comprehensive sphingolipidomic study is essential for exploring its drug resistance mechanism. The most comprehensive and accurate method described in this paper fully identified SPLs in A2780 human ovarian cancer cell line and the taxol-resistant cell line A2780T. Most individual species, including some low abundance but biologically important SPLs, have been accurately quantified. It provides more detailed information than general overview of a whole subclass, which is significant for studying the alterations39.
The sphingolipid metabolism in A2780T is oriented toward down-regulation of ceramides. We propose A2780T cells may escape from the ceramide-caused apoptosis mainly via sphingomyelin/ceramide pathway, while SMS was expressed more in A2780T than in the sensitive cell line, or the activity of SMase was inhibited. These enzymes related to the marker SPLs and altered pathways, are the potential targets. Based on the sphingolipidomic study, adjusting the sphingolipid metabolism purposively may represent a winning strategy to overcome taxol resistance and improve cancer therapy. This study facilitates not only development of new drugs against taxol resistance, but also clinical diagnosis of taxol-resistant ovarian cancer.
Methods
Chemicals and solutions
Human ovarian cancer cell line (A2780) and its taxol-resistant strain (A2780T) were purchased from KeyGen Biotech Co., Ltd. (Nanjing, China). The LIPID MAPS internal standard (IS) cocktail in ethanol, composed of 25 μM each of nine sphingolipid standards including SM (d18:1/12:0), Cer (d18:1/12:0), C1P (d18:1/12:0), HexCer (d18:1/12:0), LacCer (d18:1/12:0), Sphinganine (d17:0), Sphingosine (d17:1), Sphinganine-1-Phosphate (d17:0) and Sphingosine-1-Phosphae (d17:1), was purchased from Avanti Polar Lipids (Alabaster, AL, USA). HPLC-grade methanol (MeOH), chloroform (CHCl3) and isopropanol (IPA) were purchased from Merck (Darmstadt, Germany). Ammonium acetate (NH4OAc), potassium hydroxide (KOH), acetic acid (CH3COOH) and formic acid (HCOOH) were purchased from Sigma-Aldrich (St. Louis, MO, USA). Dulbecco’s Modified Eagle’s Medium (DMEM), Roswell Park Memorial Institute (RPMI) 1640 medium, Fetal Bovine Serum (FBS), Penicillin-Streptomycin (PS) were purchased from Gibco, New Zealand. Sodium dodecyl sulfate (SDS) and 3-(4,5-dimethylthiazol-2-yl)-2,5-diphenyltetrazolium bromide (MTT) were purchased from Acros, USA.
A pooled sample equally aliquoted from all samples can provide the most comprehensive information within a specific study. Hence, equivalent amount of A2780T was spiked into A2780 to prepare a pooled quality control (QC) sample.
Cell culture and SPLs Extraction
A2780 human ovarian cancer cell line were cultured in DMEM supplemented with 1% PS and 10% FBS in a humidified 5% CO2 atmosphere at 37 °C. For lipid analysis, cells were seeded into dishes and grown to confluence. Cells were rinsed twice with ice-cold PBS and scraped into a borosilicate glass tube with polytetrafluoroethylene coated top. After adding 0.5 mL of MeOH, 0.25 mL of CHCl3 and 10 μL of internal standards cocktail (2.5 μM) successively, the mixture was sonicated at room temperature for 30 s then incubated at 48 °C for 12 h to extract SPLs. After 75 μL of KOH in MeOH (1M) was added in, the mixture was incubated in a shaking water bath for 2 h at 37 °C to cleave potentially interfering glycerolipids. After cooling and neutralization with acetic acid, a four-step extraction procedure was performed as reported to prepare the SPLs for LC-MS analysis.
In order to verify the taxol resistance in the commercial A2780T cell line, MTT assay was employed. A2780T cells were cultured in RPMI 1640 medium containing 10% FBS, 1% PS and 800 ng/mL taxol solution at 37 °C in a 5% CO2/95% air atmosphere. For assessment of cell viability, A2780 and A2780T were respectively seeded in a 96-well plate at a density of 5 × 10³ cells/well and were allowed to adhere for 16 h before treatment. Following incubation for 48 h, MTT solution (10 μL per well, 5 mg/mL solution) was added to each well and incubated for 4 h at 37 °C. Thereafter 100 μL 10% SDS was added for lysing and the plate was maintained overnight at 37 °C in a 5% CO2/95% air atmosphere. The optical densities were determined at 570 nm using a microplate reader. The procedure was repeated three times.
The sensitivity of A2780 and A2780T cell lines to taxol was assayed by using MTT assay. The IC50 for taxol in A2780 and A2780T was 73.16 nM and 149.6 μM, respectively. The result indicates that resistance to taxol of A2780T is at least 1000 fold greater than that of A2780.
LC-MS conditions
Sphingolipid analysis was performed by using our well-established LC-MS method21 with minor optimization, an Agilent 1290 UHPLC tandem 6550 quadrupole time-of-flight (Q-TOF) MS system and an Agilent 1290 UHPLC tandem 6460 triple quadrupole (QQQ) MS system were employed for qualitative profiling and quantitative analysis respectively. Chromatographic separation was performed as described previously, while the injection volume was 10 μL for Q-TOF and 5 μL for QQQ, respectively. An Agilent Eclipse Plus C18 column (100 × 2.1 mm, 1.8 μm) was used to separate the endogenous SPLs. The mobile phase consisted of (A) MeOH/H2O/HCOOH (60:40:0.2, v/v/v) and (B) MeOH/IPA/HCOOH (60:40:0.2, v/v/v), both containing 10 mM NH4OAc. The flow rate was 0.4 mL/min, and the column temperature was maintained at 40 °C for each run. A linear gradient was optimized as follows: 0–3 min, 0% to 10% B; 3–5 min, 10% to 40% B; 5–5.3 min, 40% to 55% B; 5.3–8 min, 55% to 60% B; 8–8.5 min, 60% to 80% B; 8.5–10.5 min, 80% to 80% B; 10.5–16 min, 80% to 90% B; 16–19 min, 90% to 90% B; 19–22 min, 90% to 100% B, followed by washing with 100% B and equilibration with 0% B. A typical data acquisition time was 20 min.
The above UHPLC system was interfaced with an Agilent ultrahigh definition (UHD) 6550 Q-TOF mass spectrometer equipped with an ESI source (Santa Clara, CA, USA). The source parameters were: drying gas (N2) temperature 150 °C, flow rate 15 L/min, nebulizer pressure 25 psi, sheath gas (N2) temperature was set at 200 °C with a flow-rate at 12 L/min. The scan parameters were: positive ion mode over m/z 110–1200, capillary voltage 4000 V, nozzle voltage 300 V, fragmentor voltage 175 V, skimmer voltage 65 V, octopole RF peak 500 V, drying gas 6 L/min at 300 °C. A reference solution was nebulized for continuous calibration in positive ion mode using the reference mass m/z 922.00979800. The acquisition and data analysis were controlled using Agilent Mass Hunter Workstation Software (Agilent, USA).
The UHPLC conditions for quantitative analysis were the same as those mentioned above. The LC system was coupled to an Agilent 6460 triple-quadrupole mass spectrometer (Santa Clara, CA, USA). The ESI parameters were optimized as follows: positive ion mode, drying gas (N2) temperature 325 °C, flow rate 11 L/min, nebulizer pressure 45 psi, capillary voltage 4000 V, nozzle voltage 300 V, sheath gas (N2) temperature was set at 200 °C with a flow-rate at 12 L/min. Data were processed with Agilent Mass Hunter Workstation Software. Further detail of the parameters, such as characteristic transitions, fragmentor and CE voltages optimized for each compound, and the methodology validations are similar as described before.
Data analysis
The screening and identification of SPLs were performed by searching in our personal database, which was built and updated based on the Agilent Mass Hunter Personal Compound Database and Library (PCDL) software and LIPID MAPS information (31643 SPLs until July 08 2015).
The sphingolipidomic approach was applied in qualitative research of SPLs by analyzing a pooled sample equally mixed by A2780 and A2780T. In quantitative research, A2780 cells (models, n = 10) and A2780T cells (models, n = 10) were analyzed in parallel. Supervised multivariate statistical analysis, partial least squares to latent structure-discriminant analysis (PLS-DA) method, was used to differentiate the amounts of SPLs between the two strains. Potential biomarkers were selected according to Variable Importance in Projection (VIP) value and the loading scattering-plot, using SIMCA-P+ software version 13.0 (Umetrics, Umea, Sweden). VIP values higher than 1.00 were considered significant.
Additional Information
How to cite this article: Huang, H. et al. LC-MS Based Sphingolipidomic Study on A2780 Human Ovarian Cancer Cell Line and Its Taxol-resistant Strain. Sci. Rep. 6, 34684; doi: 10.1038/srep34684 (2016).
Acknowledgments
This work was financially supported by the Macao Science and Technology Development Fund, Macau Special Administrative Region (039/2011/A2 to Z.-H. Jiang).
Footnotes
Author Contributions Z.-H.J. and J.-R.W. designed the research; T.-T.T. and L.-F.Y. performed the cell experiments; H.H., C.-Y.C. and J.-N.M. performed LC-MS analysis, H.H., J.-R.W. and Z.-H.J. wrote the manuscript. All authors reviewed and substantially contributed to the manuscript.
References
- Liu X. et al. Oncogenes associated with drug resistance in ovarian cancer. J. Cancer Res. Clin. Oncol. 141, 381–395 (2015). [DOI] [PubMed] [Google Scholar]
- Di Michele M. et al. A proteomic approach to paclitaxel chemoresistance in ovarian cancer cell lines. Biochim. Biophys. Acta 1794, 225–236 (2009). [DOI] [PubMed] [Google Scholar]
- Stordal B., Pavlakis N. & Davey R. A systematic review of platinum and taxane resistance from bench to clinic: an inverse relationship. Cancer Treat. Rev. 33, 688–703 (2007). [DOI] [PubMed] [Google Scholar]
- Yap T. A., Carden C. P. & Kaye S. B. Beyond chemotherapy: targeted therapies in ovarian cancer. Nat. Rev. Cancer 9, 167–181 (2009). [DOI] [PubMed] [Google Scholar]
- Longley D. B. & Johnston P. G. Molecular mechanisms of drug resistance. J. Pathol. 205, 275–292 (2005). [DOI] [PubMed] [Google Scholar]
- Kim H., Park G. S., Lee J. E. & Kim J. H. A leukotriene B4 receptor-2 is associated with paclitaxel resistance in MCF-7/DOX breast cancer cells. Br. J. Cancer 109, 351–359 (2013). [DOI] [PMC free article] [PubMed] [Google Scholar]
- Hiss D. Optimizing molecular-targeted therapies in ovarian cancer: the renewed surge of interest in ovarian cancer biomarkers and cell signaling pathways. J. Oncol. 2012, 737981 (2012). [DOI] [PMC free article] [PubMed] [Google Scholar]
- Giussani P., Tringali C., Riboni L., Viani P. & Venerando B. Sphingolipids: key regulators of apoptosis and pivotal players in cancer drug resistance. Int. J. Mol. Sci. 15, 4356–4392 (2014). [DOI] [PMC free article] [PubMed] [Google Scholar]
- Pyne N. J. & Pyne S. Sphingosine 1-phosphate and cancer. Nat. Rev. Cancer 10, 489–503 (2010). [DOI] [PubMed] [Google Scholar]
- Liu Y. Y., Hill R. A. & Li Y. T. Ceramide glycosylation catalyzed by glucosylceramide synthase and cancer drug resistance. Adv. Cancer. Res. 117, 59–89 (2013). [DOI] [PMC free article] [PubMed] [Google Scholar]
- Adan-Gokbulut A., Kartal-Yandim M., Iskender G. & Baran Y. Novel agents targeting bioactive sphingolipids for the treatment of cancer. Curr. Med. Chem. 20, 108–122 (2013). [PubMed] [Google Scholar]
- Li X. & Yuan Y. J. Lipidomic analysis of apoptotic hela cells induced by Paclitaxel. Omics 15, 655–664 (2011). [DOI] [PubMed] [Google Scholar]
- Li M., Yang L., Bai Y. & Liu H. Analytical methods in lipidomics and their applications. Anal. Chem. 86, 161–175 (2014). [DOI] [PubMed] [Google Scholar]
- Prinetti A. et al. GM3 synthase overexpression results in reduced cell motility and in caveolin-1 upregulation in human ovarian carcinoma cells. Glycobiology 20, 62–77 (2010). [DOI] [PubMed] [Google Scholar]
- Prinetti A. et al. A glycosphingolipid/caveolin-1 signaling complex inhibits motility of human ovarian carcinoma cells. J Biol Chem 286, 40900–40910 (2011). [DOI] [PMC free article] [PubMed] [Google Scholar]
- Villani M. G. et al. 4-oxo-fenretinide, a recently identified fenretinide metabolite, induces marked G2-M cell cycle arrest and apoptosis in fenretinide-sensitive and fenretinide-resistant cell lines. Cancer Res. 66, 3238–3247 (2006). [DOI] [PubMed] [Google Scholar]
- Chapman J. V., Gouaze-Andersson V., Karimi R., Messner M. C. & Cabot M. C. P-glycoprotein antagonists confer synergistic sensitivity to short-chain ceramide in human multidrug-resistant cancer cells. Exp. Cell. Res. 317, 1736–1745 (2011). [DOI] [PMC free article] [PubMed] [Google Scholar]
- Wang N. N. et al. Mechanistic analysis of taxol-induced multidrug resistance in an ovarian cancer cell line. Asian Pac. J. Cancer. Prev. 14, 4983–4988 (2013). [DOI] [PubMed] [Google Scholar]
- Valsecchi M. et al. Sphingolipidomics of A2780 human ovarian carcinoma cells treated with synthetic retinoids. J. Lipid. Res. 51, 1832–1840 (2010). [DOI] [PMC free article] [PubMed] [Google Scholar]
- Prinetti A. et al. Altered sphingolipid metabolism in N-(4-hydroxyphenyl)-retinamide-resistant A2780 human ovarian carcinoma cells. J. Biol. Chem. 278, 5574–5583 (2003). [DOI] [PubMed] [Google Scholar]
- Wang J. R. et al. Improved sphingolipidomic approach based on ultra-high performance liquid chromatography and multiple mass spectrometries with application to cellular neurotoxicity. Anal. Chem. 86, 5688–5696 (2014). [DOI] [PubMed] [Google Scholar]
- Koyanagi S. et al. Elevation of de novo ceramide synthesis in tumor masses and the role of microsomal dihydroceramide synthase. Int. J. Cancer. 105, 1–6 (2003). [DOI] [PubMed] [Google Scholar]
- Hannun Y. A. & Obeid L. M. Principles of bioactive lipid signalling: lessons from sphingolipids. Nat. Rev. Mol. Cell. Biol. 9, 139–150 (2008). [DOI] [PubMed] [Google Scholar]
- Santalova E. A., Denisenko V. A. & Dmitrenok P. S. Structural Analysis of the Minor Cerebrosides from a Glass Sponge Aulosaccus sp. Lipids 50, 1209–1218 (2015). [DOI] [PubMed] [Google Scholar]
- Peng X. et al. Cerebrosides and 2-pyridone alkaloids from the halotolerant fungus Penicillium chrysogenum grown in a hypersaline medium. J. Nat. Prod. 74, 1298–1302 (2011). [DOI] [PubMed] [Google Scholar]
- Morad S. A. & Cabot M. C. Ceramide-orchestrated signalling in cancer cells. Nat. Rev. Cancer 13, 51–65 (2013). [DOI] [PubMed] [Google Scholar]
- Senchenkov A., Litvak D. A. & Cabot M. C. Targeting ceramide metabolism–a strategy for overcoming drug resistance. J. Natl. Cancer Inst. 93, 347–357 (2001). [DOI] [PubMed] [Google Scholar]
- Prinetti A. et al. Lack of ceramide generation and altered sphingolipid composition are associated with drug resistance in human ovarian carcinoma cells. Biochem. J. 395, 311–318 (2006). [DOI] [PMC free article] [PubMed] [Google Scholar]
- Veldman R. J. et al. Altered sphingolipid metabolism in multidrug-resistant ovarian cancer cells is due to uncoupling of glycolipid biosynthesis in the Golgi apparatus. Faseb J. 16, 1111–1113 (2002). [DOI] [PubMed] [Google Scholar]
- Wang H. et al. N-(4-Hydroxyphenyl)retinamide increases dihydroceramide and synergizes with dimethylsphingosine to enhance cancer cell killing. Mol. Cancer Ther. 7, 2967–2976 (2008). [DOI] [PubMed] [Google Scholar]
- Michel C. et al. Characterization of ceramide synthesis. A dihydroceramide desaturase introduces the 4,5-trans-double bond of sphingosine at the level of dihydroceramide. J. Biol. Chem. 272, 22432–22437 (1997). [DOI] [PubMed] [Google Scholar]
- Canals D., Perry D. M., Jenkins R. W. & Hannun Y. A. Drug targeting of sphingolipid metabolism: sphingomyelinases and ceramidases. Br. J. Pharmacol. 163, 694–712 (2011). [DOI] [PMC free article] [PubMed] [Google Scholar]
- Kok J. W. & Sietsma H. Sphingolipid metabolism enzymes as targets for anticancer therapy. Curr. Drug Targets 5, 375–382 (2004). [DOI] [PubMed] [Google Scholar]
- Itoh M. et al. Possible role of ceramide as an indicator of chemoresistance: decrease of the ceramide content via activation of glucosylceramide synthase and sphingomyelin synthase in chemoresistant leukemia. Clin. Cancer Res. 9, 415–423 (2003). [PubMed] [Google Scholar]
- Radin N. S. Killing cancer cells by poly-drug elevation of ceramide levels: a hypothesis whose time has come? Eur. J. Biochem. 268, 193–204 (2001). [DOI] [PubMed] [Google Scholar]
- Lavie Y., Cao H., Bursten S. L., Giuliano A. E. & Cabot M. C. Accumulation of glucosylceramides in multidrug-resistant cancer cells. J. Biol. Chem. 271, 19530–19536 (1996). [DOI] [PubMed] [Google Scholar]
- Lucci A. et al. Glucosylceramide: a marker for multiple-drug resistant cancers. Anticancer Res. 18, 475–480 (1998). [PubMed] [Google Scholar]
- Merrill A. H. Jr. Sphingolipid and glycosphingolipid metabolic pathways in the era of sphingolipidomics. Chem. Rev. 111, 6387–6422 (2011). [DOI] [PMC free article] [PubMed] [Google Scholar]
- Doria M. L. et al. Lipidomic analysis of phospholipids from human mammary epithelial and breast cancer cell lines. J. Cell. Physiol. 228, 457–468 (2013). [DOI] [PubMed] [Google Scholar]