

Abstract
Circulating tumor cells (CTCs) in peripheral blood have been recognized as a general biomarker for diagnosing cancer and providing guidance for personalized treatments. Yet due to their rarity, the challenge for their clinical utility lies in the efficient isolation while avoiding the capture of other non-targeted white blood cells (WBCs). In this paper, a wavy-herringbone (HB) microfluidic chip coated with antibody directly against epithelial cell adhesion molecule (anti-EpCAM) was developed for highly efficient and selective isolation of tumor cells from tumor cell-spiked whole blood samples. By extending the concept of the hallmark HB-Chip in literature, the wavy-HB chip not only achieves high capture efficiency (up to 85.0%) by micro-vortexes induced by HB structures, but also achieves high purity (up to 39.4%) due to the smooth wavy microstructures. These smooth wavy-HB structures eliminate the ultra-low shear rate regions in the traditional grooved-HB structures that lead to non-specific trapping of cells. Compared with the grooved-HB chip with sharp corners, the wavy-HB chip shows a significantly higher purity while maintaining similarly high capture efficiency. Furthermore, the wavy-HB chip has up to 11% higher captured cell viability over the grooved-HB chip. The distributions of tumor cells and WBCs along the grooves and waves are investigated to help understand the mechanisms behind the better performance of the wavy-HB chip. The wavy-HB chip may serve as a promising platform for CTC capture and cancer diagnosis.
Graphical Abstract
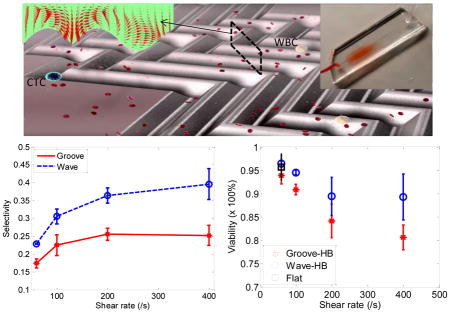
We present a microfluidic chip with wavy-herringbone micro-patterned surfaces for highly efficient and selective isolation of viable rare tumor cells.
Introduction
In the past few decades, microfluidic devices have been extensively employed in the fields of chemical, biomedical and environmental engineering, summarized in a few review articles.1–3 The device miniaturization using microfluidics leads to low reagent cost, low waste, fast reaction process and the predictable laminar flow pattern in microscale fluid flow.2,4–6 One exciting application is the early-stage detection of circulating tumor cells (CTCs),7,8 which are rare cells originally shed from a solid primary tumor and ultimately form a secondary tumor site in the course of blood circulation. Increasing studies have also shown strong clinical relevance of CTC amount for early cancer diagnostics,9 metastasis progress10,11 and therapy response12,13. In various common cancers, including breast cancer, pancreatic cancer and colorectal cancer, CTCs have been found to overexpress epithelial cell adhesion molecules (EpCAMs), which are not found in normal cells. Given the EpCAM expression difference, researchers have designed various microfluidic channels coated with anti-EpCAM for immuno-affinity based CTC detections.8,14–16 However, the challenge still lies in the efficiency of detection due to the scarce amount of CTCs, typically 1–10 cells vs. ~ 4 billion red blood cells (RBCs) and ~ 4 million white blood cells (WBCs) per 1 mL of patient blood. The typical laminar flow in a microfluidic device will not be able to address the challenge, especially for limited time and channel length.
Passive mixing within microfluidic devices has been proposed to induce increased collisions between cells and anti-EpCAM coated channel surfaces, thus enhancing the cell capture.17,18 One hallmark micro-mixer, first introduced by Stroock et al.,19 is the staggered grooved-herringbone (HB) mixer. The asymmetric grooved-HB structures stretch and fold the flows in the cross-section, yielding chaotic flows that are essential for generating efficient mixing. By adopting this principle, Stott et al.20 developed a HB-chip for high-throughput and efficient CTC capture, where in-vitro clinical utilities have been demonstrated with a capture efficiency of up to 79% under low shear rates of ~ 13/s. The cell dynamics in the micro-vortex flow induced by grooved-HB structures have also been studied extensively,21,22 which provide design guidelines for specific applications. Moreover, the structure simplicity of the grooved-HB structure allows for its wide integration into various platforms to enhance the cell-surface interactions. Wang et al.17 integrated grooved-HB structures on the top of nanostructured substrates, where the chaotic effect induced by grooved-HB dramatically enhanced the CTC capture performance with capture efficiency of up to 95% at a flow rate of 0.5 mL/h. Similar enhancements have been demonstrated in the NanoVelcro chip developed by Tseng’s group23,24 and CTC chips developed by Fan’s group.18,25
Besides capture efficiency, purity should also be taken into consideration when evaluating the performance of a CTC capture device. Purity is the ability to resist non-specific capture of WBCs, and is normally defined as the ratio of the number of captured CTCs to the total number of captured cells. It is highly desired to achieve both high capture efficiency and high purity.26 Yet, the trade-off between CTC capture efficiency and purity remains a universal problem for existing microfluidic platforms. In general, cell adhesion probability on a surface decreases with increased shear rate,27,28 which applies to both CTCs and WBCs. In another word, higher CTC capture efficiency is normally achieved under lower shear rate, under which WBCs tend to be non-specifically captured, resulting in a relatively low purity. This is especially true for the grooved-HB microfluidic chip, where trough regions with ultra-low shear rate (as shown in Figure 1(e)) have a high chance to trap WBCs. As a result, although high capture efficiency up to 79% was obtained in grooved-HB device, the purity was sacrificed down to 14%.20 One strategy to improve purity is to eliminate the low shear sharp corners, which are prone to non-specific binding for WBCs while keeping the chaotic effect provided by HB structures. Here, we fabricated a microfluidic chip integrated with wavy-HB structures (Figure 1(a)), where the smooth waves are expected to allow for smooth shear rate transitions and eliminate the ultra-low shear rate regions. In vitro tests with whole blood spiked with CTCs were performed in both grooved-HB chips and wavy-HB chips. The results show that similar capture efficiency is obtained in both chips, while the wavy-HB chip showed a 39.4% purity, significantly higher than the 25.7% in the grooved-HB chip under the same shear rate of 400/s. In the high shear rate range (200/s to 400/s), the wavy-HB chip showed up to two-fold higher purity than the grooved-HB chip.
Figure 1.

Working mechanism of the wavy-HB microfluidic chip for highly efficient and selective CTC capture. (a) Schematic figure of a single unit of the wavy-HB pattern. (b) Flow velocity components in the cross-section illustrate the micro-vortex. (c) Integral of cross flow over the unit for both grooved- and wavy-HB patterns. The contours of the shear rate in (d) wavy- and (e) corresponding grooved-HB chips. The color bar is shown with the unit of /s. The distortion of the images is due to cut-off of the range in order to make the color map clear. The rest area over the range is filled in black. (f) Theoretical analysis of cell-surface contact area along one period for both wave and groove patterns. For the groove pattern, two data points (2.31 μm2) are not shown when a cell is located in the intersection between the bottom and the side wall. (g) The shear rate along the arc length of both a groove and wave period (trough-ridge-trough: indicated by the dashed line in (d) and (e)) with a distance of a cell radius away from the surface. Here, the arc length is normalized to its period for both patterns.
In the following sections, the working principle for the proposed wavy-HB chip is first introduced. The capture performance was simulated numerically and compared with the grooved-HB chip. Then the fabrication method of wavy-HB chip is described followed by its morphology characterization. In vitro tests in both grooved-HB chips and wavy-HB chips were investigated and the test results were compared side-by-side in both chips. Cell distribution profiles were also studied to help understand the performance differences between the grooved-HB chip and the wavy-HB chip.
Materials and Methods
Microfluidic Chip Design, Fabrication and Assembly
Both grooved-HB chip and wavy-HB chip consist of a patterned polydimethylsiloxane (PDMS) layer at bottom and a PDMS channel layer on top, which are aligned and bonded after O2 plasma treatment. The grooved-HB PDMS layer was replicated from patterned master, which was fabricated by photolithography method.29 The optimized device layout was sent to CAD/Art Services to make the photomask, which was then used to make the patterned master with SU8-2050 (MicroChem, Newton, MA). The thickness of the pattern was controlled by the spinning speed of SU8 according to the datasheet provided by vendor, which determined both the channel depth and the groove depth. The pattern thickness was measured by a profilometer (Alpha-Step D-100 stylus profiler). To facilitate release of the PDMS mold to the SU8 master, 1H,1H,2H,2H-Perfluorodecyltrichlorosilane (FDTS) (Alfa Aesar) was coated on master by vapour deposition.30
A reflow approach, which has been widely used to make micro-lenses31,32, was adopted and modified to make the wavy-HB master, as shown in Figure 2(a). In detail, a grooved-HB PDMS layer was first fabricated as mentioned above, which was then bonded to a glass slide to ensure a relatively stiff PDMS layer. Meanwhile, an SU8 photoresist layer was spun on a silicon wafer, which was soft baked at 95 °C to remove solvent. The grooved-HB PDMS layer was then placed onto the photoresist at 95 °C for replication via capillary flow, during which air bubbles were carefully removed by pressing the bonded glass. The whole device was cooled down to room temperature (RT) and an uncured photoresist grooved-HB pattern was thus replicated by peeling off the PDMS layer. To create smooth wavy pattern, the uncured photoresist pattern was heated to 55 °C, where the photoresist could reflow to a certain extent. The heating period was well controlled and checked every 10 s by optical microscope till the waves were formed (typically 7–10 mins). Devices with different total heating periods were fabricated to ensure at least one of the resulted undulations was of the desired dimensions. Finally, the wavy-HB SU-8 pattern was UV cured at 365 nm with an intensity of 4.6 mW/cm2, followed by a treatment of FDTS. The micropattern topography and morphology was examined by a profilometer and an optical microscope, as shown in Figure 2(b)–(e). Due to thermal reflow, the final pattern depth decreased from 63 μm (grooved-HB) to 45 μm (wavy-HB). To ensure the wavy-HB chip has a similar depth of the grooved-HB chip for later cell capture comparison, we used the grooved-HB chip with a groove depth of 45 μm.
Figure 2.

Illustration of the wavy-HB chip and its fabrication process. (a) Fabrication process of the wavy-HB master. The “level down” and “level up” are due to the photoresist melting. Micrograph images of (b) top view for the silicon molds (Scale bar, 200 μm) and (d) side view for the assembled chip (Scale bar, 50 μm) illustrate the detail periodic designs and the wavy structures. The assembled chip was cut along the dashed line marked in (b) to obtain the side view. (c) and (e) sketch the layout of the wavy-HB structures with the detailed parameters. The red spheres stand for cells flowing in the channel. (f) Sample injection into a wavy-HB microfluidic device consisting of one inlet and one outlet. (Scale bar, 10 mm)
Cell Culture and Blood Preparation
HCT-116, a colorectal cancer cell line, was used as a model CTC cell line in this study. Cultured at 37 °C, HCT-116 cells were incubated with Dulbecco’s Modified Eagle’s Medium (Sigma Aldrich) supplemented with 10% fetal bovine serum (Invitrogen) and 1% penicillin/streptomycin (Sigma Aldrich). Media was refreshed every 2–3 days. When cells reached 80–90% confluency, they were subcultured and 0.05% Trypsin–0.53 mM EDTA was used for cell detachment. Fresh human whole blood samples with Li Heparin as the anti-coagulant agent were purchased from Innovation Research.
Cell Capture Test and Imaging
Before the cell capture test, both the grooved-HB chip and the wavy-HB chip were functionalized with anti-EpCAM following a chemistry reaction described in literature.33 Briefly, 5% (v/v) 3-mercaptopropyl trimethoxysilane (MPTS) in ethanol was first injected through the microfluidic chips for 30 min. at RT. Chips were then incubated with 0.01 mM N-y-maleimidobutyryloxysuccinimide ester (GMBS) in ethanol for 30 mins at RT, followed by an overnight incubation of 10 μg/mL NeutrAvidin in phosphate buffered saline (PBS) at 4 °C. Within 4 h of the flow test, the devices were incubated with 10 μg/mL33,34 biotinylated goat anti-human EpCAM in 1% (w/v) bovine serum albumin (BSA) in PBS solution for 2 h at RT, followed by a purging process with 3% BSA solution containing 0.05% Tween20 for 30 min. Between each injection, PBS or ethanol solution was used to flush away any unbound molecules in the suspension. To ensure the consistency for each device, all the injections were performed using a syringe pump (Harvard Apparatus) at a flow rate of 5 mL/h.
HCT-116 cells detached from culture disks were diluted in PBS solution to 103–105/mL which was calculated by a hemocytometer. To reduce the cell sedimentation in the tube during the flow test, 4 mg/mL alginated PBS solution was adopted which mimics the blood viscosity.35 For blood tests, pre-labeled HCT-116 cells with cell-tracker (Life Technology) were spiked into blood and fully mixed by gentle pipetting. Cell samples of 50–250 μL were then injected into the microfluidic chips using a syringe pump in prescribed flow rates. Immediately after the cell injection, PBS buffer solution was injected to remove all suspended cells at a flow rate of 3.6 mL/hr with a total volume of 1 mL. Captured cells were then fixed using 4% paraformaldehyde for 25 mins at RT and incubated with 0.2% Triton X-100 in PBS for 5 mins to permeabilize cell membranes. Cell nuclei were subsequently stained with DAPI solution for 20 minutes. After finishing the staining process the devices were flushed by PBS solution and kept at 4 °C. To differentiate tumor cells and WBCs, only cells that were cell-tracker positive and DAPI positive were treated as HCT-116 cells, while cells which were cell-tracker negative and DAPI positive were treated as WBCs. Only cells with intact morphology were considered.
Cell Viability Assay
Viability of captured tumor cells was studied by performing LIVE/DEAD assay. Specifically, a cocktail including 1 μM calcein-AM and 1 μM ethidium homodimer (EthD-1) was flushed through the microfluidic chip. After 25 mins’ incubation at RT, PBS solution was added to remove the LIVE/DEAD cocktail. Stained tumor cells were then observed under fluorescent microscope. Only cells which are calcein-AM (+) and EthD-1 (−) are treated as live, while cells which are EthD-1 (+) are treated as dead. Cell viability was defined as the ratio between the number of live cells and the total number of captured cells.
Finite Element Simulation
Customized MatLab codes combined with Comsol simulations were developed36,37 to simulate the cell dynamics in the microfluidic chips. Following previous simulation studies22, cells were treated as particles following streamlines to simplify the simulation process. Cell-cell/cell-fluid interactions and the non-Newtonian effects are over the scope of this study and not included in this model. In the Comsol model, sidewalls were set as the periodic boundaries, which mimic the real setup where there are repetitive parallel units. At least 282143 meshes were used to ensure its accuracy and all the simulation results were then exported to MatLab for computing the particle motion. Cells were treated to be captured when the cell-surface distance was smaller than the radius, i.e., 10 μm.
Results and Discussions
Working Principle
The wavy-HB chip is different from the traditional grooved-HB chip by replacing the sharp corners in the latter with smooth wavy structures. The wavy-HB chip consists of repetitive units, each of which has six wavy-HB structures in the 1st-half cycle staggered with another six wavy-HB structures in the 2nd-half cycle, as depicted in Figure 1(a). The design parameters were selected based on prior studies on the mixing effect of the grooved-HB chip.38–40 However, we note that most of prior studies have not considered the inherent particulate properties of cells: the main contribution for enhanced cell capture comes from cell-surface direct collisions while the center rotational flow might not contribute to the cell capture. To our knowledge, only one pilot study by Forbes et al.19 provides a design guide explicitly based on cell-surface interactions. By using the particulate model described in the Methods section, the optimized parameters were determined and we found that most optimized parameters are similar to those in the previous mixing studies: channel height of 50 μm in the range of 30 μm-110 μm, wave amplitude (equivalent to half of groove depth) of 22.5 μm in the range of 6 μm-440 μm, short/long arm length of 100 μm/200 μm in the range of 100 μm-800 μm and oblique angle between HBs and the flow axis of 45 degrees in the range of 30°–150°. Detailed geometrical information is shown in Figure 2(c–e). The numerical optimization processes for these parameters are not discussed in detail in this study except for the wavelength, which differs from other literature work. As shown in Figure S1, the pattern period was optimized in the range of 40 μm-240 μm, with 160 μm selected in this study for the concept validation of the proposed wavy-HB chip.
With the prototype model built, the working mechanism of the wavy-HB chip is explained from capture efficiency and purity. Capture efficiency is defined as the amount ratio of captured tumor cells to the total spiked tumor cells. Purity is defined as the amount ratio of captured tumor cells to the total captured cells including tumor cells and non-specifically captured WBCs.8,20
To achieve high cell capture efficiency, we used HB structures here to take advantage of the chaotic effect and micro-vortices as illustrated in Figure 1(b). To quantify the mixing effect, the integrals of cross-flow in one unit for both grooved-HB chips and wavy-HB chips were calculated following:
where v and w are velocity components in y and z directions, respectively. The comparison results showed that the wavy-HB chip has nearly the same flow mixing performance as that of the grooved-HB chip (see Figure 1(c)). In addition to the mixing effect, pattern surface area and cell-surface contact area were considered to predict cell capture efficiency. Here, cell-surface contact area was calculated for the fractional cell membrane with a separation distance of a ligand-receptor bond length, i.e. 20 nm37, from the substrate. On substrates of different surface curvatures, cells have different cell-surface contact modes. As sketched in Figure S2, on a grooved-HB pattern, a cell contacts the flat region of the patterned surface vertically, while on a wavy-HB pattern, the cell contacts the surface either on the concave trough or the convex peak. Although Figure S3 shows that the total pattern surface area of the wavy-HB pattern is slightly less than that of the grooved-HB pattern (6.34x10⁻⁸ μm2 vs. 8.98x10⁻⁸ μm2), the effective cell-surface contact area for the wavy-HB pattern outweighs that for the grooved-HB pattern along the majority surface of one period, as shown in Figure 1(f). Both theoretical and numerical investigations suggest a comparable cell capture performance for the wavy-HB chip compared to the grooved-HB chip.
To achieve high cell capture purity, we integrated smooth wavy structures into the wavy-HB chip, as illustrated in Figure 1(a, d). The smooth corners in the wavy-HB chip eliminate regions with ultra-low shear rate presented in the grooved-HB chip, which tend to trap WBCs non-specifically. The shear rate at the wall was derived as follows,
where Q is the flow rate, H and W are the height and width of the channel, respectively. The shear rate at a specific location was calculated from the spatial derivation of the local velocity as follow,
where u, v and w are the component velocities in the x, y and z direction, respectively. As indicated in Figure 1(g), under the same inlet flow condition with a shear rate of 60/s, the minimum shear rate in the wavy-HB chip (6.41 /s) is almost 15-fold higher than that in the grooved-HB chip (0.44 /s). It was also noticed that the ultra-low shear rate happens in both bottom left and right corners in the grooved-HB chip. As a result, the wavy-HB chip is expected to have a better performance in purity when compared with the grooved-HB chip.
Wavy-HB Chip Design, Fabrication and Assembly
Figure 2(a) shows the reflow fabrication process for making a wavy-HB silicon master. The reproducibility of the fabrication method were validated by measuring the wavy profiles in three fabricated samples. Figures S4 indicates that the reflow method is consistent in generating wavy patterns, although further improvement is still needed. The undulation features of the wavy-HB structures were qualitatively observed using optical microscopy in Figure 2(b), with detailed dimensions measured in Figure 2(c). To further characterize the wavy structures, a replicated PDMS wavy-HB layer was cut along the wave propagation direction and observed under the microscope. Figure 2(d) clearly shows that wavy structures were obtained from the reflow process with a wavelength of 160±2 μm and an amplitude of 22.5±1.5 μm (see Figure 2(e)). Figure 2(f) shows a typical assembled wavy-HB chip under flow tests. To perform comparison flow tests, geometry equivalent grooved-HB chips were fabricated and assembled following the traditional photolithography method (Images not shown).
Wavy-HB Performance Validation by Cell Capture Tests
To evaluate the device performance, the distributions of both tumor cells and WBCs along the flow direction were investigated first. It is found that focusing regions of tumor cells and WBCs tend to move towards the tail sections with increasing shear rates in both grooved-HB and wavy-HB chips (see Supporting Information and Figure S5). This shift is speculated due to the increased shear force proportional to the increasing shear rate, which agrees well with the results in literature.17
To demonstrate the performance of the proposed wavy-HB chip, cell tests in both PBS buffer solution and whole blood were performed. To differentiate tumor cells and WBCs, fluorescent images were recorded through the whole chip. As illustrated in Figure 3(a)–(c), only cells of celltracker (+) and DAPI (+) were treated as tumor cells, while cells of celltracker (−) and DAPI(+) were treated as WBCs. The overall trend of capture efficiency and purity under different shear rates agrees well with literature results23: Figure 3(d) shows that capture efficiency decreases with increased shear rate in all cases due to the decreased duration for cell-surface interactions and the increased shear detachment force; Figure 3(e) shows that purity increases with increasing shear rate mainly due to the increased shear detachment force to flush away more WBCs (non- specific, weak bonds) than tumor cells (specific, strong bonds). In comparison to the grooved-HB chip, the wavy-HB chip has a similar cell capture performance with a difference smaller than 10.0% in most test conditions, which was already indicated by the similar mixing effects in Figure 1(c). On the other hand, the wavy-HB chip performs significantly better than the grooved-HB chip in purity especially in the high shear rates of 200 /s and 400 /s: enhancements of 43.4% (36.7%±2.2% vs. 25.6%±1.7%) and 53.3% (39.4%±4.3% vs. 25.7%±2.1%) are achieved, respectively. In another word, much less WBCs were non-specifically captured in the wavy- HB chip. Under the highest capture efficiency condition (i.e. 60/s) where 1 mL blood test was performed, around 2500 WBCs were captured on the wavy-HB chip in comparison to 4500 WBCs on the grooved-HB chip. These results also agree with the previous finding that HB pattern overweighs the micropost-based CTC-Chip (around 5000 WBCs) in terms of the purity.8,20 By introducing asymmetrical structures, Sheng et al.18 improved the purity but the amount of non-specific WBC was still around 3500.
Figure 3.

Tumor cells capture in the wavy-HB and grooved-HB chips (a)–(c) Cell-tracker and DAPI fluorescent differentiation of tumor cells and WBCs. Both tumor cells and WBCs are DAPI positive in (a), while only pre-labeled CTCs are cell-tracker positive in (b). The merged image in (c) shows only cells which are DAPI (+) and cell-tracker (+) are regarded as tumor cells, while cells which are DAPI (+) and cell-tracker (−) are regarded as WBCs. (Scale bar, 80 μm) (d) Capture efficiency vs. shear rate in the grooved-HB chip, the wavy-HB chip, and the flat device. (e) Purity vs. shear rate in both chips. Error bars stand for standard deviations in three independent experimental trials.
Notably, higher tumor cell capture efficiency was achieved in blood cases compared to PBS cases in both wavy-HB chips and flat devices, as shown in Figure 3(d). Taking the shear rate of 60/s as an example, an enhancement of 8.83% was obtained in the wavy-HB chip (85.0%±6.8% vs. 78.1%±10.1%). Furthermore, an enhancement up to 67.4% was obtained in the control flat channel (32.8%±5.8% vs. 19.6%±0.9%). We hypothesize that the enhancement comes from the margination effect of tumor cells towards the channel surface. It has been suggested that more deformable red blood cells would migrate towards the channel center while the stiffer tumor cells are repelled towards the channel surface.41 By comparing the enhancement level for the wavy-HB chip and the flat device, it was also suggested that the margination effect induced by blood contributes more in the flat channel. The margination effect in the wavy-HB chip might be disturbed and thus reduced by the micro-vortexes. Interestingly, although similar enhancement attributed to blood was not observed in the grooved-HB chip at 60/s (92.1%±4.6% vs. 95.0%±12.4%), an enhancement up to 123.5% was obtained at high shear rates, i.e., 200/s and 400/s. This suggests that the existence of normal cells contributes more to efficient tumor cell capture at high shear rate, although the mechanism is not clear yet.
The viability of tumor cells under different shear rates was also studied by performing the LIVE/DEAD assay in both grooved-HB and wavy-HB chips, using the flat channel as a control. Figure 4(a)–(d) show typical micrographs of LIVE/DEAD assay results under 60/s and 400/s for both chips. Cell viability was then calculated by counting the amount of live cells and dead cells in these fluorescent images. As illustrated in Figure 4(f), the viability decreases with increased shear rate, indicating that captured tumor cells are prone to lose their function under high shear rate. The comparison reveals that the wavy-HB chip offers a higher cell viability than the grooved-HB chip, suggesting that the captured tumor cells are more physically intact in the wavy-HB chips. Especially under the high shear rate of 400/s, the cell viability enhancement in the wavy-HB chip is more significant over the grooved-HB chip with an 11% improvement (89.29%±4.91% vs. 80.65%±2.64%). It is speculated that more cell deaths are attributed to damages induced by sharp corners in the grooved-HB chip.
Figure 4.

Viability of captured tumor cells in the wavy-HB and grooved-HB chips. Representative fluorescent micrographs of the captured tumor cells in the grooved-HB chip after LIVE/DEAD a under the shear rate of (a) 60/s and (b) 400/s. LIVE/DEAD stain results in the wavy-HB chip under the shear rate of (c) 60/s and (d) 400/s, respectively. (e) LIVE/DEAD stain results in the flat channel under the shear rate of 60/s. Cells which are calcein-AM (+) and EthD1 (+) are treated as dead, as indicated by white arrows in (a)–(e). (f) Quantitative analysis of viability of captured tumor cells in the wavy-HB and grooved-HB chips under different shear rates. Error bars stand for standard deviations in three independent experimental trials. (Scale bar, 160 μm)
In addition, the clinical utility of the wavy-HB chip was also validated by the isolation of tumor cells in PBS buffer solution at concentrations of 10, 100, 500 and 1000 cells/mL. The test shear rate was 60/s for all cases, where capture efficiencies of around 80% were achieved, as shown in Figure S6. The linear regression study results show that the device has a consistent performance under the test conditions with different spiked tumor cell amounts. This suggests that the wavy-HB chip has the potential to fulfill the clinical requirement to detect very rare CTCs, i.e., 1–10 cells/mL blood.
Cell Distribution along One Pattern Period and Its Indication for Device Performance
Distribution of tumor cells and WBCs along a single pattern period was then studied. Representative fluorescent optical micrographs of tumor cell distributions in the grooved-HB chip and wavy-HB chip are shown in Figure 5(a) and (b), respectively. A period is defined as the region between two consecutive troughs which is equally distributed into 20 sections following the flow direction, as illustrated in Figure 5(c)–(f). For tumor cell distributions under increased shear rate, grooved-HB patterns have a focusing region in the trough close to the upstream groove sidewall, with the section shifting more towards the groove side wall. On the other hand, wavy-HB patterns have a relatively focusing region shifting from the lower upstream slope to higher upstream slope, as shown400/s in Figure 5(c)–(d). For WBC distributions under increasing shear rate, grooved-HB patterns have focusing regions in both upstream and downstream trough regions with the section shifting more towards the downstream trough section, while wavy-HB patterns have focusing sections shifting from trough sections to the regions close to the peak, as shown in Figure 5(e)–(f). Notably, the WBC distributions under increasing shear rate exhibit a dramatic difference in these two chips: WBCs tend to be trapped in the trough sections close to the downstream side wall for the grooved-HB chip, especially under larger shear rates (200/s and 400/s) as shown in Figure 5(e), while for the wavy-HB chip, WBCs shift from the trough to the regions close to the peak where shear detachment force is large and WBCs detachment is easy to happen as shown in Figure 5(f). This trend difference is probably attributed to the geometry difference: the sharp grooved structure resists WBCs from rolling upwards to the ridge while the smooth wavy structure allows WBCs to roll towards to the peak region. Following this reasoning, under larger shear rates, more WBCs in the wavy-HB chip are prone to be pushed from the trough to the peak, where the shear detachment force is relatively larger as shown in Figure 1(d). As a result, the wavy-HB chip is subjective to a high purity under larger shear rate, which agrees with the experimental data in Figure 3(e).
Figure 5.

Illustrative micrograph images of tumor cells distributions in (a) a grooved-HB chip and (b) a wavy-HB chip. (Scale bar, 80 μm) Quantitative distributions of tumor cells along one pattern period in (c) the grooved-HB chip and (d) the wavy-HB chip. Distribution of WBCs along one pattern period in (e) the grooved-HB chip and (f) the wavy-HB chip. One pattern period is defined as trough-peak-trough indicated as the dotted line in (a) and (b). A pattern period is equally divided into 20 sections along the flow direction with a width of 8 μm. Schematic images of the divided patterns are also shown in (c)–(f). Curve fits are used to indicate the cell distribution patterns.
Discussion
The distribution profiles of tumor cells and WBCs shown in Figure 5 are explained by a two-regime based mechanism, i.e. adhesion-detachment force balance and cell-surface contact frequency. In other words, the peak capture regions are always where there are more cell-surface contacts with the pre-requisite of the adhesion force large enough to resist the shear detachment force. In the grooved-HB patterns, two factors contribute to the cell distribution: (1) large cell-surface contact frequency exists in both groove sides and the ridges, as shown in Figure 6(c); (2) cells experience larger shear detachment forces in the ridges and smaller ones in the troughs, as indicated in Figure 1(d)–(e) and Figure 1(g). As a result, both tumor cells and WBCs tend to be collected in the trough sections close to the groove sides, as indicated in Figure 5(c) and Figure 5(e). Moreover, with increasing shear rate, tumor cells tend to be focused close to the upstream sidewalls while WBCs are close to the downstream sidewalls, which is reasoned due to the difference in adhesion force. The weaker non-specific adhesion force for WBCs yields a shift of focusing regions towards the smaller shear rate sites, namely, the troughs close to the downstream sidewalls. Similarly, in the wavy patterns, with relatively strong adhesion forces due to the larger cell-surface contact areas, tumor cells tend to be collected in the higher upstream sections, which have higher cell-surface contact frequency (Figure 6(c)). With the increasing shear rate, the slight shift towards the higher downstream sections is due to the increasing detachment force that makes cell distribution more uniform. On the other hand, WBCs are speculated to readily shift along the wave due to weak adhesion forces. At lower shear rates (60/s and 100/s), WBCs are easily removed in the regions with higher shear rate, i.e. ridge, thus they tend to be collected at the troughs where the shear rate is low (see Figure 1(d)). With shear rate continuously increasing to higher values (200/s and 400/s), non-specifically captured WBCs are pushed back and forth along the wave and their distributions shift as indicated in Figure 5(f). The detail non-specific adhesion mechanism for WBCs on anti-EpCAM coated surface is not clear so far.
Figure 6.

Numerical simulation reveals cell-surface contact frequency in the grooved-HB chip and the wavy-HB chip. The locations for cell-surface interactions, including the pattern ridge (green), channel top (red), pattern bottom (black) and pattern side (blue) in (a) the grooved-HB chip and (b) the wavy-HB chip. The upstream and downstream along one streamline is illustrated in (a). (c) Normalized cell-surface contact frequency in different locations for both chips.
The tumor cell capture experimental results are in good agreement with the computational prediction. On one hand, the overall tumor cell capture efficiency is well predicted by the integral of cross flow, which indicates similar mixing effects between grooved-HB and wavy-HB chips. The slight difference of capture efficiency might be attributed to the decreased surface area during the reflow process, where the surface areas of a single pattern period for the grooved-HB and wavy-HB pattern are 8.98×10⁻⁸ m2 and 6.34×10⁻⁸ m2, respectively (see Figure S3). It should be noted that local distribution does not necessarily offer the overall picture of the tumor cell capture efficiency. As shown in Figure S5, although a larger portion of tumor cells are trapped in the head sections of the grooved-HB chip, the distribution decreases very fast along the flow direction. On the contrary, the wavy-HB chip shows a relatively uniform distribution along the whole flow direction. To evaluate cell capture efficiency, accumulation of captured cell across the whole chip should be considered. On the other hand, the computational results are used to explain the local distribution of tumor cells. For example, compared to the wavy-HB chip, the trough section for the grooved-HB chip has lower shear rate (see Figure 1(d–e)) but shows similar cell surface contact frequency (see Figure 6(c)). As a result, a larger proportion of captured tumor cells are present in the trough section for the grooved-HB chip in comparison with the wavy-HB chip as shown in Figure 5(c–d). Meanwhile, the lower shear rate in the trough region also brought more WBCs to be non-specifically captured, which was confirmed by the WBC local distributions as shown in Figure 5(e–f).
In literature, there have been a few attempts to develop tumor cell isolation chips derivative from the grooved-HB patterns,42,43,23 but all with sharp corners. Our theoretical and computational analyses reveal the fundamental limitation of the sharp grooved patterns, i.e., ultra-low shear rate regions close to the groove corners (see Figure 1(g)) thus increasing the chance of non-specific cell capturing. By introducing the smooth wavy-HB structures in the current configuration, ultra-low shear rate regions are eliminated as shown in Figure 1(g). Our results have demonstrated an enhanced purity by 43.4% compared to that from the grooved-HB structures, which is crucial for down-stream analysis like high quality cell profiling and thorough genomic analysis.44,45 For example, it is an essential need to achieve high purity for DNA microarray analysis.46 Enhanced purity obtained in our wavy-HB chip can reduce the influence introduced by impure WBCs, leading to a more reliable gene data analysis. Further enhancement can be achieved by introducing asymmetry between the trough and ridge sections of the wave, as WBCs are easily trapped in the trough as shown in Figure 5(e–f), which is also suggested by other work.18 More importantly, the proposed idea to smooth sharp grooves can be adopted as a general strategy in other existing devices to improve the purity while preserve capture efficiency.
Challenges still exist on the anti-EpCAM based approach for CTC isolation. First, CTCs present heterogeneous phenotypes for different cancer types47 and EpCAM expression levels could also be down-regulated over the course of metastasis and dissemination.48 Thus, the capture yield may drop for CTC subpopulations of non-epithelial and EpCAM down-regulated phenotypes. A potential strategy to tackle this challenge is to vary the antibody type in the wavy-HB chip.49 It was also demonstrated that higher antibody coating density can enhance CTC isolation34, which can reduce the loss of EpCAM down-regulated CTCs. Another challenge for the current approach lies in how to effectively release captured CTCs. Xu et al.50 tried to directly detach the captured CTCs by flushing air while the release efficiency was only 45% partially due to the dead volume in the sharp grooves. This can be significantly improved in our smooth wavy pattern by eliminating the sharp groove regions where cells are readily trapped. To further overcome this problem, we can replace anti-EpCAM by other environment stimulated substances, like aptamers51 and polymer materials52. We believe the combined high efficiency and high purity in our wavy-HB chip together with the modified surface coating will allow for further enhancement of CTC capture and post-analysis for various applications.
Conclusions
In summary, a wavy-HB chip coated with anti-EpCAM has been demonstrated with high efficiency and purity in isolation of tumor cells from the spiked whole blood. Due to the staggered HB structures adopted from the hallmark grooved-HB chip, high capture efficiency up to 85.0% is achieved by the induced passive mixing. In comparison with the grooved-HB chip with sharp corners, the wavy-HB chip has the smooth wavy patterns, leading to nearly two-fold enhanced cell capture purity up to 39.4%. The enhancement is mainly due to the lack of the ultra-low shear rate regions in the grooved-HB chip. In addition, the wavy-HB chip serves as a better tumor cell isolation platform in that its inherent gentle nature induced by the smooth undulations (maximum shear rate is 645.9 /s compared to 1084.1 /s in the grooved-HB chip in the shear rate of 400 /s) protects cells from deformation forces and keeps cells intact. Despite the promising results achieved in the wavy-HB chip, it is noticed that the trade-off between capture efficiency and purity still exists. It has been suggested that integration of nanostructures could potentially address this issue,17,53,54 which will be implemented into our wavy-HB chip in the future. Further, patient blood samples will be tested on the wavy-HB chip to validate its clinical utility.
Supplementary Material
Acknowledgments
This work was supported in part by National Science Foundation (NSF) grant CBET-1264808 (to Y. Liu and X. Cheng), DMS-1516236 (to Y. Liu), and National Institute of Health (NIH) grant EB015105 (to Y. Liu), NSF grant CBET-1263940 (to S. Yang). The authors thank Dr. Younghyun Cho in University of Pennsylvania for helpful discussions and suggestions, Dr. Susan Perry in Lehigh University for sharing lab facilities and Dr. Lynne Cassimeris in Lehigh University for sharing the HCT-116 cell line.
Footnotes
Electronic Supplementary Information (ESI) available. See DOI: 10.1039/x0xx00000x
References
- 1.Martin RS, Root D, Spence DM, Martin RS. 2006 [Google Scholar]
- 2.Beebe DJ, Mensing Ga, Walker GM. Annu Rev Biomed Eng. 2002;4:261–286. doi: 10.1146/annurev.bioeng.4.112601.125916. [DOI] [PubMed] [Google Scholar]
- 3.Jokerst JC, Emory JM, Henry CS. 2012:24–34. doi: 10.1039/c1an15368d. [DOI] [PubMed] [Google Scholar]
- 4.Liu Y, Wang S, Song Y, Yang J. Micro Nanosyst. 2012;4:254–272. [Google Scholar]
- 5.Chen J, Zhou Y, Wang D, He F, Rotello VM, Carter KR, Watkins JJ, Nugen SR. Lab Chip. 2015;15:3086–3094. doi: 10.1039/c5lc00515a. [DOI] [PubMed] [Google Scholar]
- 6.Qin Z, Chan WCW, Boulware DR, Akkin T, Butler EK, Bischof JC. Angew Chemie - Int Ed. 2012;51:4358–4361. doi: 10.1002/anie.201200997. [DOI] [PMC free article] [PubMed] [Google Scholar]
- 7.T. H. E. Analyst, T. National, C. Centre, A. Asgar, W. L. National and C. Centre. 2014 [Google Scholar]
- 8.Nagrath S, Sequist LV, Maheswaran S, Bell DW, Irimia D, Ulkus L, Smith MR, Kwak EL, Digumarthy S, Muzikansky A, Ryan P, Balis UJ, Tompkins RG, Haber DA, Toner M. 2007:450. doi: 10.1038/nature06385. [DOI] [PMC free article] [PubMed] [Google Scholar]
- 9.Ilie M, Hofman V, Long-Mira E, Selva E, Vignaud JM, Padovani B, Mouroux J, Marquette CH, Hofman P. PLoS One. 2014;9:e111597. doi: 10.1371/journal.pone.0111597. [DOI] [PMC free article] [PubMed] [Google Scholar]
- 10.Marx V. Nature. 2013:2–6. [Google Scholar]
- 11.Paterlini-Brechot P, Benali NL. Cancer Lett. 2007;253:180–204. doi: 10.1016/j.canlet.2006.12.014. [DOI] [PubMed] [Google Scholar]
- 12.Miyamoto DT, Sequist LV, Lee RJ. Nat Rev Clin Oncol. 2014;11:401–12. doi: 10.1038/nrclinonc.2014.82. [DOI] [PubMed] [Google Scholar]
- 13.de Bono JS, Scher HI, Montgomery RB, Parker C, Miller MC, Tissing H, Doyle GV, Terstappen LWWM, Pienta KJ, Raghavan D. Clin Cancer Res. 2008;14:6302–9. doi: 10.1158/1078-0432.CCR-08-0872. [DOI] [PubMed] [Google Scholar]
- 14.Murlidhar V, Zeinali M, Grabauskiene S, Ghannad-Rezaie M, Wicha MS, Simeone DM, Ramnath N, Reddy RM, Nagrath S. Small. 2014:1–10. doi: 10.1002/smll.201400719. [DOI] [PMC free article] [PubMed] [Google Scholar]
- 15.Chen Y, Li P, Huang PH, Xie Y, Mai JD, Wang L, Nguyen NT, Huang TJ. Lab Chip. 2014;14:626–45. doi: 10.1039/c3lc90136j. [DOI] [PMC free article] [PubMed] [Google Scholar]
- 16.Asghar W, Wan Y, Ilyas A, Bachoo R, Kim Y, Iqbal SM. Lab Chip. 2012;12:2345. doi: 10.1039/c2lc21012f. [DOI] [PubMed] [Google Scholar]
- 17.Wang S, Liu K, Liu J, Yu ZT, Xu X, Zhao L, Lee T, Lee EK, Reiss J, Lee Y, Chung LWK, Huang J, Rettig M, Seligson D, Duraiswamy KN, Shen CK, Tseng H. 2011:3084–3088. doi: 10.1002/anie.201005853. [DOI] [PMC free article] [PubMed] [Google Scholar]
- 18.Sheng W, Ogunwobi OO, Chen T, Zhang J, George TJ, Liu C, Fan ZH. Lab Chip. 2014;14:89–98. doi: 10.1039/c3lc51017d. [DOI] [PMC free article] [PubMed] [Google Scholar]
- 19.Stroock AD, Dertinger SKW, Ajdari A, Mezic I, Stone Ha, Whitesides GM. Science. 2002;295:647–651. doi: 10.1126/science.1066238. [DOI] [PubMed] [Google Scholar]
- 20.Stott SL, Hsu C-H, Tsukrov DI, Yu M, Miyamoto DT, Waltman Ba, Rothenberg SM, Shah AM, Smas ME, Korir GK, Floyd FP, Gilman AJ, Lord JB, Winokur D, Springer S, Irimia D, Nagrath S, Sequist LV, Lee RJ, Isselbacher KJ, Maheswaran S, Haber Da, Toner M. Proc Natl Acad Sci U S A. 2010;107:18392–18397. doi: 10.1073/pnas.1012539107. [DOI] [PMC free article] [PubMed] [Google Scholar]
- 21.Hsu CH, Di Carlo D, Chen C, Irimia D, Toner M. Lab Chip. 2008;8:2128–2134. doi: 10.1039/b813434k. [DOI] [PMC free article] [PubMed] [Google Scholar]
- 22.Forbes TP, Kralj JG. Lab Chip. 2012;12:2634. doi: 10.1039/c2lc40356k. [DOI] [PubMed] [Google Scholar]
- 23.Lu YT, Zhao L, Shen Q, Garcia Ma, Wu D, Hou S, Song M, Xu X, OuYang WH, OuYang WWL, Lichterman J, Luo Z, Xuan X, Huang J, Chung LWK, Rettig M, Tseng HR, Shao C, Posadas EM. Methods. 2013;64:144–152. doi: 10.1016/j.ymeth.2013.06.019. [DOI] [PMC free article] [PubMed] [Google Scholar]
- 24.Hou S, Zhao L, Shen Q, Yu J, Ng C, Kong X, Wu D, Song M, Shi X, Xu X, Ouyang WH, He R, Zhao XZ, Lee T, Brunicardi FC, Garcia MA, Ribas A, Lo RS, Tseng HR. Angew Chemie - Int Ed. 2013;52:3379–3383. doi: 10.1002/anie.201208452. [DOI] [PMC free article] [PubMed] [Google Scholar]
- 25.Sheng W, Chen T, Tan W, Fan ZH. ACS Nano. 2013;7:7067–7076. doi: 10.1021/nn4023747. [DOI] [PMC free article] [PubMed] [Google Scholar]
- 26.Chen J, Li J, Sun Y. Lab Chip. 2012;12:1753. doi: 10.1039/c2lc21273k. [DOI] [PubMed] [Google Scholar]
- 27.Decuzzi P, Ferrari M. 2006;27:5307–5314. doi: 10.1016/j.biomaterials.2006.05.024. [DOI] [PubMed] [Google Scholar]
- 28.Zhang X, Huk DJ, Wang Q, Lincoln J, Zhao Y. Biomicrofluidics. 2014;8:54106. doi: 10.1063/1.4894783. [DOI] [PMC free article] [PubMed] [Google Scholar]
- 29.Xia Y, Whitesides GM. Annu Rev Mater Sci. 1998;28:153–184. [Google Scholar]
- 30.Bu IYY, Oei SP. Appl Surf Sci. 2010;256:6699–6704. [Google Scholar]
- 31.O’Neill FT, Sheridan JT. Opt - Int J Light Electron Opt. 2002;113:391–404. [Google Scholar]
- 32.Roy E, Voisin B, Gravel JF, Peytavi R, Boudreau D, Veres T. Microelectron Eng. 2009;86:2255–2261. [Google Scholar]
- 33.Wang S, Wan Y, Liu Y. Nanoscale. 2014;6:12482–12489. doi: 10.1039/c4nr02854f. [DOI] [PMC free article] [PubMed] [Google Scholar]
- 34.Jeon S, Hong W, Lee ES, Cho Y. 2014:4. [Google Scholar]
- 35.Launiere CA, Czaplewski GJ, Myung JH, Hong S, Eddington DT. 2011:549–557. doi: 10.1007/s10544-011-9524-8. [DOI] [PubMed] [Google Scholar]
- 36.Wang S, Zhou Y, Tan J, Xu J, Yang J, Liu Y. Comput Mech. 2014;53:403–412. doi: 10.1007/s00466-013-0968-y. [DOI] [PMC free article] [PubMed] [Google Scholar]
- 37.Tan J, Wang S, Yang J, Liu Y. Comput Struct. 2013;122:128–134. doi: 10.1016/j.compstruc.2012.12.019. [DOI] [PMC free article] [PubMed] [Google Scholar]
- 38.Aubin J, Fletcher DF, Xuereb C. Chem Eng Sci. 2005;60:2503–2516. [Google Scholar]
- 39.Lynn NS, Dandy DS. 2007:580–587. doi: 10.1039/b700811b. [DOI] [PMC free article] [PubMed]
- 40.Williams MS, Longmuir J, Yager P. 2008:1121–1129. doi: 10.1039/b802562b. [DOI] [PMC free article] [PubMed] [Google Scholar]
- 41.Mitchell MJ, Wayne E, Rana K, Schaffer CB, King MR. Proc Natl Acad Sci U S A. 2014;111:930–935. doi: 10.1073/pnas.1316312111. [DOI] [PMC free article] [PubMed] [Google Scholar]
- 42.Xue P, Ye K, Gao J, Wu Y, Guo J, Hui KM, Kang Y. Microfluid Nanofluidics. 2013;16:605–612. [Google Scholar]
- 43.Hyun KA, Lee TY, Lee SH, Jung HI. Biosens Bioelectron. 2015;67:86–92. doi: 10.1016/j.bios.2014.07.019. [DOI] [PubMed] [Google Scholar]
- 44.Talasaz AH, Powell AA, Huber DE, Berbee JG, Roh K, Yu W, Xiao W, Davis MM, Pease RF, Mindrinos MN, Jeffrey SS, Davis RW. 2009 doi: 10.1073/pnas.0813188106. [DOI] [PMC free article] [PubMed] [Google Scholar]
- 45.Hosic S, Murthy SK, Koppes AN. 2016 doi: 10.1021/acs.analchem.5b04077. [DOI] [PMC free article] [PubMed] [Google Scholar]
- 46.De Ridder D, Van Der Linden CE, Schonewille T, Dik WA, Reinders MJT, Van Dongen JJM, Staal FJT. 2005:618–627. doi: 10.1038/sj.leu.2403685. [DOI] [PubMed] [Google Scholar]
- 47.Mego M, De Giorgi U, Dawood S, Wang X, Valero V, Andreopoulou E, Handy B, Ueno NT, Reuben JM, Cristofanilli M. 2011;423:417–423. [Google Scholar]
- 48.Wicha MS, Hayes DF, Cancer C, Arbor A. 2011 [Google Scholar]
- 49.Chen Y, Cheng B, He Z, Wang S, Wang Z, Sun M, Fang Y, Chen F, Xiong B. 2016:7. [Google Scholar]
- 50.Xu Y, Phillips JA, Yan J, Li Q, Fan ZH, Tan W, Box PO. 2009;81:7436–7442. doi: 10.1021/ac9012072. [DOI] [PMC free article] [PubMed] [Google Scholar]
- 51.Sheng W, Chen T, Kamath R, Xiong X, Tan W, Fan ZH. 2012 doi: 10.1021/ac3005633. [DOI] [PMC free article] [PubMed] [Google Scholar]
- 52.Hou S, Zhao H, Zhao L, Shen Q, Wei KS, Suh DY, Nakao A, Garcia MA, Song M, Lee T, Xiong B, Luo S. 2013:1547–1551. doi: 10.1002/adma.201203185. [DOI] [PMC free article] [PubMed] [Google Scholar]
- 53.Wang L, Asghar W, Demirci U, Wan Y. Nano Today. 2013;8:347–387. doi: 10.1016/j.nantod.2013.07.001. [DOI] [PMC free article] [PubMed] [Google Scholar]
- 54.Chen W, Weng S, Zhang F, Allen S, Li X, Bao L, Lam RHW, Macoska JA, Merajver SD, Fu J. ACS Nano. 2013;7:566–75. doi: 10.1021/nn304719q. [DOI] [PMC free article] [PubMed] [Google Scholar]
Associated Data
This section collects any data citations, data availability statements, or supplementary materials included in this article.