

Abstract
According to the amyloid hypothesis, the accumulation of oligomerized Aβ is a primary event in the pathogenesis of Alzheimer’s disease (AD). The trigger of the amyloid cascade and of Aβ oligomerization in sporadic AD, the most prevalent form of the disease, remains elusive. Here we examined the hypothesis that apolipoprotein E4 (apoE4), the most prevalent genetic risk factor for AD, triggers the accumulation of intraneuronal oligomerized Aβ following activation of the amyloid cascade. We investigated the intracellular organelles that are targeted by these processes and govern their pathological consequences. This revealed that activation of the amyloid cascade in vivo by inhibition of the Aβ degrading enzyme neprilysin specifically results in accumulation of Aβ and oligomerized Aβ and of apoE4 in CA1 neurons of apoE4 mice. This was accompanied by lysosomal and mitochondrial pathology and the co-localization of Aβ, oligomerized Aβ and apoE4 with enlarged lysosomes and of Aβ and oligomerized Aβ with mitochondria. The time course of the lysosomal effects paralleled that of the loss of CA1 neurons, whereas the mitochondrial effects reached a plateau earlier. These findings suggest that apoE4 potentiates the pathological effects of Aβ and the amyloid cascade by triggering the oligomerization of Aβ, which in turn, impairs intraneuronal mitochondria and lysosomes and drives neurodegeneration.
Keywords: apolipoprotein E4, beta amyloid, neurodegeneration, CA1 neurons, lysosomes, mitochondria
INTRODUCTION
According to the amyloid hypothesis, the accumulation of Ab is the primary event in the pathogenesis of Alzheimer’s disease (AD) [1]. Recent findings suggest that Aβ undergoes a cascade of aggregation states of soluble and insoluble neurotoxic oligomers that mediate its pathological effects [2–4] and that accumulate intraneuronally [4–7]. This occurs at an early stage of the amyloid cascade and is associated with co-localization of intracellular Aβ with lysosomes, multi-vesicular bodies [8–10], and mitochondria [11, 12]. The trigger of the amyloid cascade in sporadic AD, the most prevalent form of the disease, remains elusive. Apolipoprotein E4 (apoE4), the most prevalent genetic risk factor for AD [13–15], is associated in AD with increased amyloid deposition [16]. Corresponding model studies revealed synergistic pathological interactions between Aβ and apoE4 [17–22], which are associated with cognitive deficits [23, 24]. This led to the suggestion that apoE4 potentiates the neurotoxic effects of Aβ and the amyloid cascade and drives them above a pathological threshold. The extent to which this cross talk is mediated via apoE4-driven oligomerization of Aβ is presently not known.
We have recently shown that activating the amyloid cascade in vivo by inhibiting the Aβ-degrading enzyme neprilysin [17] specifically stimulates the degeneration of hippocampal CA1 and of entorhinal and septal neurons in apoE4-targeted replacement mice. This is accompanied by the accumulation of intracellular Aβ and apoE4, as well as by lysosomal activation and cognitive deficits [23, 25]. The neprilysin inhibition paradigm also affects apoE3 mice, but this effect is markedly less pronounced and is delayed relative to that obtained in the apoE4 mice [23]. We presently employed this model to examine the possibility that the pathological synergistic interactions between Aβ and apoE4 drive the oligomerization of Aβ in vivo. In addition, we determined the sub-cellular localizations of Aβ, oligomerized Aβ, and apoE following activation of the amyloid cascade and their spatiotemporal correlation with the resulting neuronal pathology.
MATERIALS AND METHODS
Transgenic mice and implantation of Alzet Mini-osmotic pumps
APOE-targeted replacement mice (apoE mice), created by gene targeting [26], were purchased from Taconic. The mice were back-crossed to C57BL/6J mice for eight generations and were homozygous for either the APOE3 (3/3) or the APOE4 (4/4) allele. The experiments were performed utilizing 3- to 4-month-old male apoE3 and apoE4 mice whose genotypes were confirmed by PCR analysis [23]. All experiments were approved by the Tel Aviv University Animal Care Committee and every effort was made to minimize animal usage and reduce animal stress. Alzet® mini-osmotic pumps (model 2004, which delivers their contents at 0.25 μl/h for up to 30 days) were loaded with the neprilysin inhibitor thiorphan (0.5 mM; Sigma) in artificial cerebrospinal fluid containing 1 mM ascorbic acid or with a similar solution without thiorphan (“sham”). The alzet pumps were implanted with a brain infusion canunla inserted into the lateral ventricle as previously described [23]
Immunofluorescence and confocal microscopy
Free-floating frozen coronal sections (30 μm) were immunostained, as previously described [23], with the following primary antibodies (Abs): biotinylated anti-Aβ mAb (monoclonal Ab) 4G8 (1:200; Signet, Dedham, MA); rabbit anti-cleaved caspase-3 (1:200; Asp175, Cell Signaling Technology, Danvers, MA); rabbit anti-Aβ42 (1:500, Chemicon, Temecula, CA); mouse anti-Aβ42, G2–11 (1:1000, Genetic Co., Schlieren, Switzerland); Ab I-11 (1:2000, provided by Dr. Rakez Kayed); rabbit anti-cathepsin D (1:500, Calbiochem, La Jolla, CA), and goat anti-cathepsin D (1:500, Santa Cruz Biotechnology, Santa Cruz, CA); goat anti-apoE (1:5000, Calbiochem, La Jolla, CA), and goat anti-COX-1 (1:400, Santa Cruz Biotechnology, Santa Cruz, CA). For Aβ staining, sections were first incubated in 70% formic acid for 7 min, and then washed with 10 mM phosphate-buffered saline (PBS), pH = 7.4. The bound primary antibodies were then visualized by incubating the sections with the appropriate fluorescently labeled second antibody, or with fluorescently labeled streptavidin as previously described [23]. The sections (between bregma −2.0 and −3.0) were visualized using a confocal scanning laser microscope (Zeiss, LSM 510). Images (1024 × 1024 pixels) were obtained by averaging eight scans per slice. All the images for each immunostaining were obtained utilizing identical conditions and their quantitative analyses were performed with no further handling. Moderate adjustments for contrast and brightness were performed on the images during the preparation of the figures but were the same for the images of the different apoE4 and apoE3 mice groups.
Image analysis
Utilizing the Image-Pro Plus system (version 5.1, Media Cybernetics), we calculated the intensities of immunohistochemical staining as the percentage of the area stained, as previously described [23]. Two sections were analyzed per brain and each staining was performed at least twice. The replicate experiments, one of which was quantified, yielded similar results. For the double- and triple-labeling co-localization experiment, each image was analyzed separately, first in terms of the percentage of the area stained and then of the percentage of the area that co-localizes with the other parameter. Control experiments revealed no co-localization in stained sections lacking the first antibody of each of the antigens. Measurements of the contribution of stochastic processes to the co-localization data were performed by shifting the channels of one of the images laterally by 1 μm2. This revealed that the contribution of stochastic processes in all the experiments was negligible except for the COX-1 (mitochondria), where it accounted for about 25% of the signal and accordingly was subtracted from the corresponding co-localization results.
Immunoblot analysis
Hippocampi were homogenized (20% w/v) in PBS, pH 7.4, with protease inhibitor cocktail (Roche, # 1 836 153) and centrifuged at 10,000 rpm for 5 min, after which the supernatant (PBS extract) was collected. The resulting pellet was extracted by re-suspension in an equal volume of 10 mM Tris pH 7.6 containing 150 mM NaCl, 2 mM EDTA, protease inhibitor cocktail (Roche), and 1% NP-40, after which it was centrifuged for 5 min at 10,000 rpm. The resulting supernatant (NP-40 extract) was collected. The pellet was further extracted with 70% formic acid. Protein contents of the samples were determined by the BCA Protein Assay Kit (Pierce Biotechnology, #23225). For SDS gel electrophoresis, 30 μg and 4 μg protein of the PBS and NP-40 extracts were used, respectively, and the gels were blotted and immunoreacted with mAb 266 (1:1000 Elan pharmaceuticals). Dot-blot experiments utilizing 0.125 μg of the PBS extract and 30 μg of the NP-40 extract per dot and I-11 or OC (1:1000, provided by Dr. Rakez Kayed) were performed as previously described [27]. Intensities of the immunoblot bands and the dot blots were quantified by using EZQuant-Gel software (EZQuant, Tel-Aviv, Israel).
Electron microscopy and immunogold labeling
90-nm sections (ultramicrotome, Leica) prepared from brain vibratome sections and treated with osmium tetraoxide were collected into copper grids and analyzed with a Zeiss OM 10 electron microscope as previously described [28]. Aβ immunogold EM was performed as previously described [28]. Accordingly, the sections were treated with Antigen retrieval solution (sodium periodate saturated in water) followed by blocking with 3% bovine serum albumin, incubation with the primary anti-Ab mAb 4G8 (Sigma, Saint Louis, MO) and subsequently with the secondary antibody, IgG-anti-rabbit/10-nm gold particles (AURION ImmunoGold Reagents). The grids were then analyzed using a Zeiss OM 10 electron microscope. Both for the EM and the immunogold labeling, an average of 100 micrographs from pyramidal neurons were randomly acquired from three grids at a magnification of 25,000 each, and analyzed with the Image Quant program to estimate the average numbers of gold particles in lysosomes, mitochondria, synapses, and nuclei.
Statistical analysis
Statistical analysis was performed using SPSS version 14. The two groups (apoE3 and apoE4) and two treatments (thiorphan and sham) were compared by two-way ANOVA. Kinetic studies were subjected to ANOVA in terms of two groups (apoE3 and apoE4) and subjected to four time treatments (0, 4, 7, and 10 days). When appropriate, the results were further subjected to post-hoc analysis by Student’s t-test utilizing Bonferroni correction for multiple comparisons.
RESULTS
ApoE4 triggers the accumulation of intraneuronal oligomerized Aβ following activation of the amyloid cascade
The extent to which the isoform-specific accumulation of apoE4 and Aβ in CA1 neurons following activation of the amyloid cascade [23, 25] is associated with oligomerization of the accumulated Aβ was first examined immunohistochemically utilizing mAb I-11, which is directed against distinct epitopes of the oligomeric amyloid backbone [27]. Importantly, this revealed that I-11 immunoreactivity, like that of Aβ, was significantly higher in the CA1 neurons of the thiorphan-treated apoE4 mice than in either the corresponding apoE3 mice or the sham-treated apoE3 and apoE4 mice (Fig. 1A, respectively P < 0.005). Previous experiments revealed that I-11 also recognizes amyloid-like structures derived from non-Aβ peptides [29]. Accordingly, the levels of bound I-11 immunoreactivity that correspond to oligomerized Aβ42 were determined by double-labeling confocal experiments utilizing I-11 and anti-Aβ42. This revealed significant co-localization of these stains (Fig. 1B) and showed that the merged image, which we will term here “oligo-Aβ42” is localized predominantly in the perikarya of the CA1 neurons. By day 7, ~15% of the I-11-positive and ~15% of the Aβ42-positive staining were co-localized in the thiorphan-treated apoE4 mice. The I-11 immunostaining that did not co-localize with Aβ42 represents amyloid-like epitopes of other proteins. Kinetic studies revealed that the accumulation of Aβ and oligo-Aβ in CA1 neurons had a similar time course that paralleled the activation of Caspase-3 and preceded the loss of CA1 neurons (see Supplementary Fig. S1).
Figure 1.
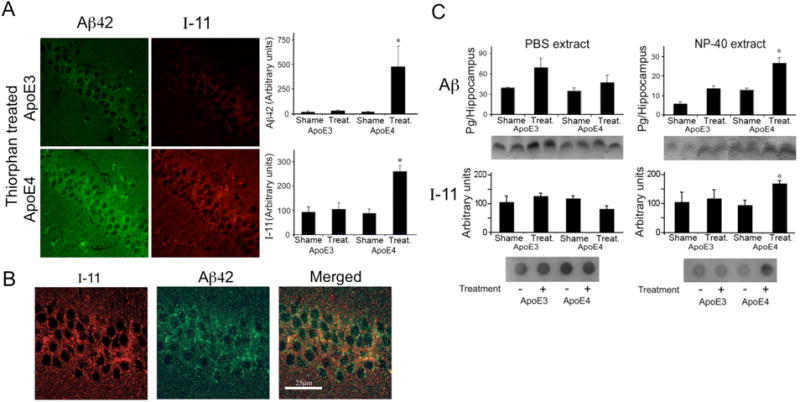
Effects of apoE4 on the levels of Aβ and oligomerized Aβ in CA1 hippocampal neurons following inhibition of neprilysin. ApoE3 and apoE4 male mice were injected i.c.v. with the neprilysin inhibitor thiorphan or sham-treated for 7 days. The mice were then killed and their brains subjected to anti-Aβ and anti-I-11 immunohistochemistry and to Aβ immunoblotting and I-11 dot-blot experiments, as described in Materials and Methods. (A) Representative coronal sections of thiorphan-treated apoE3 and apoE4 mice immunostained with anti-Aβ42 and I-11 are shown on the left (bar = 50 μm). Quantification of the density of Aβ42 and I-11 staining (mean ± SEM; n = 4–5 mice/group) in the CA1 neurons of the thiorphan- and sham-treated apoE3 and apoE4 mice is shown on the right. *P < 0.03 for the effect of group × treatment by two-way ANOVA, and P < 0.005 for a comparison of the results of the thiorphan-treated apoE4 with those of the other mouse groups. (B) Representative confocal images of Aβ42 and I-11 of the CA1 area of apoE4 mice treated 7 days with thiorphan, and of their merged image (bar = 25 μm). (C) Immunoblots and dot blots of Aβ, and I-11 of hippocampal CA1 extracts (n=4–5 mice/group). Upper panels depict immunoblots of PBS (left) and NP40 (right) extracts of the indicated mouse groups and their quantification, whereas the corresponding dot blots are shown in the lower panels. For the PBS extract immunoblot results, P < 0.05 for the effect of treatment by two-way ANOVA. For the NP-40 extract results, immunoblot, and dot blot results, *P < 0.001 for the effect of group × treatment, and P < 0.02 for a comparison of the results of the thiorphan-treated apoE4 with those of the other mouse groups.
Complementary biochemical experiments revealed that the soluble PBS extracts of the CA1 subfield of thiorphan-treated apoE3 and apoE4 mice had elevated levels of Aβ (P < 0.04 for treatment), and no effect of either group or group × treatment which were slightly but not significantly higher in the thiorphan-treated apoE3 mice (Fig. 1C upper left panel). Aβ levels in the NP-40 extractable fraction of CA1 homogenates were also increased by thiorphan (P < 0.001 for treatment and P < 0.01 for group × treatment) and were higher in the thiorphan-treated apoE4 than in the treated apoE3 mice (P < 0.02 for post hoc comparison of the thiorphan-treated apoE4 and apoE3 mice; Figure 1C upper right panel). Importantly, the total PBS-soluble and NP-40-extractable Aβ levels of the CA1 homogenates in the apoE3 and apoE4 mice were similar in the sham-treated mice (45 ± 4 pg Aβ/hippocampus and 47 ± 3 pg Aβ/hippocampus, respectively) and were similarly elevated in the thiorphan-treated mice (95 ± 10 pg Aβ and 79 ± 10 pg Aβ/hippocampus, respectively). The hippocampal extracts taken from the apoE3 and apoE4 mice did not contain additional formic acid extractable insoluble Aβ. Dot-blot experiments utilizing mAb I-11 which specifically recognizes oligomerized Aβ (see supplementary Fig. 2S) revealed, in accordance with the morphological results, higher levels of I-11-stained material in the NP-40 extract from the thiorphan-treated apoE4 than in all other mouse groups (Fig. 1C, lower panels).
Immunostaining and dot-blot experiments with OC antibodies, which are directed against a different oligomeric form of Aβ [27, 29], revealed no effect of either apoE genotype or thiorphan (see supplementary Fig. S3).
Identifying the intracellular compartments that accumulate Aβ, oligomerized Aβ, and apoE4 and that are affected by them
Ultrastructural analysis
Electron microscopy (EM) was employed for unbiased screening of the intracellular pathology induced by apoE4 in CA1 neurons following activation of the amyloid cascade. This disclosed marked enlargement and deformation of lysosomes, mitochondria, and synaptic vesicles, which were specific to the thiorphan-treated apoE4 mice (Fig. 2A). In contrast, the Golgi apparatus and endoplasmatic reticulum of the CA1 neurons in the apoE4 mice exhibited minimal dilations (see supplementary Fig. S4A). EM immunogold labeling showed that Aβ in the CA1 neurons of the apoE4 mice was co-localized with lysosomes, mitochondria, and synaptic vesicles (Fig. 2B). Aβ was also present in the cytoplasm of thiorphan-treated apoE4 mice in the form of amorphous and fibrillar deposits (Fig. 2C) and in secondary lysosomal/autophagic structures (see supplementary Fig. S4B). Control experiments where brain sections were incubated with the gold-secondary antibody in the absence of primary antibody, or where the anti-Aβ antibody was adsorbed with excess Aβ, revealed that no gold particles were associated with organelles in samples from either the apoE4 or apoE3 thiorphan-treated mice. Moreover, only background levels of gold particles associated with organelles were observed in wild-type mice incubated with the anti-Aβ antibody (not shown).
Figure 2.
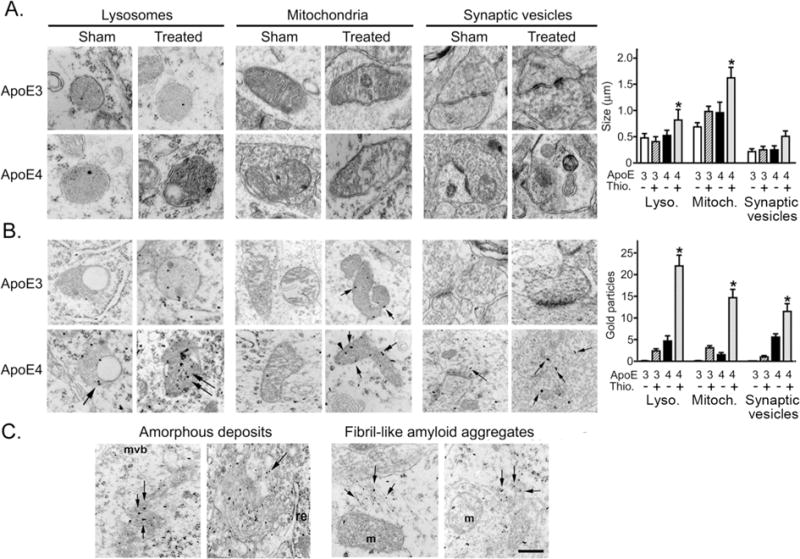
Ultrastructural analysis of the pathology and co-localization of Aβ in distinct sub-cellular organelles in CA1 neurons of apoE4 mice following inhibition of neprilysin. ApoE3 and apoE4 male mice were injected i.c.v. with thiorphan or sham-treated for 7 days. The mice were then killed and their brains subjected to EM and Aβ EM immunogold analysis, as described in Materials and Methods. (A) Representative EM images of thiorphan-treated and sham-treated apoE3 and apoE4 mice depicting primary lysosomes, mitochondria, and synaptic vesicles. Quantification of the sizes of the organelles in the indicated sub-cellular compartments (mean ± SEM; n = 3 mice/group) are shown on the right (*P < 0.04 for the effect of group × treatment, and for a comparison of the results of the thiorphan-treated apoE4 to those of the other mouse groups) (B) Representative EM Aβ immunogold images of the corresponding organelles in CA1 neurons are shown on the left. The numbers of Aβ immunogold particles that co-localized with the indicated organelles (mean ± SEM; n = 3 mice/group) were quantified, and are presented on the right (*P < 0.03 for the effect of group × treatment, and P < 0.01 for a comparison of the results of the thiorphan-treated apoE4 to those of the other mouse groups). (C) EM Aβ immunogold images depicting amorphous and fibril-like deposits of Aβ in CA1 neurons of thiorphan-treated apoE4 mice.
These results suggest that lysosomes and mitochondria are prominent intracellular targets of the accumulated Aβ in CA1 neurons of the apoE4 mice following activation of the amyloid cascade. Next, the spatiotemporal relationships regarding the accumulation of Aβ42, oligomerized Aβ, and apoE4 in these organelles were studied by confocal microscopy of I-11, Aβ42, apoE, and the lysosomal and mitochondrial markers Cathepsin D (CatD) and cytochrom oxidase (COX-1).
Lysosomal pathology
In accordance with the EM results, thiorphan specifically elevated the levels of punctuate CatD-positive lysosomes and increased their sizes in the CA1 neurons of apoE4 mice (Fig. 3A, 3B). Quantification of the effects of apoE4 on the levels of small (0.2–0.5 μm2) and large (0.5–2 μm2) lysosomes at different time points after initiation of the thiorphan treatment revealed elevated levels of both small and large lysosomes of the apoE4 CA1 neurons, which were detectable by day 4 and reached a plateau by day 7 (Fig. 3C; P < 0.004 for the treated apoE4 compared to the other mouse groups). Measurements of the extent to which Aβ42 co-localizes with the lysosomes revealed that it co-localized preferentially with the large lysosomes of the treated apoE4 mice (Fig. 4A, P < 0.001 for treated apoE4 compared to the other mouse groups), and hardly at all with the small lysosomes. About 6% of the intracellular Aβ42 co-localized with the large lysosomes on day 4 and 15% on days 7 and 10. Oligomerization of the lysosomal Aβ42 was measured by the co-localization of oligo-Aβ42 and CatD, where oligo-Aβ42 is the masked image of I-11 and Aβ42 which contains only pixels stained positively for both I-11 and Aβ42. Oligo-Aβ42 co-localized with large lysosomes of the CA1 neurons in the treated apoE4 mice (Fig. 4B; P < 0.03 for the treated apoE4 compared to the other mouse groups), but not with the small lysosomes. The fraction of oligo-Aβ42 that co-localized with large lysosomes increased from 10% on day 4 to about 25% at the plateau.
Figure 3.
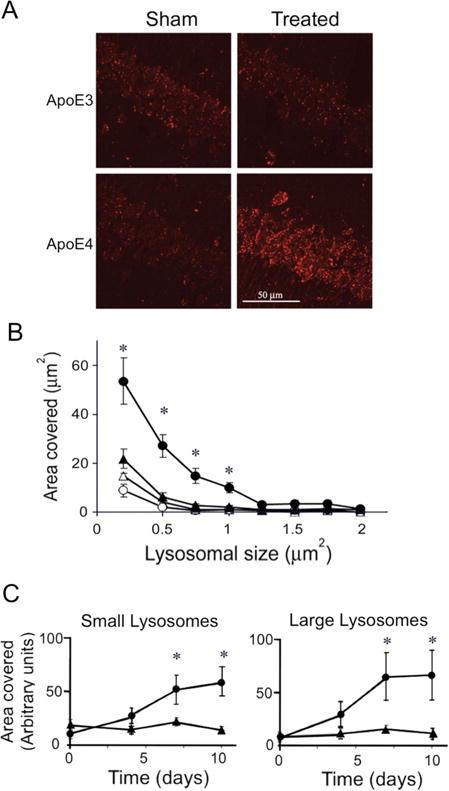
Effects of apoE4 on lysosomal activation in CA1 hippocampal neurons following inhibition of neprilysin. ApoE3 and apoE4 male mice were injected i.c.v. with the neprilysin inhibitor thiorphan or sham-treated for the indicated times. Their brains were then processed and stained for the lysosomal marker CatD, as described in Materials and Methods. (A) Representative coronal sections of thiorphan-treated and sham-treated apoE4 and apoE3 mice immunostained with CatD (bar = 50 μm). (B) Analysis of size distribution of the lysosomes of the four mouse groups. (●), (○) correspond to the apoE4 mice and (▲), (Δ) to the apoE3 mice; filled and empty symbols correspond, respectively, to thiorphan-treated and sham-treated mice. Results shown are means ± SEM; n = 4–5 mice/group. *P < 0.02 for the effect of group × treatment and P < 0.005 for a comparison of the results for thiorphan-treated apoE4 mice with those for the other mouse groups. (C) Time course of lysosomal activation of the thiorphan-treated apoE4 (●) and apoE3 (▲) mice. Panels on the left and right correspond, respectively, to the amounts of small (0.2–0.5 μm2) and large (0.5–2 μm2) lysosomes *P < 0.04 for the effect of group × treatment and P < 0.004 for a comparison of the results for thiorphan-treated apoE4 mice with those of the other mouse groups.
Figure 4.

Co-localization of Aβ and oligomerized Aβ and apoE with lysosomes in CA1 neurons of apoE4 mice following inhibition of neprilysin. ApoE3 and apoE4 male mice were processed for confocal immunohistochemistry at the indicated times following i.c.v. injection of thiorphan, as described in Materials and Methods. (A) Representative confocal images of Aβ, CatD, and their merged image in CA1 neurons of apoE4 mice injected i.c.v. with the neprilysin inhibitor thiorphan for 7 days (bar = 25 μm) and quantitative analysis of the accumulated Aβ that co-localized with small and large lysosomes and of non-lysosomal Aβ (“free Aβ”). (B) Representative confocal images of oligo-Aβ42 (a masked merged image of Aβ42 and I-11), CatD, and their merged image (bar = 25 μm) and quantitative analysis of the accumulated oligo-Aβ42 that co-localized with small and large lysosomes and of non-lysosomal oligo-Aβ42 (“free oligo-Aβ42”). (C) Corresponding results of the accumulation of apoE and its co-localization with small and large lysosomes and of non-lysosomal apoE (free apoE). Results (mean ± SEM; n = 4–5 mice/group) were quantified as described in Materials and Methods. In (A), (B) and (C), (●), (▲) correspond, respectively, to thiorphan-treated apoE4 and apoE3 mice. *P < 0.03, #P < 0.001 for group × treatment, whereas *P < 0.03, # P < 0.004 for post hoc comparisons of the results of the free and large lysosomal Aβ42 and oligo-Aβ42 pools of the thiorphan- treated apoE4 mice to the corresponding values of the other mouse groups. (D) Representative confocal images of Aβ, oligo-Aβ42, CatD, and apoE (bar = 25 μm). The arrowhead denotes co-localized Aβ, apoE, and Cat-D, and arrows indicate the co-localized oligo-Aβ42, apoE, and CatD. The panel on the right depicts the levels of apoE-Aβ and apoE-oligo-Aβ42 species that co-localize with the large lysosomes in the CA1 neurons of thiorphan-treated apoE4 (black bars) and apoE3 mice (white bars). *P < 0.002 for a comparison of the results of the treated apoE4 and apoE3 mice.
Activation of the amyloid cascade is also accompanied by the accumulation of apoE4 in the CA1 neurons [25]. We next examined whether apoE4, like Aβ and oligo-Aβ42, also co-localizes with the large lysosomes. As shown in Figure 4C, apoE accumulated specifically in the CA1 neurons of the thiorphan-treated apoE4 mice (P < 0.03 for treated apoE4 compared to other mouse groups), and the accumulated apoE4 co-localized preferentially with the large lysosomes (P < 0.03 for treated apoE4 compared to the other mouse groups) but not with the small ones. About 6% of the accumulated intracellular apoE4 co-localized with the large lysosomes. As shown in Figure 4D, quadruple labeling (Aβ42, I-11, CatD, and apoE4) revealed co-localization of lysosomal apoE with Aβ42 (yellow arrowheads) and with oligo-Aβ42 (yellow arrows). Furthermore, co-localization of these aggregates with large lysosomes was specifically elevated in the thiorphan-treated apoE4 mice (P < 0.02 for the treated apoE4 compared to other mouse groups) (Fig. 4D).
Mitochondrial pathology
To monitor the accumulation of Aβ42 and oligo-Aβ42 in mitochondria, we employed confocal microscopy, utilizing the mitochondrial marker COX-1. Levels of COX-1 staining were elevated isoform-specifically in the thiorphan-treated apoE4 mice (Fig. 5A). This effect was faster but less pronounced than that observed with the lysosomes (compare Figs. 3 and 5A). It did not reach significance when the results obtained at each of the different time points were analyzed separately but was significant when the overall effects of the thiorphan treatment on the apoE4 mice at days 4,7,and 10 was compared to the corresponding results which were obtained with the apoE3 mice (P < 0.01 by 1 way ANOVA). Both Aβ42 and oligo-Aβ42 co-localized specifically with COX-1 in the CA1 neurons of the thiorphan-treated apoE4 mice, and their levels reached a plateau by 4 days following the thiorphan treatment (Fig. 5B, 5C). Similarly to the COX-1 results, these effects were significant when the overall results of the thiorphan treated apoE4 mice at days 4,7,and 10 were compared to those of the corresponding apoE3 mice (P < 0.005 and P <0.02 for respectively Aβ42 and oligo Aβ42 which co-localized with COX-1). About 8% of the accumulated Aβ42 and 23% of the oligo-Aβ42 in the thiorphan-treated apoE4 mice co-localized with the mitochondria. Importantly, thiorphan treatment did not induce the co-localization of apoE4 with the mitochondria in any of the mouse groups (Fig. 5D).
Figure 5.
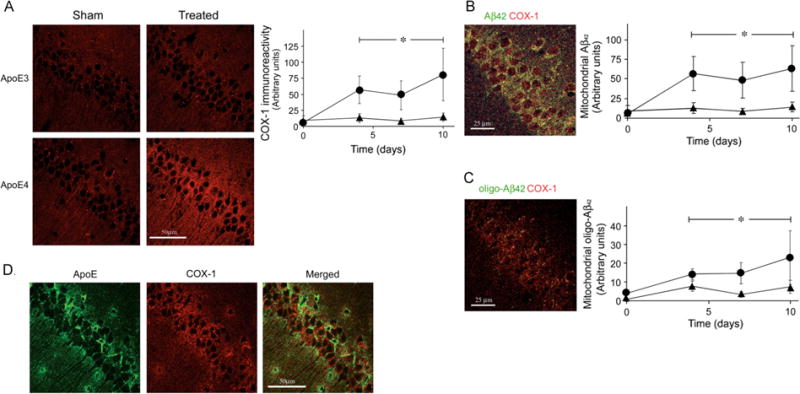
Effects of apoE4 and inhibition of neprilysin on the mitochondria of CA1 neurons and on their interaction with Aβ and oligo-Aβ. ApoE3 and apoE4 male mice were processed for confocal immunohistochemistry at the indicated times following i.c.v. injection of thiorphan, as described in Materials and Methods. (A) Left, representative coronal sections of the indicated mouse groups immunostained with COX-1 (bar = 50 μm). Right, quantification (mean ± SEM; n = 4–5 mice/group) of the levels of COX-1 immunostaining in CA1 neurons of the thiorphan-treated apoE3 (▲) and apoE4 mice (●) at the indicated time points. (B) Left, representative merged confocal images of thiorphan-treated apoE4 mice double-labeled for Aβ42 and COX-1 (bar = 25 μm). Right, quantification of the kinetics of accumulation of mitochondrial Aβ42 in the thiorphan-treated apoE4 (●) and apoE3 (▲) mice. (C) Co-localization of oligo-Aβ42 and and COX-1. Left, a representative merged confocal image of oligo-Aβ42 and COX-1 in CA1 neurons of thiorphan-treated apoE4 mice (bar = 25 μm). Right, quantification of the kinetics of accumulation of mitochondrial oligo-Aβ42 in the thiorphan-treated apoE4 (●) and apoE3 (▲) mice. * Corresponds to comparisons of the results of the thiorphan-treated apoE4 mice at days 4, 7 and 10 to the corresponding results of the apoE3 mice. P < 0.01 for the COX-1 results (Fig. 5A) and P < 0.005 and P < 0.02 for the Aβ42 and oligo-Aβ42 co-localization results (Fig. 5B,C). (D) Representative confocal images of apoE, COX-1, and their merged image in the CA1 area of thiorphan-treated apoE4 mice (bar = 50 μm). As shown apoE4, unlike Aβ42 and oligo–Aβ 42, did not co-localize with the mitochondria
The extents to which the different Aβ42 and apoE complexes were associated with the large lysosomes and the mitochondria were compared in terms of the percentages of these organelles in CA1 neurons of the thiorphan-treated apoE4 mice, which were occupied by the different Aβ and apoE species. This comparison revealed that by day 4 about 4% of the mitochondria and no lysosomes were occupied by Aβ, and that at this time point these organelles did not contain either oligo-Aβ42 or apoE4. In contrast, at later time points (e.g. at day 7), occupancy of the large lysosomes by Aβ and apoE was greater than that of the mitochondria (P < 0.005 and P < 0.01, respectively), and both organelles contained similar amounts of oligo-Aβ42 (Fig. 6).
Figure 6.

Comparison of the co-localization of the different Aβ and apoE aggregates with large lysosomes and mitochondria in apoE4 mice following inhibition of neprilysin. Results shown (mean ± SEM; 4–5 mice/group) were taken from Figures 4–5. Accordingly, black bars correspond to areas of the large lysosomes that co-localized with the indicated Aβ and apoE species in each image of the treated apoE4 mice from which the average of the corresponding area of the treated apoE3 mice was subtracted. The resulting apoE4-specific staining was then divided by the total area of the large lysosomes of the same image of the treated apoE4 mice. Gray bars depict the corresponding mitochondrial co-localization results. *P < 0.005 and P<0.01 for comparison of lysosomal and mitochondrial Aβ42 results of the apoE4 mice and P < 0.03 for the corresponding comparisons of the apoE4-containing species.
Taken together, the above findings suggest that apoE4 drives the accumulation of Aβ42 and oligomerized Aβ42 in the mitochondria and lysosomes of CA1 neurons. This consequently triggers mitochondrial and lysosomal pathology, which induce neuronal cell death.
DISCUSSION
Activation of the amyloid cascade via inhibition of the Aβ-degrading enzyme neprilysin resulted in the isoform-specific accumulation of Aβ, oligomerized Aβ, and apoE in the CA1 neurons of apoE4 mice. This was accompanied by lysosomal and mitochondrial pathology and by the co-localization of Aβ42, oligomerized Aβ42, with enlarged lysosomes or with the mitochondria. Neprilysin inhibition also induced the accumulation of apoE4 in CA1 neurons of the apoE4 which, however, co-localized with the enlarged lysosomes but not with the mitochondria. The time course of the lysosomal effects paralleled that of the loss of the CA1 neurons; however, the mitochondrial effect reached a plateau earlier. These findings are in accordance with the reported co-localization of Aβ in activated lysosomes and in mitochondria in AD and in amyloid precursor protein (APP) transgenic mice [8, 30–34] and with findings that these effects are specifically exacerbated by apoE4 [35, 36]. Importantly, the extracellular deposition of Aβ, which also occurs in the neprilysin inhibition model, evolves much later [17] and is not specific to the hippocampus.
The mechanisms underlying the apoE4-driven accumulation of Aβ and oligomerized Aβ42 in the lysosomes and mitochondria of the CA1 neurons are not fully understood. Lysosomes are endpoints of the two major processing and degradation pathways, autophagy and endocytosis, and it was reported that Aβ can accumulate in lysosomes via both of these pathways [37, 38]. Studies in vitro have shown that Aβ induces lysosomal leakage and cellular toxicity via distinct apoE receptor-mediated mechanisms [36, 39–41]. Preliminary findings revealed that the level of the apoE receptor, LRP1, is up regulated in CA1 neurons of the apoE4 mice following inhibition of neprilysin and down regulated in the corresponding CA1 neurons of the apoE3 mice (not shown). Thus, it is possible that Aβ accumulates in the apoE4 CA1 lysosomes via the LRP-mediated endocytotic pathway. Lysosomal accumulation of Aβ might be mediated by endocytosis of extracellular Aβ or via intra-lysosomal degradation of APP [42]. Since neprilysin is localized in the plasma membrane and can degrade extracellular peptides [43], it is likely that at least some of the accumulated lysosomal Aβ is extracellular. EM findings suggest that the endoplasmic reticulum in the CA1 neurons of thiorphan-treated apoE4 mice possesses Aβ immunoreactivity (not shown), suggesting that the free intra-neuronal and the mitochondrial Aβ pools are synthesized intra-neuronally [44, 45]. However, since extracellularly applied Aβ accumulates in the mitochondria of neuronal cultures [46], the free and mitochondrial Aβ could accumulate via this route.
Previous studies revealed that apoE4 is endocytosed preferentially by neurons [47, 48], suggesting that accumulation of apoE4 in the CA1 neurons is also mediated via endocytosis. However, since the extent of co-localization of apoE4 and Aβ in the CA1 neurons is small [25], most of these molecules are probably sorted differentially. ApoE can also be synthesized by neurons [49], and it is therefore possible that some of the CA1 neuronal apoE4 is produced in these cells.
Oligomerization of Aβ in AD and in corresponding transgenic models is accelerated by endosomal-lysosomal membranes [50, 51], suggesting that much of the oligomerization of Aβ in the CA1 neurons is produced within the endosomal-lysosomal system. Since, extracellular oligomeric Aβ can bind specifically to distinct surface proteins, such as prion protein [52], it is also possible that some of the intracellular cytosolic and mitochondrial oligomeric Aβ accumulate via this route. Oligomerization of Aβ has been shown to occur via a prefibrillar pathway whose products are recognized by I-11 or via a different fibrillar route whose products are specifically recognized by the OC antibody and which appear to be small fragments of fibrils or fibril protofilamnets [27, 53, 54]. Thus, our finding that the immunoreactivity of I-11, but not that of OC, was elevated following inhibition of neprilysin suggests that the prefibrillar Aβ oligomerization pathway is specifically and selectively activated by apoE4. These Aβ oligomers, which can serve as a template and seed the conversion of Aβ monomers directly into prefibrillar oligomers, are the most toxic class of amyloids and are structurally distinct from amyloid fibrils [27, 53].
The observed lysosomal pathology is probably due to the high resistance of Aβ, and in particular of oligomerized Aβ, to degradation [55], which leads to their clogging and impairment. In vitro studies utilizing isolated mitochondria disclosed that Aβ also induces morphological and functional pathology of mitochondria [56–61]. It is therefore possible that the morphological and histochemical mitochondrial impairments observed in this study were induced by direct interactions of Aβ with the mitochondria. However, the possibility that apoE4 or fragments thereof also play a direct role in the mitochondrial pathology cannot be excluded [62, 63].
Both the lysosomal and the mitochondrial pathologies probably contributed to the observed neuronal pathology and to the subsequent death of the CA1 neurons. The preferential and pronounced accumulation of Aβ and apoE in the lysosomes, as well as our finding that the resulting oligomerization of Aβ and lysosomal activation followed a time course similar to that of the loss of CA1 neurons (Figs. 3–4 and see supplementary Fig. S1), suggests that these events are directly and possibly causally related. The findings that the mitochondrial pathology and the accumulation of Aβ in this organelle preceded the lysosomal pathology (Figs. 4 and 5) suggest that mitochondrial dysfunction might have a priming effect either on the lysosomes [59, 60, 64] or on other cellular targets whose downstream consequences contribute to neuronal loss. This pathological cascade is presented schematically in Supplementary Figure S5. Importantly, the extracellular deposition of Aβ in this model does not seem to be related to the observed neuronal loss as it occurs after the accumulation of oligomerized Aβ in the CA1 neurons and is not specific to this hippocampal subfield [17].
In conclusion, this study shows that the synergistic pathological effects of apoE4 following activation of the amyloid cascade in vivo were induced via the accumulation and oligomerization of Aβ, and their co-localization with lysosomes and mitochondria of CA1 hippocampal neurons. This resulted in mitochondrial pathology and lysosomal activation, and subsequent degradation of the CA1 neurons.
Supplementary Material
Kinetics of the accumulation of Aβ42, oligomerized Aβ (I-11), and cleaved caspase-3 levels, and of neuronal loss in CA1 hippocampal neurons of apoE4 mice following inhibition of neprylisin. ApoE4 mice were processed for confocal immunohistochemistry at the indicated times following i.c.v. injection of thiorphan, as described in Materials and Methods. The sections were subjected to Aβ42, I-11 and cleaved caspase-3 confocal microscopy, as described in Materials and Methods, and to NeuN immunohistochemistry as previously described [23]. Panels on the left depict representative confocal sections of apoE3 and apoE4 mice immunostained for NeuN and cleaved caspase-3. Quantitation of the results (mean ± SEM; n = 4–5 mice/group) are for Aβ42 (■), cleaved caspase-3 (○), I-11 (□), and neuronal loss (▲); they are presented for each parameter as the percentage of the maximal change that was observed within 10 days after neprilysin inhibition was initiated. *P < 0.02 for the Aβ42, I-11, and cleaved caspase-3 and P < 0.05 for NeuN for a comparison of the results of the thiorphan-treated apoE4 with those of the other mouse groups.
Determination of the specificity of I-11 to oligomerized Aβ. Panel A. Dot blots of 0.36 μg soluble Aβ42 (1), oligomerized Aβ42 (2) and fibrillar Aβ42 (3) were probed either with the anti Aβ42 mAb 6E10 (upper row) or with Ab I-11 (lower row). Determination of the specificity of I-11 to oligomerized Aβ by blocking experiments is depicted in Panel B. Each dot has 0.36 μg of Aβ2 oligomer. The I-11 reactivity with the unblocked Aβ42 oligomers is shown in the upper row whereas the blots in the lower row were blocked with Aβ42 oligomers (1), Aβ42 fibril (2) and soluble Aβ42 (3). The dot blots experiments and oligomerized and fibrillar Aβ were prepared as described in [27].
Comparison of I-11 and OC levels of oligomerized amyloid in CA1 hippocampal neurons of apoE4 and apoE3 mice following inhibition of neprilysin. ApoE3 and apoE4 male mice were injected i.c.v. with thiorphan or sham-treated for 7 days. The mice were then killed and their brains subjected to anti-I-11 and OC immunohistochemistry and dot-blot experiments, as described in Materials and Methods. (A) Representative coronal sections of thiorphan-treated and sham-treated apoE3 and apoE4 mice immunostained with I-11 are shown on the left (bar = 100 μm). Quantification of the density of I-11 staining (mean ± SEM; n = 4–5 mice/group) in the CA1 neurons is shown on the right. *P < 0.007 for the effect of group × treatment and P < 0.001 for a comparison of the results of the thiorphan-treated apoE4 with those of the other mouse groups. (B) Representative coronal sections of thiorphan-treated and sham-treated apoE3 and apoE4 mice immunostained with OC are shown on the left (bar = 100 μm). Quantification of the density of OC staining (mean ± SEM; n = 4–5 mice/group) in the CA1 neurons is shown on the right. The lower panel depicts representative OC dot blots of the PBS and NP-40 hippocampal extracts from the mouse groups.
Golgi, rough endoplasmic reticulum (RER), and secondary lysosomal pathology in CA1 hippocampal neurons of apoE4 and apoE3 mice following inhibition of neprilysin. ApoE3 and apoE4 mice were injected i.c.v. with thiorphan or sham-treated for 7 days. The mice were then killed and their brains subjected to EM, as described in Materials and Methods. (A) Representative Golgi apparatus and RER EM images of thiorphan-treated and sham-treated apoE3 and apoE4 mice. (B) Representative EM images (left) and EM Aβ immunogold images (right) of secondary lysosomes/autophagosomes of thiorphan-treated apoE3 and apoE4 mice.
Acknowledgments
This work was supported in part by grants from the Israel Science Foundation (ISF grant # 487/07) and from the Joseph and Inez Eichenbaum Foundation, and by the LIPIDIDIET grant funded by the 7th Framework Program of the European Union. DMM is the incumbent of the Myriam Lebach Chair in Molecular Neurodegeneration. We would like to thank Terence H. Hui (Elan Pharmaceuticals) for the generous gift of Aβ antibody 266.
References
- 1.Hardy J, Selkoe DJ. The amyloid hypothesis of Alzheimer’s disease: progress and problems on the road to therapeutics. Science. 2002;297:353–356. doi: 10.1126/science.1072994. [DOI] [PubMed] [Google Scholar]
- 2.Lesne S, Koh MT, Kotilinek L, Kayed R, Glabe CG, Yang A, Gallagher M, Ashe KH. A specific amyloid-beta protein assembly in the brain impairs memory. Nature. 2006;440:352–357. doi: 10.1038/nature04533. [DOI] [PubMed] [Google Scholar]
- 3.Oddo S, Caccamo A, Shepherd JD, Murphy MP, Golde TE, Kayed R, Metherate R, Mattson MP, Akbari Y, LaFerla FM. Triple-transgenic model of Alzheimer’s disease with plaques and tangles: intracellular Abeta and synaptic dysfunction. Neuron. 2003;39:409–421. doi: 10.1016/s0896-6273(03)00434-3. [DOI] [PubMed] [Google Scholar]
- 4.Gandy S, Simon AJ, Steele JW, Lublin AL, Lah JJ, Walker LC, Levey AI, Krafft GA, Levy E, Checler F, Glabe C, Bilker W, Abel T, Schmeidler J, Ehrlich ME. Days-to-criterion as an indicator of toxicity associated with human Alzheimer amyloid-beta oligomers. Annals of Neurology. 2010;9999:NA. doi: 10.1002/ana.22052. [DOI] [PMC free article] [PubMed] [Google Scholar]
- 5.Chui DH, Tanahashi H, Ozawa K, Ikeda S, Checler F, Ueda O, Suzuki H, Araki W, Inoue H, Shirotani K, Takahashi K, Gallyas F, Tabira T. Transgenic mice with Alzheimer presenilin 1 mutations show accelerated neurodegeneration without amyloid plaque formation. Nat Med. 1999;5:560–564. doi: 10.1038/8438. [DOI] [PubMed] [Google Scholar]
- 6.Gouras GK, Tsai J, Naslund J, Vincent B, Edgar M, Checler F, Greenfield JP, Haroutunian V, Buxbaum JD, Xu H, Greengard P, Relkin NR. Intraneuronal Abeta42 accumulation in human brain. Am J Pathol. 2000;156:15–20. doi: 10.1016/s0002-9440(10)64700-1. [DOI] [PMC free article] [PubMed] [Google Scholar]
- 7.Oddo S, Caccamo A, Smith IF, Green KN, LaFerla FM. A dynamic relationship between intracellular and extracellular pools of Abeta. Am J Pathol. 2006;168:184–194. doi: 10.2353/ajpath.2006.050593. [DOI] [PMC free article] [PubMed] [Google Scholar]
- 8.Langui D, Girardot N, El Hachimi KH, Allinquant B, Blanchard V, Pradier L, Duyckaerts C. Subcellular topography of neuronal Abeta peptide in APPxPS1 transgenic mice. Am J Pathol. 2004;165:1465–1477. doi: 10.1016/s0002-9440(10)63405-0. [DOI] [PMC free article] [PubMed] [Google Scholar]
- 9.Takahashi RH, Milner TA, Li F, Nam EE, Edgar MA, Yamaguchi H, Beal MF, Xu H, Greengard P, Gouras GK. Intraneuronal Alzheimer abeta42 accumulates in multivesicular bodies and is associated with synaptic pathology. Am J Pathol. 2002;161:1869–1879. doi: 10.1016/s0002-9440(10)64463-x. [DOI] [PMC free article] [PubMed] [Google Scholar]
- 10.Yang AJ, Chandswangbhuvana D, Margol L, Glabe CG. Loss of endosomal/lysosomal membrane impermeability is an early event in amyloid Abeta1–42 pathogenesis. J Neurosci Res. 1998;52:691–698. doi: 10.1002/(SICI)1097-4547(19980615)52:6<691::AID-JNR8>3.0.CO;2-3. [DOI] [PubMed] [Google Scholar]
- 11.Caspersen C, Wang N, Yao J, Sosunov A, Chen X, Lustbader JW, Xu HW, Stern D, McKhann G, Yan SD. Mitochondrial Abeta: a potential focal point for neuronal metabolic dysfunction in Alzheimer’s disease. Faseb J. 2005;19:2040–2041. doi: 10.1096/fj.05-3735fje. [DOI] [PubMed] [Google Scholar]
- 12.Manczak M, Anekonda TS, Henson E, Park BS, Quinn J, Reddy PH. Mitochondria are a direct site of A beta accumulation in Alzheimer’s disease neurons: implications for free radical generation and oxidative damage in disease progression. Hum Mol Genet. 2006;15:1437–1449. doi: 10.1093/hmg/ddl066. [DOI] [PubMed] [Google Scholar]
- 13.Corder EH, Saunders AM, Strittmatter WJ, Schmechel DE, Gaskell PC, Small GW, Roses AD, Haines JL, Pericak-Vance MA. Gene dose of apolipoprotein E type 4 allele and the risk of Alzheimer’s disease in late onset families. Science. 1993;261:921–923. doi: 10.1126/science.8346443. [DOI] [PubMed] [Google Scholar]
- 14.Roses AD. Apolipoprotein E alleles as risk factors in Alzheimer’s disease. Annu Rev Med. 1996;47:387–400. doi: 10.1146/annurev.med.47.1.387. [DOI] [PubMed] [Google Scholar]
- 15.Saunders AM, Strittmatter WJ, Schmechel D, George-Hyslop PH, Pericak-Vance MA, Joo SH, Rosi BL, Gusella JF, Crapper-MacLachlan DR, Alberts MJ, et al. Association of apolipoprotein E allele epsilon 4 with late-onset familial and sporadic Alzheimer’s disease. Neurology. 1993;43:1467–1472. doi: 10.1212/wnl.43.8.1467. [DOI] [PubMed] [Google Scholar]
- 16.Schmechel DE, Saunders AM, Strittmatter WJ, Crain BJ, Hulette CM, Joo SH, Pericak-Vance MA, Goldgaber D, Roses AD. Increased amyloid beta-peptide deposition in cerebral cortex as a consequence of apolipoprotein E genotype in late-onset Alzheimer disease. Proc Natl Acad Sci U S A. 1993;90:9649–9653. doi: 10.1073/pnas.90.20.9649. [DOI] [PMC free article] [PubMed] [Google Scholar]
- 17.Dolev I, Michaelson DM. A nontransgenic mouse model shows inducible amyloid-beta (Abeta) peptide deposition and elucidates the role of apolipoprotein E in the amyloid cascade. Proc Natl Acad Sci U S A. 2004;101:13909–13914. doi: 10.1073/pnas.0404458101. [DOI] [PMC free article] [PubMed] [Google Scholar]
- 18.Holtzman DM. In vivo effects of ApoE and clusterin on amyloid-beta metabolism and neuropathology. J Mol Neurosci. 2004;23:247–254. doi: 10.1385/JMN:23:3:247. [DOI] [PubMed] [Google Scholar]
- 19.Jordan J, Galindo MF, Miller RJ, Reardon CA, Getz GS, LaDu MJ. Isoform-specific effect of apolipoprotein E on cell survival and beta-amyloid-induced toxicity in rat hippocampal pyramidal neuronal cultures. J Neurosci. 1998;18:195–204. doi: 10.1523/JNEUROSCI.18-01-00195.1998. [DOI] [PMC free article] [PubMed] [Google Scholar]
- 20.LaDu MJ, Falduto MT, Manelli AM, Reardon CA, Getz GS, Frail DE. Isoform-specific binding of apolipoprotein E to beta-amyloid. J Biol Chem. 1994;269:23403–23406. [PubMed] [Google Scholar]
- 21.Puttfarcken PS, Manelli AM, Falduto MT, Getz GS, LaDu MJ. Effect of apolipoprotein E on neurite outgrowth and beta-amyloid-induced toxicity in developing rat primary hippocampal cultures. J Neurochem. 1997;68:760–769. doi: 10.1046/j.1471-4159.1997.68020760.x. [DOI] [PubMed] [Google Scholar]
- 22.Strittmatter WJ, Weisgraber KH, Huang DY, Dong LM, Salvesen GS, Pericak-Vance M, Schmechel D, Saunders AM, Goldgaber D, Roses AD. Binding of human apolipoprotein E to synthetic amyloid beta peptide: isoform-specific effects and implications for late-onset Alzheimer disease. Proc Natl Acad Sci U S A. 1993;90:8098–8102. doi: 10.1073/pnas.90.17.8098. [DOI] [PMC free article] [PubMed] [Google Scholar]
- 23.Belinson H, Lev D, Masliah E, Michaelson DM. Activation of the amyloid cascade in apolipoprotein E4 transgenic mice induces lysosomal activation and neurodegeneration resulting in marked cognitive deficits. J Neurosci. 2008;28:4690–4701. doi: 10.1523/JNEUROSCI.5633-07.2008. [DOI] [PMC free article] [PubMed] [Google Scholar]
- 24.van Meer P, Acevedo S, Raber J. Impairments in spatial memory retention of GFAP-apoE4 female mice. Behav Brain Res. 2007;176:372–375. doi: 10.1016/j.bbr.2006.10.024. [DOI] [PMC free article] [PubMed] [Google Scholar]
- 25.Belinson H, Michaelson DM. Pathological Synergism Between Amyloid-beta and Apolipoprotein E4 - The Most Prevalent Yet Understudied Genetic Risk Factor for Alzheimer’s Disease. J Alzheimers Dis. 2009 doi: 10.3233/JAD-2009-1065. [DOI] [PubMed] [Google Scholar]
- 26.Sullivan PM, Mezdour H, Aratani Y, Knouff C, Najib J, Reddick RL, Quarfordt SH, Maeda N. Targeted replacement of the mouse apolipoprotein E gene with the common human APOE3 allele enhances diet-induced hypercholesterolemia and atherosclerosis. J Biol Chem. 1997;272:17972–17980. doi: 10.1074/jbc.272.29.17972. [DOI] [PubMed] [Google Scholar]
- 27.Kayed R, Head E, Sarsoza F, Saing T, Cotman CW, Necula M, Margol L, Wu J, Breydo L, Thompson JL, Rasool S, Gurlo T, Butler P, Glabe CG. Fibril specific, conformation dependent antibodies recognize a generic epitope common to amyloid fibrils and fibrillar oligomers that is absent in prefibrillar oligomers. Mol Neurodegener. 2007;2:18. doi: 10.1186/1750-1326-2-18. [DOI] [PMC free article] [PubMed] [Google Scholar]
- 28.Rockenstein E, Hansen LA, Mallory M, Trojanowski JQ, Galasko D, Masliah E. Altered expression of the synuclein family mRNA in Lewy body and Alzheimer’s disease. Brain Res. 2001;914:48–56. doi: 10.1016/s0006-8993(01)02772-x. [DOI] [PubMed] [Google Scholar]
- 29.Kayed R, Head E, Thompson JL, McIntire TM, Milton SC, Cotman CW, Glabe CG. Common structure of soluble amyloid oligomers implies common mechanism of pathogenesis. Science. 2003;300:486–489. doi: 10.1126/science.1079469. [DOI] [PubMed] [Google Scholar]
- 30.Barrachina M, Maes T, Buesa C, Ferrer I. Lysosome-associated membrane protein 1 (LAMP-1) in Alzheimer’s disease. Neuropathol Appl Neurobiol. 2006;32:505–516. doi: 10.1111/j.1365-2990.2006.00756.x. [DOI] [PubMed] [Google Scholar]
- 31.Cataldo AM, Barnett JL, Berman SA, Li J, Quarless S, Bursztajn S, Lippa C, Nixon RA. Gene expression and cellular content of cathepsin D in Alzheimer’s disease brain: evidence for early up-regulation of the endosomal-lysosomal system. Neuron. 1995;14:671–680. doi: 10.1016/0896-6273(95)90324-0. [DOI] [PubMed] [Google Scholar]
- 32.D’Andrea MR, Nagele RG, Wang HY, Peterson PA, Lee DH. Evidence that neurones accumulating amyloid can undergo lysis to form amyloid plaques in Alzheimer’s disease. Histopathology. 2001;38:120–134. doi: 10.1046/j.1365-2559.2001.01082.x. [DOI] [PubMed] [Google Scholar]
- 33.Lopez EM, Bell KF, Ribeiro-da-Silva A, Cuello AC. Early changes in neurons of the hippocampus and neocortex in transgenic rats expressing intracellular human a-beta. J Alzheimers Dis. 2004;6:421–431. doi: 10.3233/jad-2004-6410. discussion 443–429. [DOI] [PubMed] [Google Scholar]
- 34.Shie FS, LeBoeuf RC, Jin LW. Early intraneuronal Abeta deposition in the hippocampus of APP transgenic mice. Neuroreport. 2003;14:123–129. doi: 10.1097/01.wnr.0000051151.87269.7d. [DOI] [PubMed] [Google Scholar]
- 35.Kar S, Poirier J, Guevara J, Dea D, Hawkes C, Robitaille Y, Quirion R. Cellular distribution of insulin-like growth factor-II/mannose-6-phosphate receptor in normal human brain and its alteration in Alzheimer’s disease pathology. Neurobiol Aging. 2006;27:199–210. doi: 10.1016/j.neurobiolaging.2005.03.005. [DOI] [PubMed] [Google Scholar]
- 36.Zerbinatti CV, Wahrle SE, Kim H, Cam JA, Bales K, Paul SM, Holtzman DM, Bu G. Apolipoprotein E and low density lipoprotein receptor-related protein facilitate intraneuronal Abeta42 accumulation in amyloid model mice. J Biol Chem. 2006;281:36180–36186. doi: 10.1074/jbc.M604436200. [DOI] [PubMed] [Google Scholar]
- 37.Jin LW, Shie FS, Maezawa I, Vincent I, Bird T. Intracellular accumulation of amyloidogenic fragments of amyloid-beta precursor protein in neurons with Niemann-Pick type C defects is associated with endosomal abnormalities. Am J Pathol. 2004;164:975–985. doi: 10.1016/s0002-9440(10)63185-9. [DOI] [PMC free article] [PubMed] [Google Scholar]
- 38.Pajak B, Songin M, Strosznajder JB, Orzechowski A, Gajkowska B. Ultrastructural evidence of amyloid beta-induced autophagy in PC12 cells. Folia Neuropathol. 2009;47:252–258. [PubMed] [Google Scholar]
- 39.Ji ZS, Miranda RD, Newhouse YM, Weisgraber KH, Huang Y, Mahley RW. Apolipoprotein E4 potentiates amyloid beta peptide-induced lysosomal leakage and apoptosis in neuronal cells. J Biol Chem. 2002;277:21821–21828. doi: 10.1074/jbc.M112109200. [DOI] [PubMed] [Google Scholar]
- 40.Ji ZS, Mullendorff K, Cheng IH, Miranda RD, Huang Y, Mahley RW. Reactivity of apolipoprotein E4 and amyloid beta peptide: lysosomal stability and neurodegeneration. J Biol Chem. 2006;281:2683–2692. doi: 10.1074/jbc.M506646200. [DOI] [PubMed] [Google Scholar]
- 41.Ye S, Huang Y, Mullendorff K, Dong L, Giedt G, Meng EC, Cohen FE, Kuntz ID, Weisgraber KH, Mahley RW. Apolipoprotein (apo) E4 enhances amyloid beta peptide production in cultured neuronal cells: apoE structure as a potential therapeutic target. Proc Natl Acad Sci U S A. 2005;102:18700–18705. doi: 10.1073/pnas.0508693102. [DOI] [PMC free article] [PubMed] [Google Scholar]
- 42.Busciglio J, Gabuzda DH, Matsudaira P, Yankner BA. Generation of beta-amyloid in the secretory pathway in neuronal and nonneuronal cells. Proc Natl Acad Sci U S A. 1993;90:2092–2096. doi: 10.1073/pnas.90.5.2092. [DOI] [PMC free article] [PubMed] [Google Scholar]
- 43.Hersh LB, Rodgers DW. Neprilysin and amyloid beta peptide degradation. Curr Alzheimer Res. 2008;5:225–231. doi: 10.2174/156720508783954703. [DOI] [PubMed] [Google Scholar]
- 44.Grant SM, Ducatenzeiler A, Szyf M, Cuello AC. Abeta immunoreactive material is present in several intracellular compartments in transfected, neuronally differentiated, P19 cells expressing the human amyloid beta-protein precursor. J Alzheimers Dis. 2000;2:207–222. doi: 10.3233/jad-2000-23-403. [DOI] [PubMed] [Google Scholar]
- 45.Xia W, Zhang J, Ostaszewski BL, Kimberly WT, Seubert P, Koo EH, Shen J, Selkoe DJ. Presenilin 1 regulates the processing of beta-amyloid precursor protein C-terminal fragments and the generation of amyloid beta-protein in endoplasmic reticulum and Golgi. Biochemistry. 1998;37:16465–16471. doi: 10.1021/bi9816195. [DOI] [PubMed] [Google Scholar]
- 46.Hansson Petersen CA, Alikhani N, Behbahani H, Wiehager B, Pavlov PF, Alafuzoff I, Leinonen V, Ito A, Winblad B, Glaser E, Ankarcrona M. The amyloid beta-peptide is imported into mitochondria via the TOM import machinery and localized to mitochondrial cristae. Proc Natl Acad Sci U S A. 2008;105:13145–13150. doi: 10.1073/pnas.0806192105. [DOI] [PMC free article] [PubMed] [Google Scholar]
- 47.DeKroon RM, Armati PJ. The endosomal trafficking of apolipoprotein E3 and E4 in cultured human brain neurons and astrocytes. Neurobiol Dis. 2001;8:78–89. doi: 10.1006/nbdi.2000.0362. [DOI] [PubMed] [Google Scholar]
- 48.DeMattos RB, Thorngate FE, Williams DL. A test of the cytosolic apolipoprotein E hypothesis fails to detect the escape of apolipoprotein E from the endocytic pathway into the cytosol and shows that direct expression of apolipoprotein E in the cytosol is cytotoxic. J Neurosci. 1999;19:2464–2473. doi: 10.1523/JNEUROSCI.19-07-02464.1999. [DOI] [PMC free article] [PubMed] [Google Scholar]
- 49.Xu PT, Gilbert JR, Qiu HL, Ervin J, Rothrock-Christian TR, Hulette C, Schmechel DE. Specific regional transcription of apolipoprotein E in human brain neurons. Am J Pathol. 1999;154:601–611. doi: 10.1016/S0002-9440(10)65305-9. [DOI] [PMC free article] [PubMed] [Google Scholar]
- 50.Takahashi RH, Almeida CG, Kearney PF, Yu F, Lin MT, Milner TA, Gouras GK. Oligomerization of Alzheimer’s beta-amyloid within processes and synapses of cultured neurons and brain. J Neurosci. 2004;24:3592–3599. doi: 10.1523/JNEUROSCI.5167-03.2004. [DOI] [PMC free article] [PubMed] [Google Scholar]
- 51.Waschuk SA, Elton EA, Darabie AA, Fraser PE, McLaurin JA. Cellular membrane composition defines A beta-lipid interactions. J Biol Chem. 2001;276:33561–33568. doi: 10.1074/jbc.M103598200. [DOI] [PubMed] [Google Scholar]
- 52.Lauren J, Gimbel DA, Nygaard HB, Gilbert JW, Strittmatter SM. Cellular prion protein mediates impairment of synaptic plasticity by amyloid-beta oligomers. Nature. 2009;457:1128–1132. doi: 10.1038/nature07761. [DOI] [PMC free article] [PubMed] [Google Scholar]
- 53.Glabe CG. Structural classification of toxic amyloid oligomers. J Biol Chem. 2008;283:29639–29643. doi: 10.1074/jbc.R800016200. [DOI] [PMC free article] [PubMed] [Google Scholar]
- 54.Wu JW, Breydo L, Isas JM, Lee J, Kuznetsov YG, Langen R, Glabe C. Fibrillar oligomers nucleate the oligomerization of monomeric amyloid beta but do not seed fibril formation. J Biol Chem. 285:6071–6079. doi: 10.1074/jbc.M109.069542. [DOI] [PMC free article] [PubMed] [Google Scholar]
- 55.Yamauchi K, Tozuka M, Hidaka H, Nakabayashi T, Sugano M, Katsuyama T. Isoform-specific effect of apolipoprotein E on endocytosis of beta-amyloid in cultures of neuroblastoma cells. Ann Clin Lab Sci. 2002;32:65–74. [PubMed] [Google Scholar]
- 56.Lee do Y, Lee KS, Lee HJ, Jung HY, Lee JY, Lee SH, Youn YC, Seo KM, Lee JH, Lee WB, Kim SS. Alcohol enhances Abeta42-induced neuronal cell death through mitochondrial dysfunction. FEBS Lett. 2008;582:4185–4190. doi: 10.1016/j.febslet.2008.11.007. [DOI] [PubMed] [Google Scholar]
- 57.Fang F, Liu GT. Protective effects of compound FLZ, a novel synthetic analogue of squamosamide, on beta-amyloid-induced rat brain mitochondrial dysfunction in vitro. Acta Pharmacol Sin. 2009;30:522–529. doi: 10.1038/aps.2009.45. [DOI] [PMC free article] [PubMed] [Google Scholar]
- 58.Xu S, Zhong M, Zhang L, Wang Y, Zhou Z, Hao Y, Zhang W, Yang X, Wei A, Pei L, Yu Z. Overexpression of Tfam protects mitochondria against beta-amyloid-induced oxidative damage in SH-SY5Y cells. Febs J. 2009;276:3800–3809. doi: 10.1111/j.1742-4658.2009.07094.x. [DOI] [PubMed] [Google Scholar]
- 59.Cappelletti G, Surrey T, Maci R. The parkinsonism producing neurotoxin MPP+ affects microtubule dynamics by acting as a destabilising factor. FEBS Lett. 2005;579:4781–4786. doi: 10.1016/j.febslet.2005.07.058. [DOI] [PubMed] [Google Scholar]
- 60.Esteves AR, Arduino DM, Swerdlow RH, Oliveira CR, Cardoso SM. Oxidative Stress involvement in alpha-synuclein oligomerization in Parkinsons disease cybrids. Antioxid Redox Signal. 2008 doi: 10.1089/ars.2008.2247. [DOI] [PubMed] [Google Scholar]
- 61.Matsuoka Y, Jouroukhin Y, Gray AJ, Ma L, Hirata-Fukae C, Li HF, Feng L, Lecanu L, Walker BR, Planel E, Arancio O, Gozes I, Aisen PS. A neuronal microtubule-interacting agent, NAPVSIPQ, reduces tau pathology and enhances cognitive function in a mouse model of Alzheimer’s disease. J Pharmacol Exp Ther. 2008;325:146–153. doi: 10.1124/jpet.107.130526. [DOI] [PubMed] [Google Scholar]
- 62.Chang S, ran Ma T, Miranda RD, Balestra ME, Mahley RW, Huang Y. Lipid- and receptor-binding regions of apolipoprotein E4 fragments act in concert to cause mitochondrial dysfunction and neurotoxicity. Proc Natl Acad Sci U S A. 2005;102:18694–18699. doi: 10.1073/pnas.0508254102. [DOI] [PMC free article] [PubMed] [Google Scholar]
- 63.Nakamura T, Watanabe A, Fujino T, Hosono T, Michikawa M. Apolipoprotein E4 (1–272) fragment is associated with mitochondrial proteins and affects mitochondrial function in neuronal cells. Mol Neurodegener. 2009;4:35. doi: 10.1186/1750-1326-4-35. [DOI] [PMC free article] [PubMed] [Google Scholar]
- 64.Brunk UT, Jones CB, Sohal RS. A novel hypothesis of lipofuscinogenesis and cellular aging based on interactions between oxidative stress and autophagocytosis. Mutat Res. 1992;275:395–403. doi: 10.1016/0921-8734(92)90042-n. [DOI] [PubMed] [Google Scholar]
Associated Data
This section collects any data citations, data availability statements, or supplementary materials included in this article.
Supplementary Materials
Kinetics of the accumulation of Aβ42, oligomerized Aβ (I-11), and cleaved caspase-3 levels, and of neuronal loss in CA1 hippocampal neurons of apoE4 mice following inhibition of neprylisin. ApoE4 mice were processed for confocal immunohistochemistry at the indicated times following i.c.v. injection of thiorphan, as described in Materials and Methods. The sections were subjected to Aβ42, I-11 and cleaved caspase-3 confocal microscopy, as described in Materials and Methods, and to NeuN immunohistochemistry as previously described [23]. Panels on the left depict representative confocal sections of apoE3 and apoE4 mice immunostained for NeuN and cleaved caspase-3. Quantitation of the results (mean ± SEM; n = 4–5 mice/group) are for Aβ42 (■), cleaved caspase-3 (○), I-11 (□), and neuronal loss (▲); they are presented for each parameter as the percentage of the maximal change that was observed within 10 days after neprilysin inhibition was initiated. *P < 0.02 for the Aβ42, I-11, and cleaved caspase-3 and P < 0.05 for NeuN for a comparison of the results of the thiorphan-treated apoE4 with those of the other mouse groups.
Determination of the specificity of I-11 to oligomerized Aβ. Panel A. Dot blots of 0.36 μg soluble Aβ42 (1), oligomerized Aβ42 (2) and fibrillar Aβ42 (3) were probed either with the anti Aβ42 mAb 6E10 (upper row) or with Ab I-11 (lower row). Determination of the specificity of I-11 to oligomerized Aβ by blocking experiments is depicted in Panel B. Each dot has 0.36 μg of Aβ2 oligomer. The I-11 reactivity with the unblocked Aβ42 oligomers is shown in the upper row whereas the blots in the lower row were blocked with Aβ42 oligomers (1), Aβ42 fibril (2) and soluble Aβ42 (3). The dot blots experiments and oligomerized and fibrillar Aβ were prepared as described in [27].
Comparison of I-11 and OC levels of oligomerized amyloid in CA1 hippocampal neurons of apoE4 and apoE3 mice following inhibition of neprilysin. ApoE3 and apoE4 male mice were injected i.c.v. with thiorphan or sham-treated for 7 days. The mice were then killed and their brains subjected to anti-I-11 and OC immunohistochemistry and dot-blot experiments, as described in Materials and Methods. (A) Representative coronal sections of thiorphan-treated and sham-treated apoE3 and apoE4 mice immunostained with I-11 are shown on the left (bar = 100 μm). Quantification of the density of I-11 staining (mean ± SEM; n = 4–5 mice/group) in the CA1 neurons is shown on the right. *P < 0.007 for the effect of group × treatment and P < 0.001 for a comparison of the results of the thiorphan-treated apoE4 with those of the other mouse groups. (B) Representative coronal sections of thiorphan-treated and sham-treated apoE3 and apoE4 mice immunostained with OC are shown on the left (bar = 100 μm). Quantification of the density of OC staining (mean ± SEM; n = 4–5 mice/group) in the CA1 neurons is shown on the right. The lower panel depicts representative OC dot blots of the PBS and NP-40 hippocampal extracts from the mouse groups.
Golgi, rough endoplasmic reticulum (RER), and secondary lysosomal pathology in CA1 hippocampal neurons of apoE4 and apoE3 mice following inhibition of neprilysin. ApoE3 and apoE4 mice were injected i.c.v. with thiorphan or sham-treated for 7 days. The mice were then killed and their brains subjected to EM, as described in Materials and Methods. (A) Representative Golgi apparatus and RER EM images of thiorphan-treated and sham-treated apoE3 and apoE4 mice. (B) Representative EM images (left) and EM Aβ immunogold images (right) of secondary lysosomes/autophagosomes of thiorphan-treated apoE3 and apoE4 mice.