Abstract
Social contact networks and the way people interact with each other are the key factors that impact on epidemics spreading. However, it is challenging to model the behavior of epidemics based on social contact networks due to their high dynamics. Traditional models such as susceptible-infected-recovered (SIR) model ignore the crowding or protection effect and thus has some unrealistic assumption. In this paper, we consider the crowding or protection effect and develop a novel model called improved SIR model. Then, we use both deterministic and stochastic models to characterize the dynamics of epidemics on social contact networks. The results from both simulations and real data set conclude that the epidemics are more likely to outbreak on social contact networks with higher average degree. We also present some potential immunization strategies, such as random set immunization, dominating set immunization, and high degree set immunization to further prove the conclusion.
INDEX TERMS: Epidemic modeling, social contact network, epidemic control, optimal strategies
I. INTRODUCTION
Social networks are a social structure made up a set of social actors, such as individuals or organizations, and the “ties” between them [1]. The ties can be either online interactions or face-to-face interactions. Social contact networks are the social networks made up of individuals and the interpersonal contact between them. In this paper, we study the stochastic epidemic models on social contact networks, in which the links between persons are fact-to-face interactions which may cause infections.
The modeling of the epidemics on social contact networks has been studied in recent years. The standard Susceptible-Infected-Recovered (SIR) model is widely used for its simplification and usability. In SIR, individuals in the network are labeled with three compartments: Susceptible (S), Infected (I) and Recovered (R) [2]. Each individual belongs to one of the three compartments and can transit from S to I or from I to R.
Studying the epidemic models helps people to know the dynamics of epidemics on networks and help the decision makers to mitigate the diseases when epidemic outbreaks. The standard SIR model based on assumptions that the networks are homogenous which means all nodes have the same linkage and the probability that there is a link between any two nodes are equal. However, recent research works have shown that the social contact networks have community structure [3]–[5] in which nodes have different linkages and nodes have more links within a cluster than that of between communities. Thus, when there is a significant number of infected individuals in a community, the effected contacts (the contacts that transmit diseases) between susceptible and infected individuals do not grow quickly. This phenomenon is called “crowding” or “protection effect” [6]. Therefore, the linear force of infection used in the standard SIR model has limitation under the typical scenario.
To address this limitation, we proposed a novel ISIR model to capture the dynamics of epidemics. In ISIR, the infection rate (also called the transmission rate of diseases) modeled as a function of the infected individuals considering the “crowding” or “protection effect”. In our ISIR model, at the early stage of the epidemics when the number of infected individuals are small, the infection rate grows quickly with the increase of number of infected individuals. For the spread of diseases, the infection rate also grows slower than a linear increase.
Further, the above SIR model can be used to analyze the number of individuals in the three compartments. But, considering a real epidemic on a small community, it is reasonable to assume the uncertainty or randomness of the final number of infected individuals. For example, in a community with a single epidemic source, the epidemic may never outbreak to a significant number of individuals although the SIR model would predict a significant number of infected individuals. Therefore, we further proposed to use stochastic models to estimate epidemic parameters. With the stochastic models, we further examine the effectiveness of different immunization strategies.
In this work, we study the stochastic epidemic models on social contact networks. The real social contact networks exhibit heterogeneous properties [7]–[9] rather than the homogeneous properties on which the standard SIR model is based. In social contact networks, there are some nodes that have more links than the average. There nodes are often called “hubs”, and they are more likely to be infected quickly when an epidemic outbreaks. The social contact networks are considered to be scale-free networks [10], [11], whose degree distribution follows a power law, at least asymptotically. The Barabási-Albert (BA) model is usually used to generate artificial social contact networks [12]. We studied the propagation of the epidemic diseases in BA network and also evaluate some immunization strategies. It is observed that the high-degree set immunization outperforms random set immunization and dominating set immunization. This result indicate the “hubs” has more impact on the spread of epidemics.
Our major contribution in the paper can be summarized as follow: 1) We proposed a novel ISIR deterministic epidemic model which using a nonlinear force of infection considering the “crowding” or “protection effect” to address the limitation of standard SIR model where the linear fixed force of infection used. Our model is able to present the fact that the actual infect rates increase slower than the rates increase linearly when there are a significant number of individuals in the community are infected;
2) Unlike many existing studies, we employ both deterministic and stochastic models to study the propagation of epidemics on social contact networks with heterogeneous properties. Our results show that the epidemics are more likely to outbreak on the networks with more links among nodes.
3) We examine our models using both simulation and real data set. Especially, we evaluated four immunization strategies on social contact networks. It is observed that the high-degree set and critical set immunization methods outperforms random immunization and dominating set immunization strategies.
The rest of the paper is organized as follows. Section II discusses related research works. Section III presents the deterministic epidemic model. Section IV introduces the stochastic epidemic models on social contact networks. The numerical results are discussed in section V. Section VI presents four immunization strategies, and we conclude the paper in Section VI.
II. RELATED WORK
The standard SIR model has been widely studied since it was proposed in 1927 [2]. Some similar models, i.e., SIS model, SIRS and SEIR, also have been studied. The SEIR model has an additional compartment which consists of exposed individuals in the latent period [13]. These models make the following assumptions: 1) susceptible individuals can get infected from infected individuals via contacts; and 2) an infected individual becomes immune after recovering from the disease. According to these models, if the basic reproduction number R0 is less than λc, an epidemic threshold, the epidemic would not outbreak on the network. Otherwise, a significant number of individuals in the network will be infected [14].
Due to the “crowding” or “protection effect”, the force of infection will not grow quickly with the increase of number of infected individuals. [15], [16] propose a force of infection model, which is βI2, in which β is contact rate and I is number of infected individuals. All symbols and notations used in the paper are listed in Table 1. The authors use this model to study the dynamic of epidemics. However, the model shows the force of infection grows faster when the fraction of infected individuals becomes big, which ignores the facts of “crowding” or “protection effect”. [6], [17] propose more general force of infection models which also consider the “intervation affect”. When the fraction of infected individuals is large, some intervention policies may be placed, such as closing restaurants and schools. In these models, the force of infection is set to be αI2/(b+ I2). However, it is difficult to estimate the effect of these kinds of interventions, especially when several intervention strategies are combined to use. In this work, we proposed a nonlinear force of infection in format of βI/(1 + αI), to consider the “crowding” and “protection effect”, which are ignored in existing models.
TABLE 1.
Symbols and notations.
| Symbols | Notations | |
|---|---|---|
| N | Number of individuals in a community | |
| S(t) | Number of susceptible individuals at time t | |
| I(t) | Number of Infected individuals at time t | |
| R(t) | Number of Recovered individuals at time t | |
| E(t) | Exposed individuals in the latent period at time t | |
| α | Level of crowding effect or protection | |
| β | The contact rate | |
| β′ | The effective contact rate after immunization | |
| γ | Mean recovery rate | |
| λ | The force of infection | |
| λc | The epidemic threshold | |
| R0 | The basic reproduction number | |
|
|
The basic reproduction number after immunization | |
| R∞ | The proportion of recovered individual when t → ∞ | |
| ν | The power law exponent | |
| κ | The degree of a node | |
| 〈κ〉 | The average degree of the network | |
| q | Infection probability | |
| m | Average node degree | |
| n | Number of infected neighbors |
The deterministic epidemic model can predict the overall infected individuals, but it is not able to provide the fluctuation of the total infected nodes [14]. Even when R0 > λc, the epidemic may disappear at the early stage of the spread of epidemics. In contrast, the stochastic epidemic models are able to capture the fluctuation of dynamics of epidemic on real networks [18]. [14] studies the dynamics of epidemic using a fixed probability of infection, but a node representing a person with more infected neighbors are more likely to be infected in reality. [19] uses a linear probability of infection. However, the infection of a node from its infected neighbors should be independent and identically distributed (i.i.d). Therefore, in this paper, a q-influence model is used to simulate the propagation of epidemics on social contact networks. The the fluctuations of the number of infected individuals is demonstrated using Monte Carlo (MC) simulations.
The social contact networks are considered to be scale-free networks [10], [11]. A social contact networks generator, named BA generator, is widely used to generate artificial social networks as the generated network satisfies the statistics of the real social contact networks. The random immunization of the network has been studied in [14]. A wide variety of epidemic control strategies have been proposed and evaluated by kinds of frameworks. An enhancing risk communication method has been proposed to increase the probability of successful control of diseases [20]. An optimized resource allocation algorithm is proposed in the control of epidemics under fixed budget is designed in [21]. The authors in [22] have designed a framework for modeling infectious diseases and optimizing control strategies. In [23], the authors proposed to optimize the stabilization of disease control efficiency. The authors in [24] proposed a framework to evaluate the effectiveness of random and targeted epidemic interventions for spatially separated patches in meta-population models. In [25], a convex framework is proposed to find cost-optimal distribution of vaccination resources when different levels of vaccination are allowed. However, these strategies are not cost-effective.
To find a better immunization strategy, we study the dominating set immunization. However, it is NP-hard to find the minimal k-dominating set of a network when k ≥ 2 [26]. The way to find a small size of k-dominating set is presented in [27]. The high-degree nodes immunization is studied in [28] and [29]. In this work, we compare the performance of the four immunization strategies, and demonstrate that the high-degree immunization is the best one of the four immunization strategies, which also prove the fact that the high degree node usually has high impact on the epidemic spread.
III. THE DETERMINISTIC MODELS OF EPIDEMIC ON SOCIAL CONTACT NETWORKS
A. THE STANDARD SIR MODEL
The SIR model is created by W.O. Kermack and A.G. McKendrick in 1927 [2]. In the SIR model, a fixed population is represented by only three compartments: Susceptible, S(t); Infected, I(t); and Recovered, R(t). S(t) denotes the number of individuals that are not yet infected but susceptible to the diseases at time t; I(t) is used to represent the number of individuals who have been infected with the diseases at time t. Those infected individuals are capable of spreading the diseases to the susceptible individuals. R(t) is the compartment used for people who have recovered from the disease by time t. The recovered people are not able to be infected again or spread the disease to others.
In the above SIR model, many of the details about the progression of infections are neglected, i.e., the differences in response between individuals. But it has been widely studied for its simplification and effectiveness. Fig. 1 shows the flow of the standard SIR model [2]. The standard SIR model can be presented mathematically by the following nonlinear Ordinary Differential Equations (ODE):
| (1) |
in which S(t) + I(t) + R(t) = N, N is the number of individuals in the community. β is the contact rate. γ represents the mean recovery rate. The following are the assumptions used to generate the ODEs:
FIGURE 1.
The flow of the standard SIR model.
It is assumed that the number of community is fixed. The births and deaths are therefore ignored.
It is assumed that the population are fully fixed, and each individual has a small but equal probability of contacting with any others.
Each individual in the population is considered to have equal probability of spreading the disease, β. Therefore, an infected individuals makes contact and transmit the disease with βN individuals per unit time.
The population leaving a susceptible set are considered as equal to the number of individuals entering an infected set, which means that an individual is not able to recover from the disease immediately after being infected with the disease.
The force of infection λ, is the rate of susceptible individuals getting infected, and the new infection is λI/N. According to the ODEs, an infected individual makes contact with βN others per unit time, and the fraction of contacts by an infected individual with a susceptible one is S/N. Therefore the new infected individual in unit time per infective is βN(S/N), then the rate of new infections is βN(S/N)I = βSI. Thus, the force of infection λ is I
| (2) |
We can derive the following equations by dividing the first ODE by the third in equation (1), separating and integrating the variables:
| (3) |
and when t → ∞, we can get
| (4) |
in which R0 is denoted as a basic reproduction number and R0 = Nβ/γ.
For the standard SIR model, there is an epidemic threshold λc [30], [31]. If the basic reproduction ratio R0 is larger than 1/S(0), the disease will spread and infect a finite fraction of the population. On the other hand, if R0 ≤ 1/S(0), only a small fraction of population will be infected. Thus the threshold for the standard SIR model is
| (5) |
B. THE IMPROVED SIR MODEL
In the standard SIR model, the community is assumed to be fully fixed and each individual has the equal probability (i.e., homogeneous nature) to contact with any others. However, many studies show that the social contact networks are heterogeneous instead of homogeneous [18], [32]. In social contact networks, the contact numbers per unit time are reduced by the “crowding effect” or “protection measures”. This means that the force of infection should include the adaptation of individuals to the infection risk. In this work, we proposed an improved SIR model called ISIR, in which the infection rate is not a fixed value, but a function of number of infected individuals λ = β(I). Then we have the following nonlinear ODEs to describe the proposed ISIR model:
| (6) |
in which S(t) + I(t) + R(t) = N, N is the number of individuals in the community. The force of infection λ(I) can be represented as f(I)I, and
| (7) |
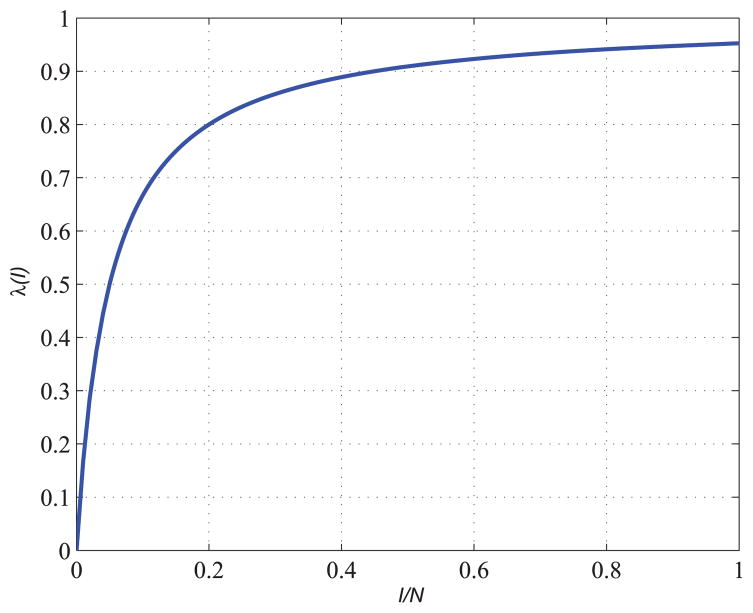
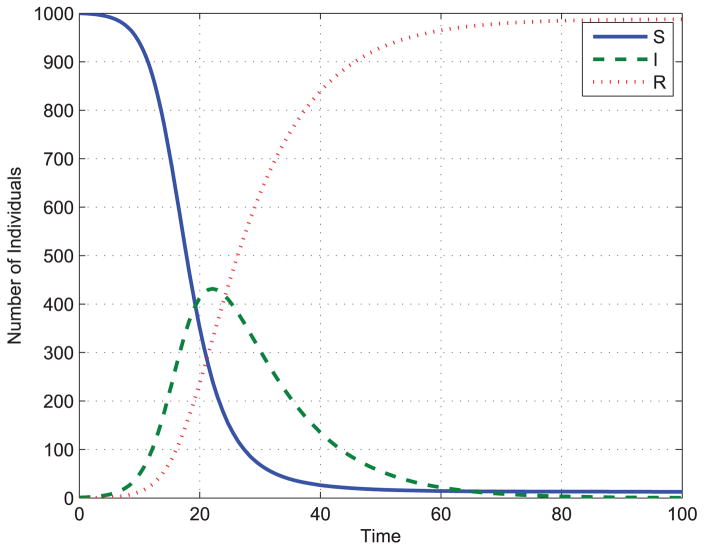
where β is contact rate, α is a parameter describing the level of “crowding effect” or “protection measures”. Fig. 2 shows an example of the nonlinear force of infection with parameters α = β = 20. Fig. 3 shows an example of solution of ODEs in equation (6).
FIGURE 2.
Nonlinear force of infection.
FIGURE 3.
Solution of ODEs of ISIR model.
For the standard SIR model, there is an epidemic threshold λc, as shown in equation (5). In order to see the threshold in the proposed ISIR model, first we derive the basis reproduction ration R0, which can be represented as f (0)N
| (8) |
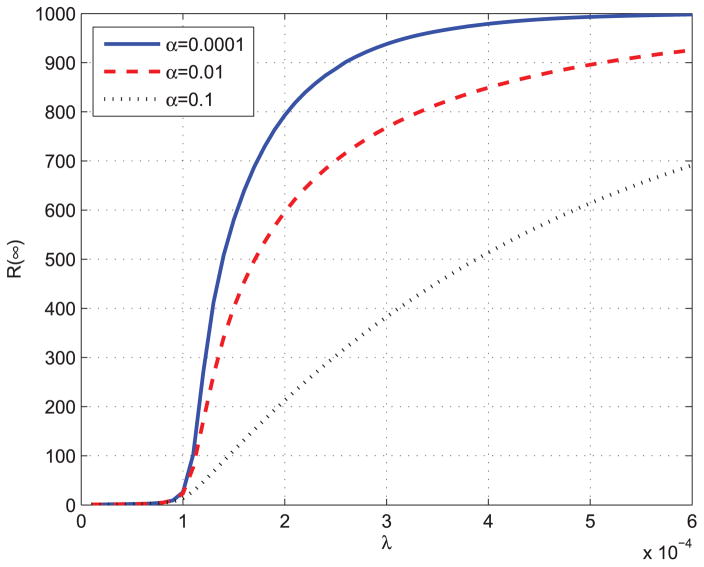
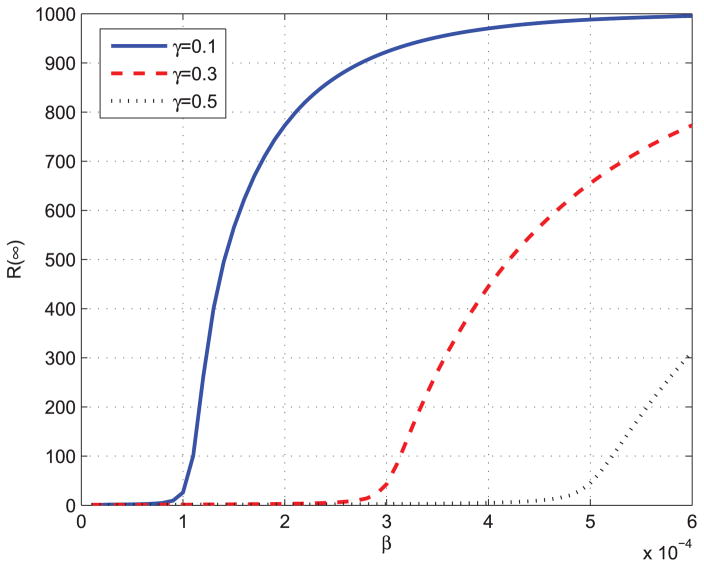
By equation (7), we can get f (0) = β. Then we can prove that the epidemic threshold of proposed ISIR is the same as that of standard SIR model. Next, we will use different parameters to solve ODEs in equation (6) to see how they affect the spread of the epidemics. Fig. 4 and Fig. 5 show the total infected individuals as a function of β. In Fig. 4, γ is fixed to be 0.1, and in Fig. 5, α is fixed to be 0.0001.
FIGURE 4.
Total infected individuals as a function of λ.
FIGURE 5.
Total infected individuals as a function of β.
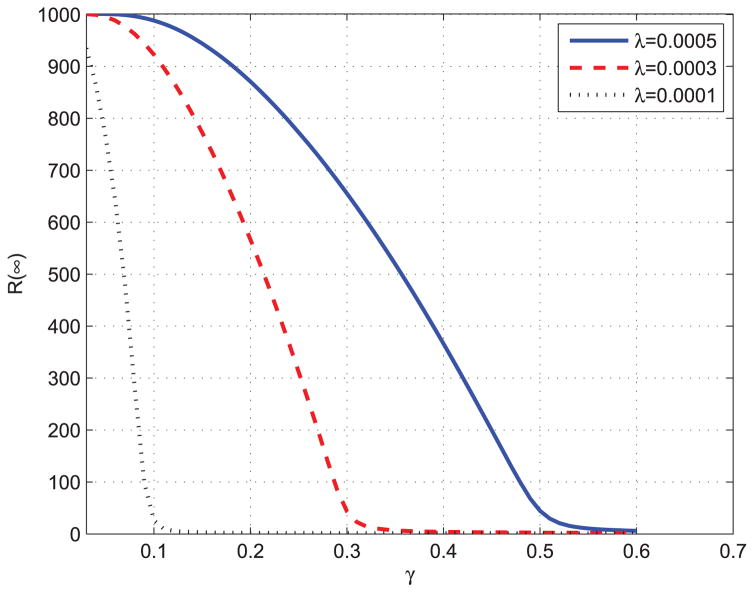
From Fig. 4 and Fig. 5, we can observed that the epidemic spread to a significant number of individuals only when Nβ ≥ γ, which means that R0 = Nβ/γ ≥ S(0)−1 = 1. The results validate the epidemic threshold of the proposed ISIR model. Fig. 6 shows the total infected individuals as a function of γ when β is fixed to be 0.0003.
FIGURE 6.
Total infected individuals as a function of γ.
IV. THE STOCHASTIC MODELS OF EPIDEMICS ON SOCIAL CONTACT NETWORKS
A. SOCIAL CONTACT NETWORKS: SCALE-FREE NETWORKS
Many networks are considered to be scale-free networks, including World Wide Web links, biological networks, and social networks. The research [10], [11] has shown that the social contact networks are also scale-free networks.
A scale-free network is a network whose degree distribution follows a power law distribution, at least asymptotically. Therefore, in social contact networks, the fraction P(k) of nodes in the network having k connections to other nodes goes for large values of k as
| (9) |
where ν is a parameter whose value is typically in the range 2 < ν < 3, although occasionally it may lie outside these bounds.
The above formula implies that the network has infinite size. However, the real social networks consist of finite individuals. For example, the size a social contact networks in a school or a city has a upper limit. The authors in [33] introduce power law with cut-off. Though real social contact networks are actually made up by a finite number of individuals which is far from the thermodynamic limit, their degree distribution can be modeled by a power-law with cut-off. This infinite population introduces a maximum connectivity kc, depending on N, which has the effect of restoring a bound in the connectivity fluctuations. In this work, we use the following equation to analyze the degree distribution of the social contact networks.
| (10) |
where the function f (x) decreases fast for x > 1. The cut-off kc is used to present the constraints limiting the addition of new links in an otherwise infinite networks.
The Barabási-Albert (BA) graph was proposed in [12] as a model of growing networks. Paper [31] also described and used the BA algorithm. In BA algorithm, the successively added nodes establish links with higher probability pointing to already highly connected nodes. Therefore, the generated social contact networks are constructed using the following algorithm:
The algorithm starts from a small number of m0 of nodes;
At each step when adding a new node, the algorithm adds m links connecting the new node to an old node i with a probability.
The probability the new node has a link to connect an old node i is
| (11) |
where ki is the degree of node i and the sum is over all pre-existing nodes j.
After iterating this algorithm for a sufficient number of times, we can add the amount of nodes N as we want to. Then social contact networks we simulated consists of N nodes with connectivity distribution P(k) ~ k−3 and average connectivity 〈k〉 = 2m. The average connectivity, defined by the average node degree, play a major role on these networks.
B. EPIDEMIC PROPAGATION ON SCALE-FREE NETWORKS
Table 2 shows three infection models. In the first one, a node will be infected with a fixed probability q if it has at least one infected neighbor, which means that a node with one infected neighbor has the same probability to be infected with a node has n, n > 1 infected neighbors. To consider the hierarchical infection probability, we can use the second infection model, which shows a linear probability of infections. In the second model, a node with more infected neighbors is more likely to be infected, and the infected probability is proportional to the number of infected neighbors. We use the q-influence model to show the fact that the infection probability increases faster than a linear infection. In q-influence model, the probability that a susceptible node will be infected by one of its infected neighbors is q, and the infections from all its infected neighbors are independent. So if a susceptible node has n infected nodes at time t, the probability that it will be infected at the next time by its n infected neighbors is
TABLE 2.
Infection models.
| Models | Description |
|---|---|
| p = q | A fixed probability of infection |
| p = nq | A linear probability of infection |
| p = 1 − (1 −q)n | A q-influence model |
| (12) |
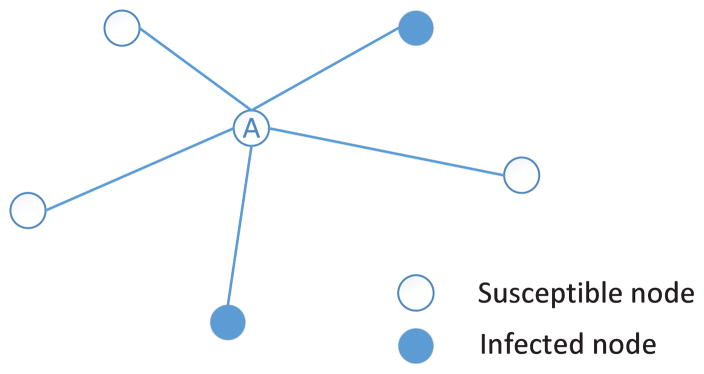
Fig. 7 shows an example of the q-influence model, in which the central node A has five neighbors and two out of them are infected nodes. According to equation (12), the probability that node A will be infected by its infected neighbors is p = 1 − (1 − q)2. When q = 0.5, then the probability that node A will be infected is equal to 0.75. In the following of this paper, the q-influence model is utilized to simulate the propagation of the epidemics on social contact networks.
FIGURE 7.
An example of q-influence model.
V. NUMERICAL RESULTS
In this section, we will simulate epidemics on both artificial social contact networks and real social contact networks. The artificial social networks are generated by BA generator [12], and the data for real social contact networks are download from the SocioPatterns datasets [34].
A. EPIDEMICS ON BA NETWORKS
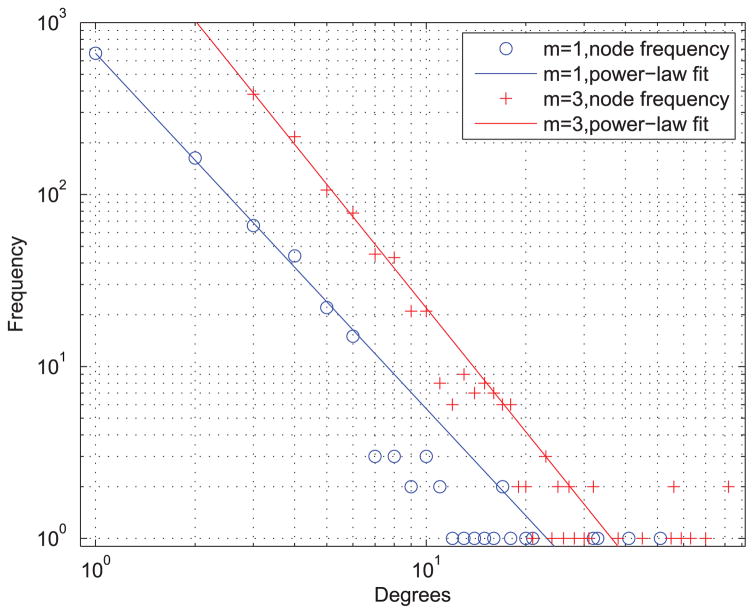
We simulate the spread of epidemics on artificial social contact networks generated using BA models with different parameters. We consider the BA network size N = 103, and thus the average degree of nodes in hte network with m = 1 and m = 6, are 〈k〉 = 2 and 〈k〉 = 6, respectively. Figure 8 shows the degree distribution of the two artificial social contact networks generate by BA models with m = 1 and m = 3.
FIGURE 8.
The degree distribution of the artificial social contact networks generate by BA models m = 1 and m = 3.
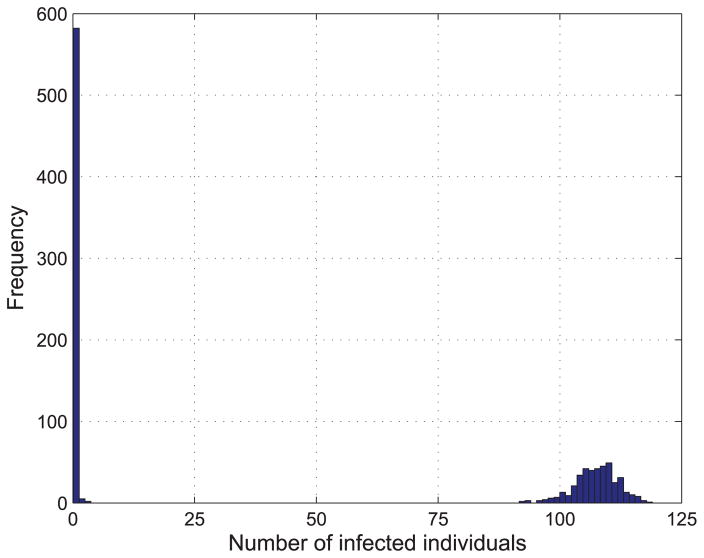
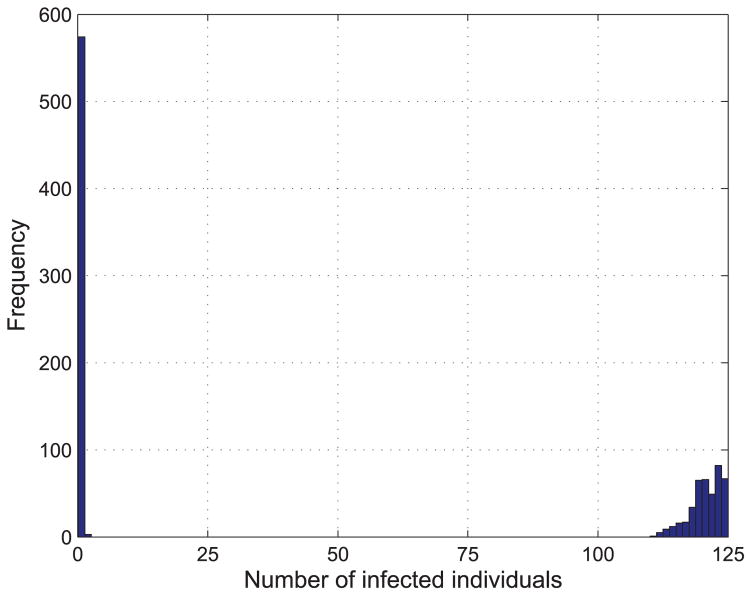
We study the effects of q in the spreading of epidemics on BA networks. We set q = {0.09, 0.1, 0.11} and γ = 0.1. We have run 1000 times of simulations for each pair of parameters to avoid the disappearance of epidemics at the early stage. The distributions of the epidemic size for each pair of (q, γ) on networks with m = 1 and m = 3 are shown in Figure 9 and Figure 10, respectively.
FIGURE 9.
Distribution of the epidemic size from 1000 simulations with q = 0.09 (a), q = 0.1 (b), q = 0.11 (c), γ = 0.1 and m = 1.
FIGURE 10.
Distribution of the epidemic size from 1000 simulations with q = 0.09 (a), q = 0.1 (b), q = 0.11 (c), γ = 0.1 and m = 3.
From figure 9 we can find when q is small, the epidemic size is small. With the increase of q, it is more likely that all the nodes in the network are infected or have been recovered from the disease. Figure 10 shows the same trend with the increase of q, but it should be noted that the epidemic size is larger when m = 3 than that of m = 1. That is because the epidemics are more likely to outbreak on networks with high average degree which means that individuals have more interactions with each other.
B. EPIDEMICS ON REAL SOCIAL CONTACT NETWORKS
In the above, we study the spread of epidemics on artificial social contact networks. Next, we will investigate the spread of epidemics on real social contact networks. Here we use a social contact networks dataset named “Primary school-cumulative networks (PS)”. The dataset comprises two weighted networks of face-to-face proximity between students and teachers [35]. A daily contact network is provided with nodes representing individuals and edges representing the face-to-face interactions. There exists a edge between two individuals if at least one face-to-face interaction between them is recorded.
We select one day from the dataset, October 2nd, 2009, set q = {0.1, 0.11} and γ = 0.1, and then randomly select a node to be epidemic source to spread the epidemic disease on the PS network. We run 1000 times simulations and the results are shown in Fig. 11 and 12.
FIGURE 11.
Distribution of the final size from 1000 simulations with q = γ = 0.1.
FIGURE 12.
Distribution of the final size from 1000 simulations with q = 0.11 and γ = 0.1.
From Fig. 11 and Fig. 12, it is observed that the epidemic is more likely to spread to the whole PS network compared to that on BA network with the same parameters. This is because the average degree of the PS network is much higher than that of BA network generated above.
VI. IMMUNIZATION STRATEGIES
In this section, we use the proposed models to examine the immunization methods to control the epidemics on social contact networks. We study four epidemic control methods, random set (RS) immunization, dominating set (DS) immunization, high-degree set (HS) immunization, and critical node set immunization (CS). The performance of these strategies are also compared.
According to equation (7) and equation (8), for the network with a single epidemic source S(0) = 1, the threshold of the ISIR model is
| (13) |
The RS method means that nodes are randomly selected from the network and immunized. If ηN nodes are randomly selected from the network and are immunized, the effective contact rate β′ is β′ = (1 − η)β. It follows the reproduction number after a fraction of η has been immunized to be
| (14) |
Next, we introduce the DS immunization method. A dominating set for a network is a subset of nodes such that every other nodes in the network is adjacent to at least one node in it. For a k-Dominating Set (k-DS), each node in the network is either in the k-DS or can reach to one node in k-DS via at most k hops. Here we study the performance of k-DS immunization method for epidemic control on social contact networks. The construction of algorithm k-DS used in this paper are presented in [27]. Here, k = 1, 2, 3 are used in the simulation. Then, we study the performance of epidemic control using HS immunization method. In HS method, we first sort all the nodes in the network according to their degrees, and then immunize a fraction of η nodes from the highest degree node to the lowest degree node.
We also study the performance of critical node set (CS) immunization strategy on our ISIR model. A critical node set is identified from the network by unequal graph partitioning (UGP) [36]. The CS immunization works by immunizing the critical node set to prevent the spreading of the diseases on the networks when epidemic outbreaks. The basic idea of UGP is to identify a subset of nodes that can disconnect the network and decompose it to a set of sub-networks when these nodes are removed. Thus the number of infected individuals will be less than the size of the largest sub-network. The algorithm of the critical node identification in UGP is as follows: 1) Get the connected component G′ from the graph G, which represents a social contact network; 2) Randomly assign nodes in G′ to two clusters G1 and G2; 3) Move all nodes in G1 that connect to nodes in G2 and nodes in G2 that connect to nodes in G1 to cluster G3; 4) Randomly swap nodes in G3 with nodes in G1 or G2; a swap is accepted only if the size of G3 is reduced after the swapping and it does not bring in the connections between G1 and G2. Otherwise, the swap is dropped. 5) Repeat step 4 until no further swap can reduce the size of G3. Then the set of G3 is called a critical node set. 6) Run the above steps iteratively on the sub-networks G1 and G2 until the sizes of all the sub-networks are smaller than a predefined value. The overall critical node set is the union of all critical node sets. Therefore, though this algorithm, the epidemics will be limited to spread in a sub-network if there is only one epidemic source and the number of infected individuals will be less that the size of the largest sub-network.
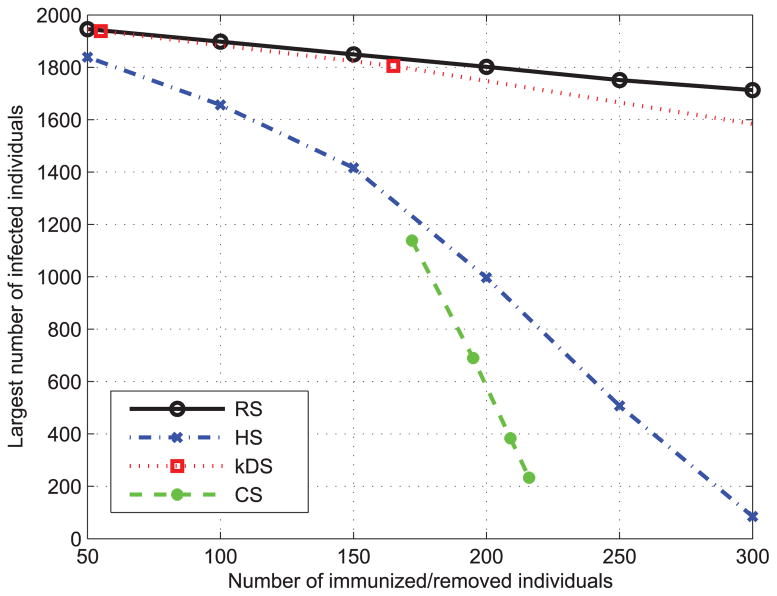
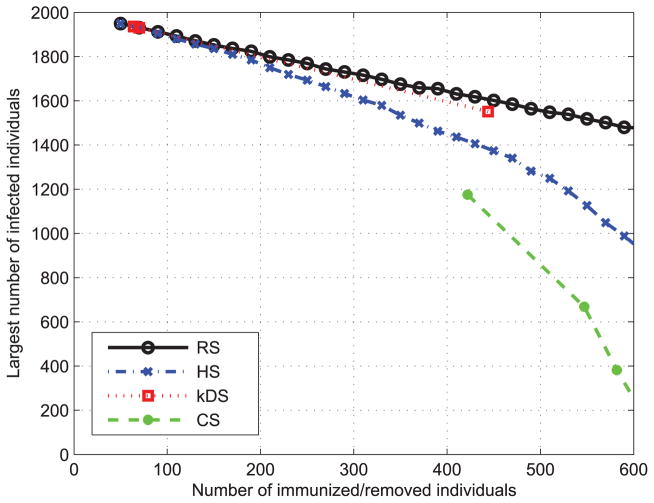
Finally, we compare the performance of the above four immunization strategies on both real and artificial social networks. We first use the BA algorithm to generate two social contact networks with N = 2000, m = 2, k = 2 and N = 2000, m = 4, k = 2, respectively. Then we apply each immunization method on these two networks. The results are shown in Fig. 13 and Fig. 14 shows the performance of four immunization strategies. It is observed that HS method is an effective strategy that outperforms k-DS and DS although our CS immunization method [36] achieves the best performance. The effectiveness of the CS method benefits from grouping high degree nodes for the immunization. Both HS and CS demonstrate that a node with high degree has the significant impact on the spread of epidemic disease and the epidemics are more likely to outbreak on social contact networks with higher average degree.
FIGURE 13.
Performance of different immunization methods on BA network with N = 2000, m = 2 and k = 2.
FIGURE 14.
Performance of different immunization methods on BA network with N = 2000, m = 4 and k = 2.
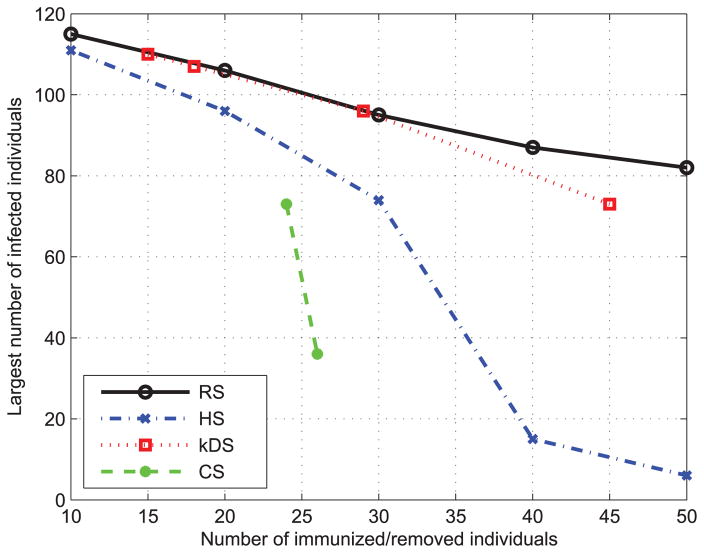
We use real data set of the primary school-cumulative networks (PS), a real social networks, to evaluate the performance of these immunization strategies. As shown in Fig. 15, both the CS and HS immunization methods can achieve the better performance than DS and k-DS methods mentioned above. The results are consistent with our studies on the BA contact social network. They not only validate the accuracy of our proposed models, but also further prove the significance of the high degree nodes for the epidemic spreading.
FIGURE 15.
Performance of different immunization methods on primary school-cumulative networks (PS).
VII. CONCLUSION
In this paper, we proposed novel ISIR epidemic models with nonlinear forces of infection to characterize the epidemic spread on social contact networks with the consideration of the “crowding” or “protection effect”. We employed a stochastic model, q-influence model to simulate the propagation of epidemics on social contact networks. We examine the effectiveness of our models for epidemics spreading on both simulated and real social contact networks. The results on both networks are consistent with each other. In addition, four immunization strategies for epidemic control are evaluated using our proposed models, which demonstrate the fact that the epidemics are more likely to outbreak on social contact networks with higher average degree.
Our ISIR model can be used to analyze the epidemic dynamic, predict the spreading of epidemics, and optimize the control strategies on social contact networks, i.e., the Severe acute respiratory syndrome (SARS) in 2003 and the flu pandemic (H1N1) in 2009. It helps the decision makers to optimize the epidemic control strategies by estimating their performance in simulations.
Our work has built up a foundation for potentially effective epidemic control strategies based on real time collected social contact networks. Though this work is targeted at the spread of epidemics, the methods presented here could be applied for other applications such as the spread of rumors or ideas through social contact networks.
Acknowledgments
This work was supported by NIH grant R01 DA033323-01A1, 1UL1RR031982-01 Pilot Project, in part by NSF through the Division of Electrical, Communications and Cyber Systems under Award ECCS-1407882, in part by the NIH/National Institute on Drug Abuse under Award 1R01DA033323-01, and in part by NSF under Award IIS-1401711 and Award CNS-1451629.
Biographies

ZHAOYANG ZHANG received the B.S. degree in science and the M.S. degree in electrical engineering from Xidian University, Xi’an, China, in 2007 and 2010, respectively. He is currently pursuing the Ph.D. degree with the Department of Electrical and Computer Engineering, University of Massachusetts, Dartmouth, MA, USA. His current research interests include wireless healthcare, wireless body area networks, and cyber-physical systems.

HONGGANG WANG received the Ph.D. degree in computer engineering from the University of Nebraska—Lincoln, Lincoln, NE, USA, in 2009. He is currently an Assistant Professor with the Department of Electrical and Computer Engineering, University of Massachusetts, Dartmouth, MA, USA.
His research interests include wireless communication and networking, sensor networks, multimedia communications, social networks, and wireless healthcare. He has authored over 100 papers. He serves as the Chair/Co-Chair of several international conferences and on the Editorial Board of several journals, such as the IEEE Internet of Things Journal, the IEEE Transactions on Big Data, the IEEE Access, and the IEEE Communication Magazine. He was a lead Guest Editor of the IEEE Journal of Biomedical and Health Informatics (previous IEEE Transactions on Information Technology in Biomedicine) of the special issue on Emerging Wireless Body Area Networks for Ubiquitous Healthcare in 2013.

CHONGGANG WANG (SM’04) received the Ph.D. degree from the Beijing University of Posts and Telecommunications, Beijing, China, in 2002. He is currently a Senior Staff Engineer with InterDigital, Inc., Wilmington, DE, USA, where he is involved in Internet of Things. He has co-authored over 100 journal/conference articles. He is on the Editorial Board of several journals. He is the Editor-in-Chief of the IEEE Internet of Things Journal. He serves as the Vice Chair of the IEEE ComSoc Multimedia Technical Committee.

HUA FANG is currently an Associate Professor with the Department of Quantitative Health Sciences, Division of Biostatistics and Health Services Research, University of Massachusetts Medical School, Worcester, MA, USA. Her research interests include computational statistics, research design, statistical modeling, and analyses in clinical and translational research. She is interested in developing novel methods and applying emerging robust techniques to enable and improve the studies that can have broad impact on the treatment or prevention of human disease.
References
- 1.Wasserman S, Galaskiewicz J, editors. Advances in Social Network Analysis: Research in the Social and Behavioral Sciences. Vol. 171. Washington, DC, USA: Sage Publ; 1994. [Google Scholar]
- 2.Kermack WO, McKendrick AG. A contribution to the mathematical theory of epidemics. Proc Roy Soc London Ser A, Contain Papers Math Phys Character. 1927;115(772):700–721. [Google Scholar]
- 3.Girvan M, Newman MEJ. Community structure in social and biological networks. Proc Nat Acad Sci. 2002;99(12):7821–7826. doi: 10.1073/pnas.122653799. [DOI] [PMC free article] [PubMed] [Google Scholar]
- 4.Nguyen NP, Dinh TN, Xuan Y, Thai MT. Adaptive algorithms for detecting community structure in dynamic social networks. Proc. IEEE INFOCOM; Apr. 2011; pp. 2282–2290. [Google Scholar]
- 5.Newman MEJ. Community detection and graph partitioning. Europhys Lett. 2013;103(2):28003. [Google Scholar]
- 6.Wang W. Epidemic models with nonlinear infection forces. Math Biosci Eng. 2006;3(1):267–279. doi: 10.3934/mbe.2006.3.267. [DOI] [PubMed] [Google Scholar]
- 7.Guofeng L, Ying T, Xiaomei Y. The student’s contact model based on complex network. Proc. Int. Conf. Electron., Commun. Control; Sep. 2011; pp. 4591–4593. [Google Scholar]
- 8.Xia H, Chen J, Marathe M, Mortveit HS. Synthesis and Refinement of Detailed Subnetworks in a Social Contact Network for Epidemic Simulations. Vol. 6589. Berlin, Germany: Springer-Verlag; 2011. pp. 366–373. [Google Scholar]
- 9.Belsky J, Rovine M. Social-network contact, family support, and the transition to parenthood. J Marriage Family. 1984;46(2):455–462. [Google Scholar]
- 10.Centola D. Failure in complex social networks. J Math Sociol. 2007;33(1):64–68. [Google Scholar]
- 11.Christensen C, Albert I, Grenfell B, Albert R. Disease dynamics in a dynamic social network. Phys A. 2010;389(13):2663–2674. doi: 10.1016/j.physa.2010.02.034. [DOI] [PMC free article] [PubMed] [Google Scholar]
- 12.Barabási AL, Albert R. Emergence of scaling in random networks. Science. 1999;286(5439):509–512. doi: 10.1126/science.286.5439.509. [DOI] [PubMed] [Google Scholar]
- 13.Li MY, Muldowney JS. Global stability for the SEIR model in epidemiology. Math Biosci. 1995;125(2):155–164. doi: 10.1016/0025-5564(95)92756-5. [DOI] [PubMed] [Google Scholar]
- 14.Britton T. Stochastic epidemic models: A survey. Math Biosci. 2010;225(1):24–35. doi: 10.1016/j.mbs.2010.01.006. [DOI] [PubMed] [Google Scholar]
- 15.Liu WM, Levin SA, Iwasa Y. Influence of nonlinear incidence rates upon the behavior of SIRS epidemiological models. J Math Biol. 1986;23(2):187–204. doi: 10.1007/BF00276956. [DOI] [PubMed] [Google Scholar]
- 16.Liu WM, Hethcote HW, Levin SA. Dynamical behavior of epidemiological models with nonlinear incidence rates. J Math Biol. 1987;25(4):359–380. doi: 10.1007/BF00277162. [DOI] [PubMed] [Google Scholar]
- 17.Capasso V, Serio G. A generalization of the Kermack–McKendrick deterministic epidemic model. Math Biosci. 1978;42(1–2):43–61. [Google Scholar]
- 18.Zhang Z, Wang H, Lin X, Fang H, Xuan D. Effective epidemic control and source tracing through mobile social sensing over WBANs. Proc. IEEE Int. Conf. Comput. Commun. (INFOCOM); Turin, Italy. Apr. 2013; pp. 300–304. [Google Scholar]
- 19.Huerta R, Tsimring LS. Contact tracing and epidemics control in social networks. Phys Rev E, Statist, Nonlinear Soft Matter Phys. 2002;66(5):056115. doi: 10.1103/PhysRevE.66.056115. [DOI] [PubMed] [Google Scholar]
- 20.Ou S-M, Liu L-L, Chin K-C. Enhancing risk communication for more effective epidemic control in Taiwan. Asia-Pacific J Public Health. 2014;26(1):85–92. doi: 10.1177/1010539512466427. [DOI] [PubMed] [Google Scholar]
- 21.Kasaie P, Kelton WD. Simulation optimization for allocation of epidemic-control resources. IIE Trans Healthcare Syst Eng. 2013;3(2):78–93. [Google Scholar]
- 22.Grefenstette JJ, et al. FRED (a framework for reconstructing epidemic dynamics): An open-source software system for modeling infectious diseases and control strategies using census-based populations. BMC Public Health. 2013;13(1):940. doi: 10.1186/1471-2458-13-940. [DOI] [PMC free article] [PubMed] [Google Scholar]
- 23.Bousset L, Chèvre A-M. Stable epidemic control in crops based on evolutionary principles: Adjusting the metapopulation concept to agro-ecosystems. Agriculture, Ecosyst Environ. 2013 Jan;165:118–129. [Google Scholar]
- 24.Tanaka G, Urabe C, Aihara K. Random and targeted interventions for epidemic control in metapopulation models. Sci Rep. 2014 Jul;4 doi: 10.1038/srep05522. Art. ID 5522. [DOI] [PMC free article] [PubMed] [Google Scholar]
- 25.Preciado VM, Zargham M, Enyioha C, Jadbabaie A, Pappas G. Optimal vaccine allocation to control epidemic outbreaks in arbitrary networks. Proc. IEEE 52nd Annu. Conf. Decision Control (CDC); Dec. 2013; pp. 7486–7491. [Google Scholar]
- 26.Garey MR, Johnson DS. Computers and Intractability: A Guide to the Theory of NP-Completeness. Vol. 24. San Francisco, CA, USA: Freeman; 1979. [Google Scholar]
- 27.Devismes S, Heurtefeux K, Rivierre Y, Datta AK, Larmore LL. Self-stabilizing small k-dominating sets. Proc. 2nd Int. Conf. Netw. Comput; Nov./Dec 2011; pp. 30–39. [Google Scholar]
- 28.Pastor-Satorras R, Vespignani A. Handbook of Graphs and Networks From the Genome to the Internet. New York, NY, USA: Wiley; 2002. Epidemics and immunization in scale-free networks; p. 417. [Google Scholar]
- 29.Pastor-Satorras R, Vespignani A. Immunization of complex networks. Phys Rev E. 2002 Feb;65(3):036104. doi: 10.1103/PhysRevE.65.036104. [DOI] [PubMed] [Google Scholar]
- 30.Murray JD. Mathematical Biology: I. An Introduction. Vol. 2. Berlin, Germany: Springer-Verlag; 2002. [Google Scholar]
- 31.Moreno Y, Pastor-Satorras R, Vespignani A. Epidemic outbreaks in complex heterogeneous networks. Eur Phys J B-Condens Matter Complex Syst. 2002;26(4):521–529. [Google Scholar]
- 32.Wilson C, Boe B, Sala A, Puttaswamy KPN, Zhao BY. User interactions in social networks and their implications. Proc. 4th ACM Eur. Conf. Comput. Syst. (EuroSys); 2009. pp. 205–218. [Google Scholar]
- 33.Pastor-Satorras R, Vespignani A. Epidemic dynamics in finite size scale-free networks. Phys Rev E-Statist, Nonlinear Soft Matter Phys. 2002;65(3):035108. doi: 10.1103/PhysRevE.65.035108. [DOI] [PubMed] [Google Scholar]
- 34.Isella L, Stehlé J, Barrat A, Cattuto C, Pinton JF, Van den Broeck W. What’s in a crowd? Analysis of face-to-face behavioral networks. J Theoretical Biol. 2011;271(1):166–180. doi: 10.1016/j.jtbi.2010.11.033. [DOI] [PubMed] [Google Scholar]
- 35.Stehle J, et al. High-resolution measurements of face-to-face contact patterns in a primary school. PLoS ONE. 2011;6(8):e23176. doi: 10.1371/journal.pone.0023176. [DOI] [PMC free article] [PubMed] [Google Scholar]
- 36.Zhang Z, Wang H, Wang C, Fang H. Cluster-based epidemic control through smartphone-based body area networks. IEEE Trans Parallel Distrib Syst. 2015 Mar;26(3):681–690. doi: 10.1109/TPDS.2014.2313331. [DOI] [PMC free article] [PubMed] [Google Scholar]


