Abstract
Aryl hydrocarbon receptor interacting protein (AIP) is thought to be a tumor suppressor gene, as indicated by a mutational analysis of pituitary somatotroph adenomas. However, the physiological significance of AIP inactivation in somatotroph cells remains unclear. Using CRISPR/Cas9, we identified a GH3 cell clone (termed GH3-FTY) in which Aip was genetically disrupted, and subsequently investigated its character with respect to growth hormone (Gh) synthesis and proliferation. Compared with GH3, GH3-FTY cells showed remarkably increased Gh production and a slight increase in cell proliferation. Gh-induced Stat3 phosphorylation is known to be a mechanism of Gh oversecretion in GH3. Interestingly, phosphorylated-Stat3 expression in GH3-FTY cells was increased more compared with GH3 cells, suggesting a stronger drive for this mechanism in GH3-FTY. The phenotypes of GH3-FTY concerning Gh overproduction, cell proliferation, and increased Stat3 phosphorylation were significantly reversed by the exogenous expression of Aip. GH3-FTY cells were less sensitive to somatostatin than GH3 cells in the suppression of cell proliferation, which might be associated with the reduced expression of somatostatin receptor type 2. GH3-FTY xenografts in BALB/c nude mice (GH3-FTY mice) formed more mitotic somatotroph tumors than GH3 xenografts (GH3 mice), as also evidenced by increased Ki67 scores. GH3-FTY mice were also much larger and had significantly higher plasma Gh levels than GH3 mice. Furthermore, GH3-FTY mice showed relative insulin resistance compared with GH3 mice. In conclusion, we established a somatotroph cell line, GH3-FTY, which possessed prominent Gh secretion and mitotic features associated with the disruption of Aip.
Introduction
Germline mutations in the aryl hydrocarbon receptor interacting protein gene (AIP) predispose to pituitary adenomas, mainly somatotropinomas. These AIP germline mutations have been identified in 15%–20% of patients with familial isolated pituitary adenoma (FIPA) and in 3%–5% of patients with sporadic pituitary adenomas [1–5]. The prevalence of these mutations rises to 40%–50% in families with familial acromegaly and families with prolactinomas or somatotropinomas [2, 4], and to 10%–15% even in sporadic cases of prolactinomas or somatotropinomas [6].
AIP demonstrates strong amino acid sequence homology between rats and mice, rats and humans, and mice and humans at 97.0%, 94.0%, and 94.2%, respectively, indicating that it is highly conserved between species. Most common AIP alterations result in amino acid substitutions or a truncated AIP protein particularly within the C-terminal, which contains three tetratricopeptide repeats (TPR) responsible for protein–protein interactions [3, 7] Such tumors containing AIP mutations typically have a tendency to occur in individuals at a younger age, to become larger and more aggressive [1–6], and to be resistant to somatostatin analogs which are the first-line drug therapy for acromegaly [3, 4, 8, 9]. AIP has been postulated to be a tumor suppressor gene from several experimental findings about its in vitro function. These include, an in vitro culture experiment using a forced expression system which revealed that wild-type AIP suppresses cell proliferation whereas mutant AIP loses this effect, and that partial knockdown of AIP by small interfering RNA (siRNA) leads to increased cell proliferation [3, 10–13].
While the molecular mechanisms of pituitary tumorigenesis by AIP inactivation remain unclear, several mechanisms have been proposed; AIP inactivation results in a failure to inhibit cyclic adenosine monophosphate (cAMP) production through dysfunctional G-protein alpha-i signaling [13], while AIP mutations disturb the interaction with phosphodiesterases, thus leading to an increase in cAMP production [11]. With respect to the relatively insensitive response of some somatotropinomas to somatostatin analogs, the decreased changes in expression of the antiproliferative gene zinc-finger regulator of apoptosis and cell-cycle arrest (ZAC-1; also known as PLAGL1) by AIP inactivation has been suggested to be a mechanism [14, 15]. ZAC1 may exert an antiproliferative effect by inducing apoptosis and G1 cell cycle arrest [16].
The above hypothesis of AIP action is mostly based on clinical observations combined with mutational analysis, immunohistochemical studies of pituitary tumors, and in vitro experiments using exogenous expression of wild-type or mutant AIP in pituitary cells or siRNA knockdown of AIP, particularly in rat pituitary GH3 cells. However, the phenotype of complete knockdown of AIP in GH-producing cells has not been clarified. In Aip knockout mice, heterozygous mice were extremely prone to pituitary adenomas, whereas the total lack of Aip resulted in embryonic lethality [17].
A rat pituitary tumor cell line, GH3, was first described as a homogenous clonal cell line that secretes Gh [18] and, later, was shown to also secrete prolactin (Prl) [19]. This cell line has been suggested not to be a homogeneous population, but rather functionally heterogeneous based on the presence of a subset of both Gh-secreting and Prl-secreting cells by reverse hemolytic plaque assays and altered proportions of secreted Gh and Prl in response to different stimuli [20].
In this study, to clarify the endogenous AIP function, we generated an Aip knockout cell line from GH3 cells, termed GH3-FTY cells, using the CRISPR/Cas9 system [21]. We then characterized the capability of GH3-FTY cells for proliferation and Gh secretion in vitro and in vivo through comparisons with the parental line. We also investigated the underlying mechanism of increased Gh secretion and proliferation of GH3-FTY cells.
Materials and Methods
Cell line and sequence analysis of Aip
A rat pituitary tumor cell line, GH3, (ATCC, Manassas, VA) was cultured in F-12K medium (Life Technologies, Carlsbad, CA) containing 15% horse serum, 2.5% fetal bovine serum, 100 unit/ml penicillin, and 100 μg/ml streptomycin. The Aip sequence in GH3 cells was first confirmed. Genomic DNA was extracted using the Wizard genomic DNA purification kit (Promega, Madison, WI) and the exons containing splicing sites of adjacent introns were amplified by PCR using KOD FX (TOYOBO, Osaka, Japan) and directly sequenced using PCR primers detailed in S1 Table. The sequence was compared with that of Aip (NM_172327.2).
Aip-knockout clone
Aip-mutant clones were created using the GeneArt CRISPR Nuclease Vector Kit (Life technologies) according to the manufacturer’s protocol. Because we identified a heterozygous frameshift mutation causing a premature stop codon that was causative of familial acromegaly (unpublished data), we targeted exon 4 using CRISPR/Cas9 in this study. c.490–492 and c.493–512 of Aip (NM_172327.2) were chosen as the protospacer adjacent motif and the target sequence, respectively. The top strand, 5′-TGCCCATGGGTCCTGCTGTTTT-3′ and the bottom strand, 5′-AGCAGGACCCATGGGCACGGTG-3′ were annealed and cloned into the CRISPR Nuclease Vector. The constructed CRISPR Nuclease Vector plasmid was nucleofected into GH3 cells using the Nucleofector Kit L (Lonza, Basel, Switzerland). Two days after nucleofection, CD4-positive cells were sorted using human CD4 MicroBeads (Milteni Biotec, Cologne, Germany). The sorted cells were seeded into 96-well plates at one cell per well and cultured. Genomic DNA was extracted from each clone and exon 4 of Aip was amplified and directly sequenced. Other exonic sequences of Aip including exon–intron boundaries of the target clones were also directly sequenced.
Quantitative real-time PCR (qPCR) and the lentivirus vector
To examine mRNA expression levels, 2×10⁵ GH3 cells, Clone 1 (GH3-FTY), or Clone 2 were seeded into each well of 24-well plates and total RNA was prepared after a 48-h incubation using the RNeasy Kit (Qiagen, Venlo, the Netherlands). cDNA was prepared from 1 μg total RNA using the QuantiTect RT Kit (Qiagen), and qPCR was performed using Light Cycler 2.0 (Roche, Basel, Switzerland) and SYBR Premix Ex Taq II (Takara, Otsu, Japan). Primers are listed in S1 Table. PCR conditions are available on request.
Forced expression of Aip was performed by a lentivirus-mediated method as previously described [22]. Rat Aip cDNA synthesized and verified by Eurofins Genomics Co., Ltd (Tokyo, Japan) was used to construct a lentivirus vector plasmid (CSII-EF-IRES2-Venus) (RIKEN BRC) and prepared lentivirus. To investigate whether exogenous Aip may reverse the phenomenon observed in GH3-FTY cells, cells were infected with lentivirus vector containing rat Aip cDNA (LV-Aip) or gfp cDNA (LV-GFP) as a control at multiplicity of infection (MOI) 25.
Western blotting and immunoprecipitation
Western blotting was performed as described previously [23]. Both cell lines were cultured for 48 h, and lysed in RIPA Buffer (Sigma-Aldrich, Tokyo, Japan). Total protein was subjected to sodium dodecyl sulfate polyacrylamide gel electrophoresis (SDS-PAGE), transferred to PVDF membranes (BIO-RAD, Tokyo, Japan), and incubated with antibodies described in S2 Table. Each protein was detected using ECL Prime (GE Healthcare, Little Chalfont, UK).
For immunoprecipitation, cells were lysed in lysis buffer containing 50 mM Tris-HCl (pH 8.0), 150 mM NaCl, 1% NP-40, 1% protease inhibitor cocktail (nacalai tesque, Kyoto, Japan) and 1% phosphatase inhibitor cocktail (nacalai tesque). Cell lysate containing 1 mg of total protein was pre-incubated with protein A or G magnetic beads (CST) at 4°C for 1 h, and the supernatant was collected. This was then incubated with anti-pStat3 antibody (CST), anti-Stat3 antibody (CST), anti-Aip antibody (Novus), normal rabbit IgG, or normal mouse IgG at 4°C overnight, and then protein A or G magnetic beads were added and incubated at 4°C for 1 h. The magnetic beads were washed five times with lysis buffer, and 2 × SDS-PAGE sample buffers was added to the magnetic beads, and incubated at 96°C for 5 min. The immunoprecipitated sample was then subjected to western blotting as described above.
cAMP concentration
2×10⁵ of GH3 or GH3-FTY cells were plated in each well of 24-well plates, cultured for 24 h, and the intracellular cAMP concentration was determined using the Cyclic AMP Select EIA Kit (Cayman Chemical, Ann Arbor, MI) according to the manufacturer’s protocol.
Cell proliferation
A total of 1×10⁴ of GH3 or GH3-FTY cells were plated in each well of 96-well plates, and cell numbers at 0, 24, and 48 h were evaluated using a Cell Counting Kit-8 (Dojindo, Kumamoto, Japan).
The BrdU assay was performed using the BrdU Cell Proliferation ELISA Kit (Abcam, Cambridge, UK). A total of 1×10⁴ cells were plated in each well of 96-well plates and cultured for 24 h, with BrdU incorporated for the final 2 h. The assay was performed according to the manufacturer’s protocol.
Histological analysis
Hematoxylin-eosin (HE) staining and immunostaining were performed as described previously [23]. Microscopic observation was carried out using a Bio-REVO BZ-9000 fluorescence microscope (Keyence, Tokyo, Japan). Antibodies are described in S2 Table. Sections were counterstained with DAPI and visualized with an LSM710 inverted confocal microscope (Carl Zeiss, Tokyo, Japan).
Gh measurement
A total of 2×10⁵ cells were plated into each well of 24-well plates and cultured in 1ml of F-12K medium containing 15% horse serum and 2.5% fetal bovine serum (FBS). Both horse serum and FBS were used after the treatment with dextran-coated charcoal (Sigma-Aldrich). After 24 h culture, the Gh concentration of the medium was measured by a Growth Hormone, Rat, EIA Kit (Bertin Pharma, Paris, France) and calibrated by RNA content. Total RNA was extracted and its content was determined by absorbance at 260 nm.
Cell cycle analysis
Cell cycle profiles were analyzed by flow cytometry [24]. Cell nuclei were stained with a Cycletest plus DNA reagent kit (BD Biosciences, Tokyo, Japan), and propidium iodide fluorescence was acquired using FACSVerse (BD Biosciences).
Analysis of GH3 or GH3-FTY xenografts
All animal protocols were approved by the Animal Care and Use Committee of Fukuoka University (approval number: 1501799). Male BALB/c-nu mice (Charles River Laboratories, Inc., Yokohama, Japan) were maintained on a 12-h light, 12-h dark cycle and given free access to water and a normal diet (Kyudou Co., Tosu, Japan). GH3 or GH3-FTY cells (5 × 10⁵) in 0.5 ml of F-12K medium were subcutaneously inoculated into the posterior flank region of 5-week-old mice (n = 8). Control mice were inoculated with 0.5 ml of F-12K medium only (n = 5). During the experimental procedure, mice were monitored and weighed twice a week. Four or eight weeks after inoculation, the mouse longitudinal length was measured using a Skyscan1178 CT scan for small animals (Bruker Corporation, Billerica, MA) under anesthesia which was achieved by an intraperitoneal injection of pentobarbital (30–40 mg/kg). Mice were sacrificed under isoflurane inhalation anesthesia at 8 weeks, and tumors, livers, and plasma were collected. The tumor volume was calculated as length × width squared × 0.52, as previously reported [25]. The plasma concentration of Gh was measured by the Growth Hormone, Rat, EIA Kit (Bertin Pharma). Igf-1 was measured by a Quantikine ELISA mouse/rat IGF-1 kit (R&D systems, Minneapolis, MN).
To evaluate glucose metabolism, glucose tolerance testing (GTT) and insulin tolerance testing (ITT) were performed at 6 weeks. In the GTT, after 15 h fasting, 2 g/kg body weight (BW) glucose was administered by intraperitoneal injection, and blood glucose (BG) at 0, 15, 30, 60, and 120 min was measured by a Glutest Mint (Sanwa Chemistry Co., Ltd., Hiratsuka, Japan). Plasma insulin levels at 0, 15, 30, and 60 min were measured using a hypersensitive mouse insulin kit (Morinaga Institute, Inc., Yokohama, Japan). ITT was performed 7 weeks after inoculation by the intraperitoneal administration of 0.75 U/kg BW Novolin R (Novo Nordisk Pharma Ltd., Tokyo, Japan) after 3-h fasting; BG was then measured at 0, 15, 30, and 60 min.
We then repeated these experiments (n = 3 in each group) using an endpoint of 4 weeks. Tumors were therefore obtained at 4 weeks and subjected to histological analysis.
Statistical analysis
All experiments were performed at least three times; all display items are representative of the experiments. Statistical analysis was carried out using the unpaired two-tailed t-test and one-way analysis of variance (ANOVA) with Tukey’s post-hoc test as appropriate using GraphPad Prism software. All data are expressed as means ± standard error of the mean (SEM). P<0.05 was considered to be statistically significant.
Results
Intact Aip was disrupted in GH3-FTY cells
Exonic sequencing of Aip exon–intron boundaries in GH3 cells revealed complete homology with rat Aip cDNA (NM_172327.2) and no mutations were found. Screening of Aip-mutant after genome editing identified two clones that contained compound heterozygous mutations of both Aip alleles, which resulted in truncated Aip proteins. While the estimated molecular weight of 37 kDa was detected in GH3 cells containing wild-type Aip, no corresponding band was detected in clones 1 and 2 (Fig 1A). Despite the genetic disruption of Aip and the complete disappearance of Aip protein, the two clones did not show the same phenotype with respect to Gh and Prl synthesis, as determined by qPCR (Fig 1B and 1C). This is probably because of the heterogeneous population of GH3 cells, as reported in previous studies [20, 26].
Fig 1. Screening of Aip-disrupted GH3 clones generated by CRISPR/Cas9.
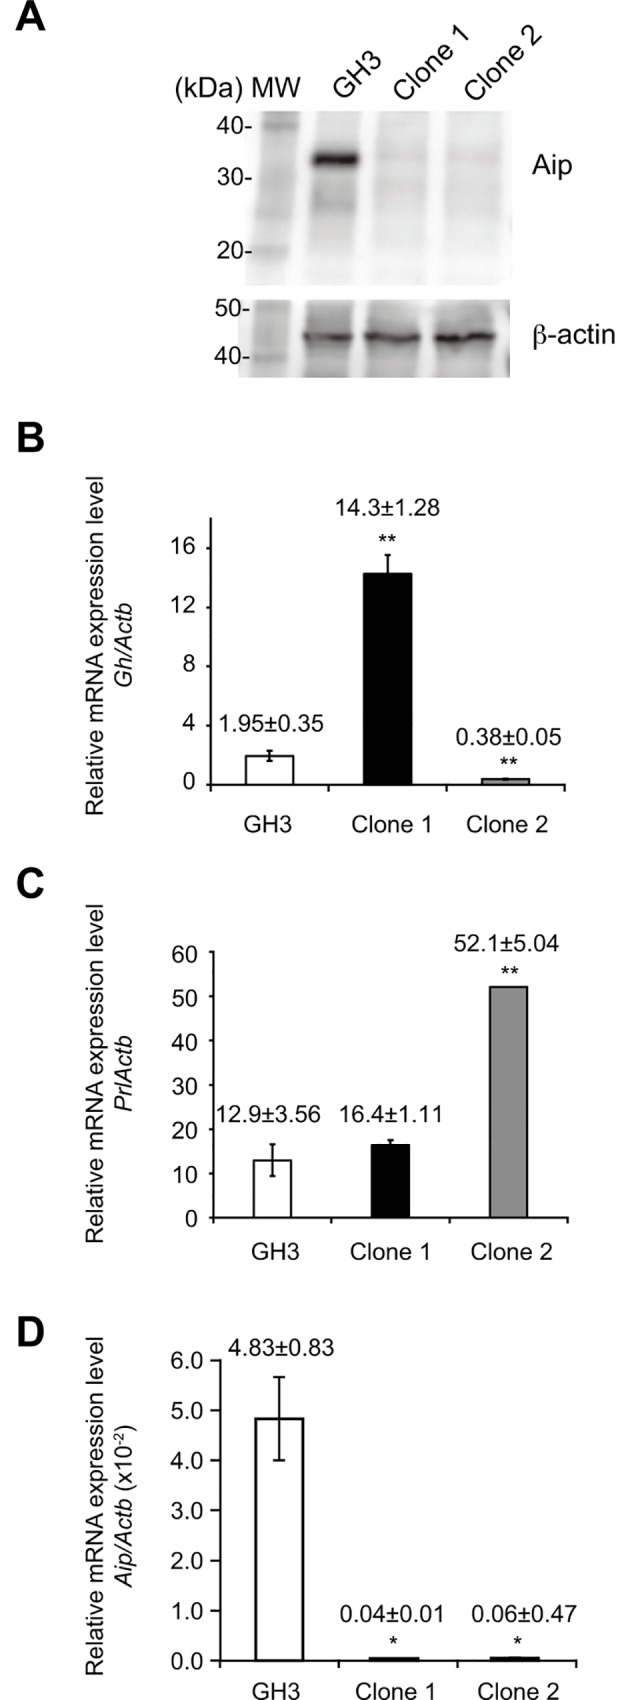
The detailed mutations of clones 1 and 2 are described in the Results section and S1 Fig. Clone 1 corresponds to GH3-FTY cells intensively investigated in the present study. (A) Western blot analysis of Aip protein in GH3 and mutant GH3 clones (clones 1 and 2). Fifteen μg of protein from cell lysates was subjected to SDS-PAGE and immunoblotted with antibodies against Aip and beta-actin. Each target protein was visualized using VersaDoc 5000 (BIO-RAD, Tokyo, Japan). (B, C) The relative expression of Gh mRNA and Prl mRNA to Actb mRNA is shown, respectively. Data were compared using the unpaired two-tailed t-test. **P<0.01 (clone 1 or 2) vs GH3. (D) The relative expression of Aip mRNA to Actb mRNA in cultured clone 1 (GH3-FTY cells) and clone 2 is shown. Data were compared using the unpaired two-tailed t-test. * P<0.05 (clone 1 or 2) vs GH3.
Of the two Aip-disrupted GH3 clones, only one (clone 1), termed GH3-FTY, showed a 7.3-fold increase in Gh synthesis but only a 1.3-fold increase in Prl synthesis compared with GH3 cells, indicating that clone 1 corresponds to a somatotroph cell line. However, clone 2 showed relatively higher levels (4.0-fold) of Prl synthesis than GH3 cells, while Gh synthesis was only 0.2-fold that of GH3 cells, indicating that this clone was more representative of a lactotroph cell line. Interestingly, relative mRNA expression levels of mutant Aip in GH3-FTY cells (clone 1) and clone 2 were extremely low compared with that of GH3 cells (P = 0.0098 and P = 0.010, respectively) (Fig 1D), suggesting that the stability of Aip mRNAs derived from these two clones is also decreased. In subsequent studies, we only focused on the characterization of clone 1 (GH3-FTY). Characterization of clone 2 will be reported in the future.
The Aip sequence and the amino acid sequence of clone 1 (GH3-FTY) are shown in S1A Fig. GH3-FTY contained compound heterozygous frameshift mutations in the form of an adenine insertion at c.496 and adenine and guanine deletions at c.496-497, causing premature stop codons at codons 173 and 172, respectively (S1A Fig). The predicted truncated Aip proteins completely lacked TPR domains (S1B Fig). Clone 2 contained compound heterozygous mutations of an adenine insertion at c.496 (as observed in clone 1) in one allele and a deletion of guanine at c.497 in the other allele (data not shown).
GH3-FTY cells showed dramatic Gh secretion levels compared with GH3 cells
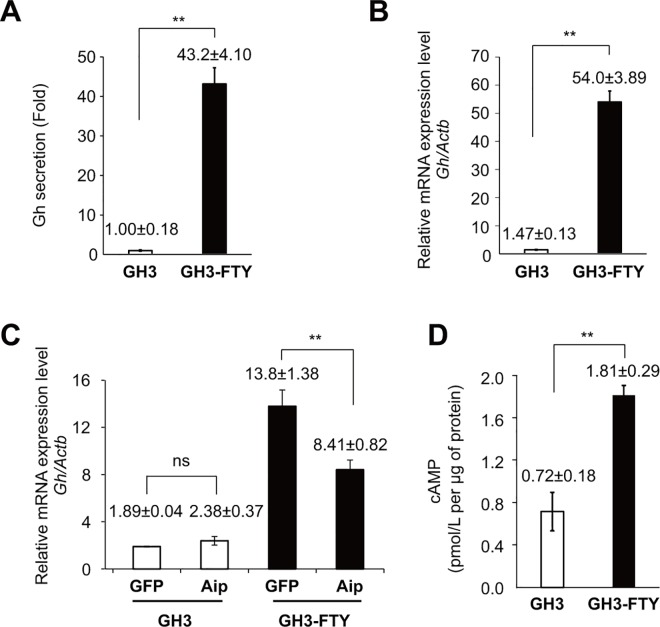
GH3-FTY cells showed 20–43-fold stronger Gh secretion levels than GH3 cells. Fig 2A shows a typical example (P = 0.0024). Gh mRNA levels in GH3-FTY cells were 7.3–36.7-fold higher than in GH3. Fig 2B shows a typical example (P = 0.0018). The increase in Gh mRNA expression of GH3-FTY cells was significantly suppressed by lentivirus (LV)-mediated exogenous Aip expression (P = 0.0082), while the level of Gh mRNA in GH3 cells was unchanged by the same treatment, suggesting that the endogenous Aip function is specifically disrupted in GH3-FTY cells (Fig 2C). cAMP levels in GH3-FTY cells were significantly higher than in GH3 cells (Fig 2D).
Fig 2. Gh secretion in the cultured medium, Gh mRNA levels before and after exogenous Aip expression, and intracellular cAMP content in cultured GH3 and GH3-FTY cells.
(A) Gh secretion in the media from cultured GH3 and GH3-FTY cells was measured and expressed as a fold increase. (B) Gh mRNA levels in cultured GH3 and GH3-GTY cells were calculated relative to Actb (internal control) using the ∆Ct method. (C) The effect of lentivirus (LV)-mediated forced expression of exogenous gfp as a control or Aip on Gh mRNA levels. GFP and Aip indicate LV-GFP and LV-Aip, respectively. (D) The intracellular cAMP content of both cultured cells was measured as described in the Methods. Data were compared using the unpaired two-tailed t-test. **P<0.01. ns, not significant.
GH3-FTY cells showed increased proliferation in culture
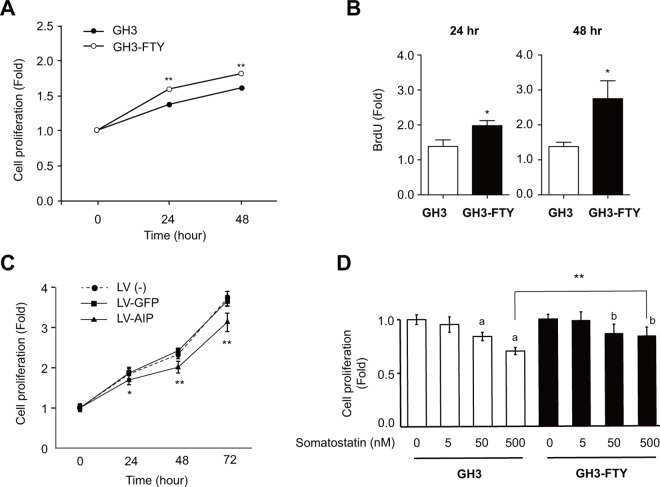
The proliferation of cultured GH3 and GH-FTY cells as determined by a cell counting kit is shown in Fig 3A. The proliferation rate of GH3-FTY cells was not exceptional but was significantly increased compared with parental GH3 cells after 24 and 48 h (P = 0.00036 and P = 0.00066, respectively). This was also confirmed by a BrdU assay at 24 and 48 h (P = 0.0294 and P = 0.0271, respectively) (Fig 3B). Cell cycle analysis revealed that GH3-FTY cells showed an increased S phase relative to GH3 cells in the presence or absence of serum stimulation, although was slightly more evident in the absence of serum (Table 1). The sub-G1 fraction, namely the apoptotic cell fraction, was not observed under any conditions in GH3 and GH3-FTY cells. Importantly, the increased cell proliferation of GH3-FTY was significantly reversed by LV-mediated exogenous Aip expression, while it was unchanged by LV-mediated GFP expression (Fig 3C). Somatostatin dose-dependently suppressed the proliferation of GH3 and GH3-FTY cells. However, GH3-FTY cells were less sensitive to somatostatin than GH3 cells (Fig 3D).
Fig 3. Proliferation of GH3-FTY versus GH3 cells.
(A) The numbers of cultured GH3 and GH3-FTY cells at 24 h and 48 h were compared by the cell counting kit. The value at each time point was calibrated by the cell numbers at the start of the experiment (0 h). Data were compared using the unpaired two-tailed t-test. *P<0.05. ns, not significant. (B) BrdU assay at 24 h and 48 h. Data were compared using the unpaired two-tailed t-test. *P<0.05. (C) Effect of lentivirus (LV)-mediated forced expression of exogenous Aip (LV-AIP) or gfp (LV-GFP) as a control on the proliferation of cultured GH3-FTY cells. LV (-) indicates GH3-FTY cells uninfected with lentivirus. Statistical significance was observed only between LV-GFP and LV-Aip (*P<0.05; **P<0.01), but not between LV (-) and LV-GFP. ns, not significant. (D) Sensitivity to somatostatin (0–500 nM) was compared between cultured GH3 and GH3-FTY cells. Data were compared using the unpaired two-tailed t-test. **P<0.01, 500 nM somatostatin-treated GH3-FTY vs 500 nM somatostatin-treated GH3. a P<0.01 vs 0 nM somatostatin-treated GH3. bP<0.01 vs 0 nM somatostatin-treated GH3-FTY.
Table 1. Cell cycle analyses of GH3 and GH3-FTY in the presence or absence of serum.
| cell | serum | G0/G1 (%) | S (%) | G2/M (%) |
|---|---|---|---|---|
| GH3 | + | 59.0 | 29.0 | 9.58 |
| GH3 | - | 84.6 | 17.7 | 13.8 |
| GH3-FTY | + | 47.0 | 34.7 | 10.5 |
| GH3-FTY | - | 58.0 | 25.9 | 12.2 |
Cells were pre-cultured in medium without serum for 24 h and then either cultured in medium containing serum for another 24 h or cultured in serum-free medium for 48 h. Propidium iodide fluorescence levels of 2×10⁴ events were acquired using a flow cytometer. G0/G1, S, and G2/M fractions were calculated from the resulting cell cycle profile using FlowJo (TOMY Digital Biology Co., Ltd., Tokyo, Japan).
GH3-FTY cells showed increased phosphorylation of Stat3 (Tyr705)
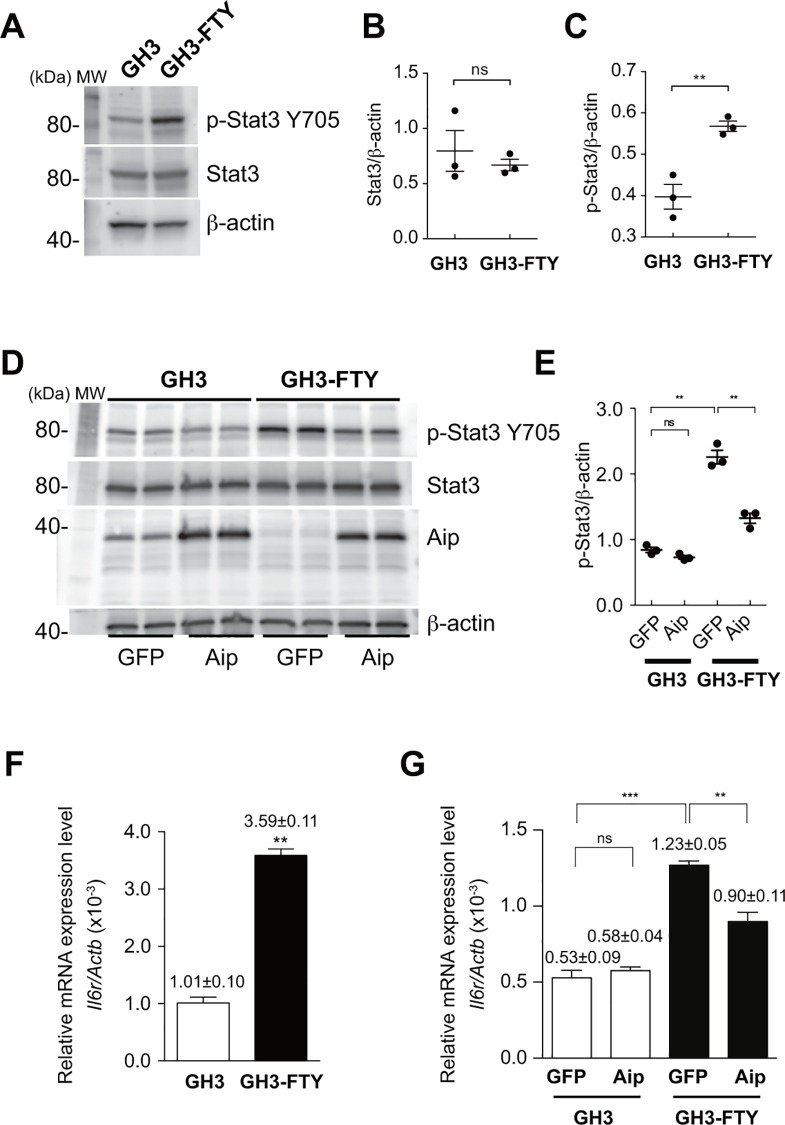
With regards to the mechanism of increased Gh secretion, we investigated the involvement of Stat3 using Western blot analysis. As shown in Fig 4A and 4B, the expression of Stat3 was unchanged between GH3 and GH3-FTY cells. However, p-Stat3 was significantly increased in GH3-FTY compared with GH3 cells (P = 0.0062) (Fig 4A and 4C). Importantly, the upregulation of p-Stat3 in GH3-FTY cells was reversed by LV-mediated forced expression of Aip (P = 0.0019) (Fig 4D and 4E). To investigate whether Aip and p-Stat3 or Stat3 form protein complex, we performed immunoprecipitation assay. Neither of the cell lysates from GH3 or GH3-FTY cells immunoprecipitated with an anti-Aip antibody could be coprecipitated with anti-p-Stat3 or anti-Stat3 antibodies. Additionally, neither of the cell lysates from GH3 or GH3-FTY cells immunoprecipitated with anti-p-Stat3 or Stat3 antibodies could be coprecipitated with an anti-Aip antibody. These results suggest that Aip does not form a complex with p-Stat3 or Stat3 (data not shown). Next, the mRNA expression of interleukin 6 receptor (Il6r), an upstream receptor of Stat3, was examined by qPCR. Interestingly, Il6r mRNA was found to be upregulated in GH3-FTY cells compared with GH3 cells (P<0.0001) (Fig 4F), and this increase was significantly reversed by the LV-mediated forced expression of Aip (P = 0.0053) (Fig 4G).
Fig 4. Western blot analysis of p-Stat3 (Tyr705) and Stat3 in cultured GH3 and GH3-FTY cells.
(A) Western blot analysis of p-Stat3 (Tyr705) and Stat3. Twenty μg protein from cell lysates was separated by SDS-PAGE and immunoblotted with antibodies against p-Stat3, Stat3, and beta-actin. (B) Statistical evaluation of Stat3/ beta-actin expression between cultured GH3 and GH3-FTY cells. Data were compared using the unpaired two-tailed t-test. ns, not significant. The intensity of each detected band was analyzed using the image analysis software Quantity One (BIO-RAD), and the Stat3/ beta-actin ratio was calculated. (C) Statistical evaluation of p-Stat3/ beta-actin expression between cultured GH3 and GH3-FTY cells. Data were compared using the unpaired two-tailed t-test. **P<0.01. (D) Western blot analysis of p-Stat3 and Stat3. The effect of lentivirus (LV)-mediated forced expression of exogenous Aip (LV-AIP) or gfp (LV-GFP) as a control on p-Stat3 expression was examined. Twenty μg protein from cell lysates was subjected to SDS-PAGE and immunoblotted with antibodies against p-Stat3 and beta-actin. (E) Statistical evaluation of p-Stat3. GFP and Aip indicate LV-GFP and LV-Aip, respectively. Data were compared using the unpaired two-tailed t-test. **P<0.01. ns, not significant. (F) Il6r mRNA levels relative to Actb mRNA levels as determined by qPCR. (G) Il6r mRNA levels relative to Actb mRNA levels as determined by qPCR before and after lentivirus (LV)-mediated exogenous expression of Aip (LV-Aip) or gfp (LV-GFP) as a control. GFP and Aip indicate LV-GFP and LV-Aip, respectively. Data were compared using the unpaired two-tailed t-test. *P<0.05, **P<0.01. ns, not significant.
GH3-FTY cells showed less sensitivity to somatostatin in association with decreased expression of somatostatin receptor 2 (Sstr2) and Zac1
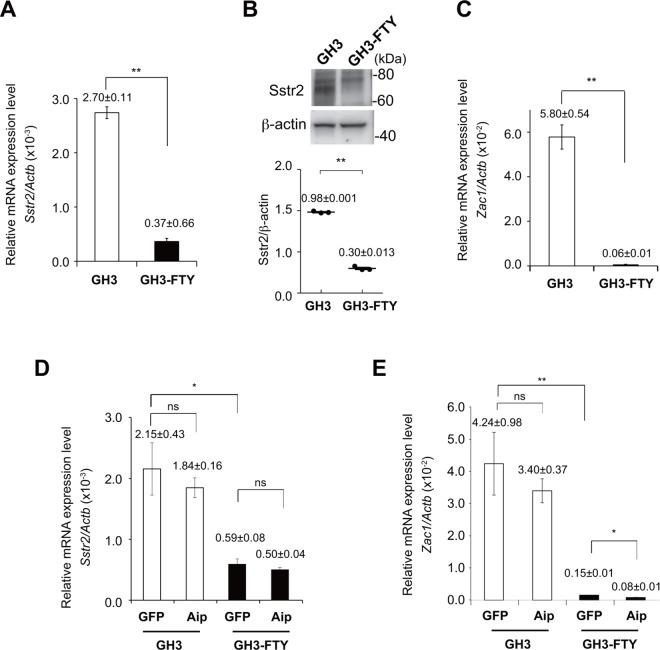
As shown in Fig 3D, GH3-FTY cells were less sensitive to somatostatin as a suppressor of cell proliferation than GH3 cells. This was supported by findings that Sstr2 expression levels were dramatically decreased in GH3-FTY cells compared with GH3 cells at both mRNA and protein levels (P<0.0001 and P<0.0001, respectively) (Fig 5A and 5B). In relation to Aip function, the mRNA expression levels of Zac1, a possible inhibitory factor of GH secretion and cell proliferation [27], was significantly decreased in GH3-FTY cells compared with GH3 cells (P = 0.0015) (Fig 5C). However, the decrease in mRNA levels of Sstr2 and Zac1 was not reversed by LV-mediated exogenous expression of Aip (Fig 5D and 5E).
Fig 5. Comparison of Sstr2, and Zac1 mRNA expression and Sstr2 expression levels by western blot in cultured GH3 and GH3-FTY cells.
(A) Sstr2 mRNA levels relative to Actb mRNA levels as determined by qPCR. (B) Western blot analysis of Sstr2 and beta-actin in cultured GH3 and GH3-FTY cells. Twenty μg protein from cell lysates was separated by SDS-PAGE and immunoblotted with antibodies against Sstr2 and beta-actin (upper panel). Statistical evaluation of Sstr2/ beta-actin expression between cultured GH3 cells and GH3-FTY cells (lower panel). (C) Zac1 mRNA levels relative to Actb mRNA levels as determined by qPCR. (D) Sstr2 mRNA levels relative to Actb mRNA levels as determined by qPCR after lentivirus (LV)-mediated exogenous expression of Aip (LV-Aip) or gfp (LV-GFP) as a control. GFP and Aip indicate LV-GFP and LV-Aip, respectively. (E) Zac1 mRNA levels relative to Actb mRNA levels as determined by qPCR after lentivirus (LV)-mediated exogenous expression of Aip (LV-Aip) or gfp (LV-GFP) as a control. GFP and Aip indicate LV-GFP and LV-Aip, respectively. Data were compared using the unpaired two-tailed t-test. *P<0.05, **P<0.01. ns, not significant.
GH3-FTY xenografts formed more anaplastic tumors than GH3 xenografts
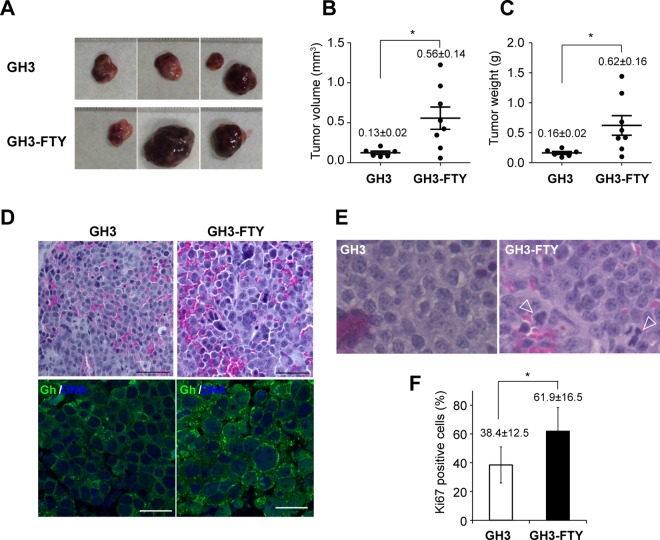
Xenografts of GH3-FTY cells and GH3 cells formed tumors at the position of cell inoculation in nude mice (Fig 6A). Eight weeks after inoculation, the average tumor volume of GH3-FTY xenografts (GH3-FTY mice) was 4.31-fold larger than that of GH3 xenografts (GH3 mice) (P = 0.0215) (Fig 6B). The average tumor weight of GH3-FTY mice was 3.88-fold larger than that of GH3 mice (P = 0.0331) (Fig 6C). HE staining at 4 weeks revealed that tumors in GH3-FTY mice showed more mitotic features than those in GH3 mice in that GH3-FTY mouse tumors were comprised of cells showing a relatively larger nuclear/cytoplasm (N/C) ratio with anisonucleosis (upper panels in Fig 6D). Immunostaining of Gh and DAPI staining of tumor nuclei from GH3-FTY mice at 4 weeks supported these findings. Additionally, Gh was predominantly stained in secretory vesicles, and this staining was more apparent in GH3-FTY cells compared with GH3 cells (lower panels in Fig 6D). Mitotic features in tumors from GH3-FTY mice at 8 weeks after inoculation were less obvious because of the increased level of necrosis (data not shown). Abnormal mitosis was frequently observed in the tumors of GH3-FTY mice compared with those of GH3 mice (Fig 6E). In accordance with these findings, GH3-FTY mouse tumors showed significantly increased Ki67 scores compared with those in GH3 mice (P = 0.0084) (Fig 6F).
Fig 6. Analysis of tumors in GH3 or GH3-FTY-xenografted mice.
(A) Actual appearance of tumors removed from control mice, GH3 mice, and GH3-FTY mice. (B) Tumor volume and (C) tumor weight 8 weeks after inoculation. Data were compared using the two-tailed unpaired t-test. *P<0.05. (D) Typical tissue histology of somatotroph cell tumors in GH3 or GH3-FTY mice by HE staining (upper two panels) and immunohistochemical analysis (lower two panels) at 4 weeks. Bar, 50 μm. Staining of Gh (green) and nucleus (DAPI, blue) was observed using confocal microscopy. A larger N/C ratio and anisonucleosis in GH3-FTY cells relative to GH3 cells were observed. More prominent Gh vesicles were observed in GH3-FTY compared with GH3 mice. Bar, 20 μm. (E) Typical tissue histology of tumors in GH3 and GH3-FTY mice by HE staining at 8 weeks. Arrowheads indicate abnormal mitotic cells. (F) Ki67 scores of both tumors were statistically compared. Data were compared using the two-tailed unpaired t-test. *P<0.05.
GH3-FTY mice show a larger size and higher Gh secretion compared with GH3 mice
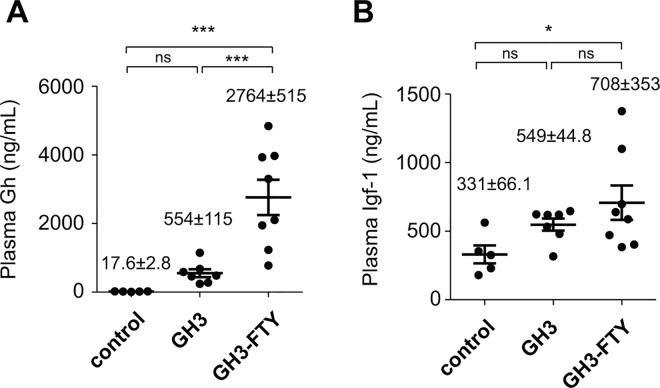
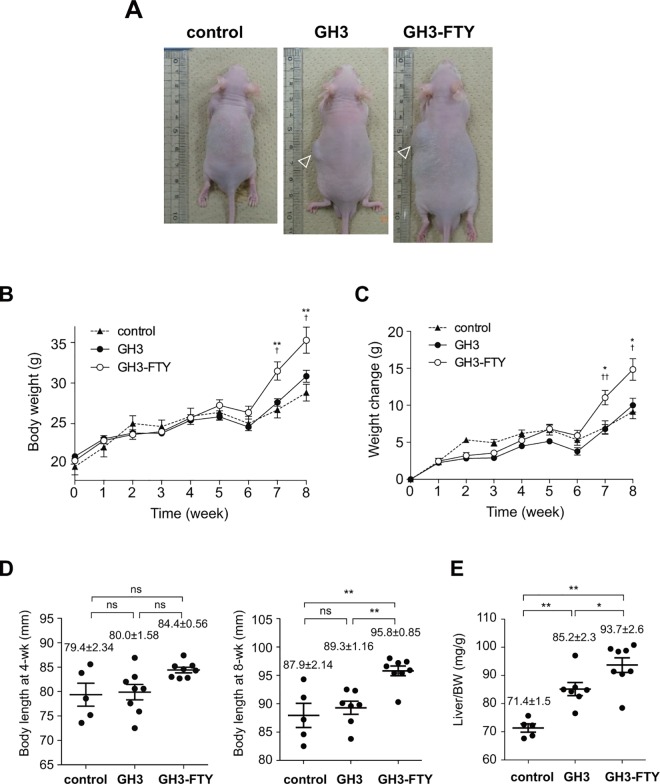
Eight weeks after inoculation, several phenotypic differences between GH3 and GH3-FTY mice were compared. Plasma Gh levels were 554±115 ng/mL (n = 7) and 2764±515 ng/mL (n = 8), respectively, which were both higher than Gh levels in control mice (17.6±2.8 ng/mL) (n = 5). The plasma Gh level in GH3-FTY mice was significantly higher than that of GH3 mice (P<0.0001) (Fig 7A). Plasma Igf-1 levels at 8 weeks were 549±44.8 ng/mL (n = 7) and 708±353 ng/mL (n = 8), respectively (Fig 7B). Although plasma Igf-1 levels of GH3-FTY mice were significantly higher than those of control mice (P<0.05), they were not significantly different between GH3 and GH3-FTY mice. GH3-FTY mice were larger than GH3 and control mice (Fig 8A). Body weights are shown in Fig 8B; average weights of control, GH3, and GH3-FTY mice at 8 weeks after inoculation were 28.8±2.3 g (n = 5), 30.8±3.0 g (n = 7), and 35.3±5.3 g (n = 8), respectively (P<0.05, GH3-FTY vs. control or GH3). No significant difference was observed between control and GH3 mice, while GH3-FTY mice were significantly heavier from 7 weeks after inoculation than both control and GH3 mice. Weight changes of GH3-FTY mice were significantly increased compared with control and GH3 mice after 7 week from inoculation, and the average weight changes of control, GH3, and GH3-FTY mice at 8 weeks after inoculation were 9.12.8±0.93 g (n = 5), 10.0±0.94 g (n = 7), and 14.8±1.45 g (n = 8), respectively (P<0.05, GH3-FTY vs. control or GH3) (Fig 8C). Longitudinal lengths at 8 weeks after the xenograft injection in control, GH3, and GH3-FTY mice were 87.9±2.1 mm (n = 5), 89.3±1.2 mm (n = 7), and 95.8±0.9 mm, (n = 8) respectively (P<0.01, GH3-FTY vs. control or GH3) (Fig 8D). No significant difference between control and GH3 mice was observed (Fig 8D). Liver weights (mg/gBW) of GH3-FTY at 8 weeks (n = 8) were also increased compared with those of control (n = 5) (P<0.0001) and GH3 mice (n = 7) (P<0.05) (Fig 8E).
Fig 7. Plasma Gh and Igf-1 levels in GH3 and GH3-FTY mice.
BALB/c-nu mice were inoculated with GH3 or GH3-FTY cells. Control mice were inoculated by the medium only. Plasma levels of Gh (A) and Igf-1 (B) at 8 weeks after inoculation. Data were compared using the one-way ANOVA with Tukey’s post-hoc test. *P<0.05, ***P<0.001. ns, not significant.
Fig 8. Body weight, weight change, body length, and liver weight in GH3 and GH3-FTY mice.
(A) Actual appearance of control, GH3, and GH3-FTY mice. Arrowheads indicate xenograft tumor. (B) Time course of body weight changes. A significant difference between GH3-FTY and control mice was observed from 7 weeks after inoculation. No significant difference was observed between GH3 and control mice during the observation period. Statistical comparison of changes in body weight (C), body length (D), and liver weight (E) in control, GH3, and GH3-FTY mice. Data were compared using the one-way ANOVA with Tukey’s post-hoc test. *P<0.05, **P<0.01 vs control. †P<0.05, ††P<0.01 vs GH3. ns, not significant.
GH3-FTY mice showed stronger insulin resistance compared with GH3 mice
To compare the biological effect of GH3 and GH3-FTY on glucose metabolism, GTT and ITT were performed (Fig 9). In GTTs performed 6 weeks after the xenograft, BG levels in GH3 and GH3-FTY mice at 0, and 30 min were significantly decreased compared with those of control mice (P<0.05). No significant differences in BG levels between GH3 and GH3-FTY mice were evident at any time point and there was no significant difference in the area under the curve (AUC) (Fig 9A and 9B). Insulin levels at 0 min were significantly increased in GH3 and GH3-FTY mice compared with controls (P<0.01). Furthermore, insulin levels in GH3-FTY mice at 15, 30 and 60 min, as well as the AUC, were significantly increased compared with control mice (P<0.05) (Fig 9C and 9D). However, insulin levels at 15, 30 and 60 min, as well as the AUC between GH3 and GH3-FTY mice were not significantly different. GH3-FTY mice showed higher tendency of glucose levels than control or GH3 mice in an ITT performed 7 weeks after inoculation. However, the difference was not statistically significant (P = 0.00694, 0.0802 and 0.4038 at 15, 30 and 60 min, respectively) (Fig 9E).
Fig 9. Glucose metabolism of control, GH3, and GH3-FTY mice after xenograft inoculation.
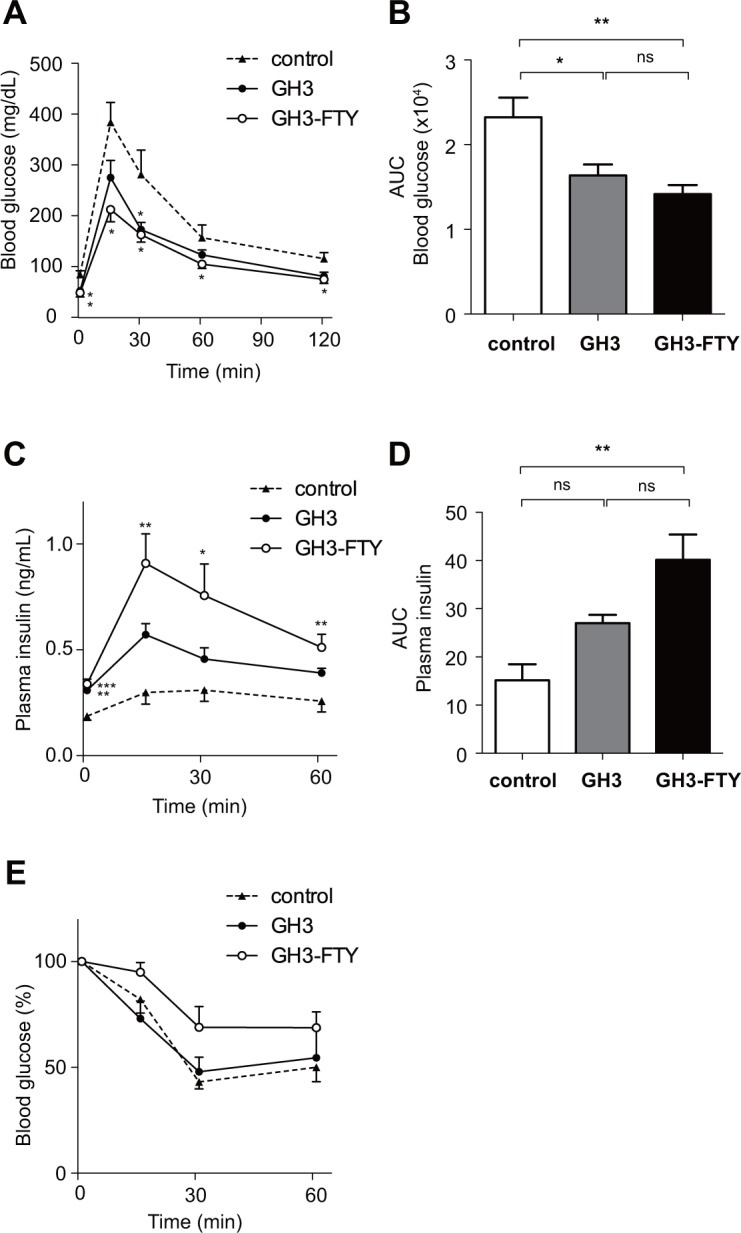
Six weeks after xenograft inoculation, GTT was performed. Changes in BG levels (A), AUC of blood glucose (B), plasma insulin levels (C), and AUC of plasma insulin levels (D). (E) Seven weeks after inoculation, ITT was performed. Data were compared using the one-way ANOVA with Tukey’s post-hoc test. *P<0.05, **P<0.01 between GH3 or GH3-FTY and control mice. ns, no significant change.
Discussion
In this study, we used the CRISPR/Cas9 system to generate a new cell line from GH3 cells, which lacked functional Aip and which we named GH3-FTY cells. This cell line showed dramatically increased (20–43-fold) Gh secretion compared with GH3 cells. The fluctuating and unstable secretion of basal Gh and varied Gh/Prl secretion ratio from cultured GH3 cells, even from the same ATCC lot, has been previously reported [26]. This is thought to be partly because GH3 cells are not a homogeneous cell clone [20, 26]. Even though such an unstable nature of GH3 cells was reflected to some extent in our results, the tremendous capability of Gh secretion from GH3-FTY cells over GH3 cells far exceeds the previously reported variable levels in GH3 cells (around 2–6 times) [26] and caused more potent stable biological activity in the xenograft model. Because GH3-FTY cells were cloned from a single GH3 cell after genome editing, they appear to be a real homogeneous cell clone.
The proliferative capability of GH3-FTY cells did not differ greatly from that of parental GH3 cells, but the increased DNA synthesis of GH3-FTY relative to GH3 cells was supported by the BrdU assay and the finding of an increased S phase relative to G1 phase in cell cycle analysis. The enhanced Gh production from cultured GH3-FTY cells relative to GH3 cells might promote the increase in S phase even in the absence of serum. Importantly, forced expression of Aip using the lentivirus system in cultured GH3-FTY cells partially reversed the increased Gh mRNA expression and almost completely reversed the changes in cell proliferation and the cell cycle profile. While the exact reason for partial reversibility in increased Gh synthesis remains unclear, it may reflect the insufficient expression levels of exogenous Aip or the heterogeneous or fluctuating capability of Gh synthesis of the parental GH3 cell line. Nevertheless, our results indicate that complete loss of Aip function in Gh-producing cells leads to increased Gh secretion and cell proliferation. Homozygous Aip-knockout in mice is lethal, thus making it difficult to confirm endogenous Aip function in vivo, although Aip-knockout mouse embryonic fibroblasts (MEFs) are available [13]. However, our cell line is the first demonstration of an Aip-knockout pituitary cell line. The increased cAMP production in GH3-FTY compared with GH3 cells appears to be involved in the observed Gh secretion, as evidenced by a previous report showing increased cAMP production in Aip-knockout MEFs or Aip-silenced GH3 cells [13].
The type I cytokine receptor family including the IL-6 receptor activates Janus kinase 2 upon ligand binding, which in turn activates Stat3 by phosphorylating Tyr705. Activated Stat3 (p-Stat3) undergoes homodimerization and nuclear translocation, and eventually leads to transcriptional regulation of target genes to modulate cell proliferation, survival, and differentiation [28]. In a recent report, the upregulation of Stat3 in pituitary somatotroph adenomas was reported to be associated with GH hypersecretion [29]. In this study, GH induced Stat3 phosphorylation in GH3 cells, suggesting an autoregulatory positive-feedback loop between Stat3 and GH in somatotroph tumor cells [29]. However, the involvement of Aip in this phenomenon has not been clarified. Interestingly, we revealed that despite the stable level of Stat3, p-Stat3 in GH3-FTY cells lacking Aip was significantly increased compared with GH3 cells. Additionally, the forced expression of Aip partially but clearly reversed the phenomenon. A complex formation of Aip and p-Stat 3 was not observed by immunoprecipitation assay, suggesting an indirect functional association between these proteins. Anyway these results suggest that the activation of Stat3 in GH3 cells is, at least partially, mediated by Aip. Thus, the autoregulatory positive loop between Stat3 and Gh may be more potentiated in GH3-FTY than in GH3 cells, resulting in the enormous production of Gh. Moreover, because Il6r mRNA expression was also increased in GH3-FTY cells, the above positive loop might be further augmented in some inflammatory situations in vivo.
GH3-FTY cells were less sensitive to somatostatin than GH3 cells. This may be partly explained by the reduced expression of Sstr2 in GH3-FTY cells. The antiproliferative effect of the somatostatin analog octreotide was suggested to be associated with the upregulation of ZAC1 expression [15], which was shown to correlate with the IGF-I response and tumor shrinkage [27]. Pituitary tumors with reduced AIP expression are reported to be frequently resistant to first-generation somatostatin analogs [9, 14]. However, it is not clear whether the reduced expression of AIP is associated with functional AIP inactivation. Furthermore, it is also not clear whether AIP inactivation is associated with decreased SSTR2 expression. In the present study, GH3-FTY cells showed reduced expression of Sstr2 as well as Zac1 compared with GH3 cells, suggesting an association with Aip inactivation, as previously reported [9, 14, 15]. However, contrary to our prediction, the reduced expression of these mRNAs was not reversed by the exogenous expression of Aip. Thus, at least in our study, the direct association between Aip and Sstr2 or Zac1 seems to be unlikely. One alternative explanation is that levels of Sstr2 and Zac1 might be regulated by upstream molecules of Aip. We also cannot exclude the possibility that the low expression levels of Sstr2 and Zac1 are original characteristics of GH3-FTY cells which are unrelated to Aip inactivation. An inconsistent association between SSTR2 and AIP was clinically suggested from the finding that SSTR2 staining was not always reduced in pituitary somatotroph adenomas regardless of the presence or absence of Aip mutations [14]. We should also keep in mind that the antiproliferative effects of somatostatin can occur via Sstr2 through other pathways such as PI3k/Akt signaling [15], the MAPK cascade, activating tyrosine/serine phosphatases, and inhibiting adenylate cyclase activity [30–32] or even indirectly through reducing the release of growth-promoting factors such as IGF-I [33].
The biological function of the GH3-FTY cell line was determined in vivo by xenograft transplantation to nude mice. GH promotes body growth including that of the liver via STAT5b-mediated signaling [33]. Despite the increase in Gh secretion in GH-FTY compared with GH3 mice (~5-fold), body weight was significantly increased from 46 days after inoculation compared with control or GH3 mice. GH3 mice showed no such increase in body weight compared with controls during the observation period. The higher values of body length and liver weight in GH3-FTY mice compared with GH3 mice were confirmed at 8 weeks. It is likely that it takes time for various organs to become enlarged when we consider the observation of only a slight increase in the proliferation of GH3-FTY compared with GH3 cells.
The stronger biological functions of GH3-FTY mice over control mice were also confirmed in the evaluation of glucose metabolism. However, the difference in glucose metabolism was statistically not evident between GH3-FTY mice and GH3 mice. While the glucose tolerance in GTT performed at 6 weeks was almost equivalent between the two mice models, hyperinsulinemia in GTT or insulin resistance in ITT of GH3-FTY mice tended to be stronger than those of GH3. These results may reflect a time-dependent change in glucose tolerance associated with insulin resistance caused by Gh oversecretion. The simultaneous hypersecretion of Igf-1 may also modify the glucose tolerance by improving insulin sensitivity. These two mice models will be very useful in investigating the developmental process from insulin resistance to diabetes by GH oversecretion [34, 35].
The average tumor size of GH3-FTY mice was larger than that of GH3 mice, which may reflect the increased proliferative capability of GH3-FTY cells. Another possibility is the autocrine stimulation of the tumor by Gh, resulting in increased Igf-1 secretion in the circulation. Importantly, xenografted GH3-FTY somatotroph tumors showed more mitotic features than xenografted GH3 tumors, including a relatively larger N/C ratio, anisonucleosis, a more frequent occurrence of abnormal mitosis, and an increased Ki67 score. Such changes may be related to the continuous oversecretion of Gh on tumorigenesis, because Gh–IGF-1 promotion of cell proliferation is predominantly mediated by the MAPK pathway and stimulation of the antiapoptotic pathway [36]. Moreover, the disruption of Aip itself is reported to be associated with the oncogenic characteristic of GH3-FTY cells [3, 10–13]. Indeed, AIP expression was documented in invasive somatotropinoma tumors compared with noninvasive tumors [37].
In conclusion, we established the first known somatotroph cell line, GH3-FTY, in which endogenous Aip was completely disrupted using the CRISPR/Cas9 system. Aip inactivation promoted the overproduction of Gh in this cell line, probably through increased Stat3 activation compared with parental GH3 cells. GH3-FTY cells may be a useful model to demonstrate how Aip inactivation promotes somatotroph tumorigenesis and autonomous GH secretion. This cell line may also be useful for the screening of innovative drugs for acromegaly.
Supporting Information
(A) Nucleotide sequence of normal (wild-type) and mutant Aip exon 4 in GH3-FTY cells. GH3-FTY cells contained heterozygous mutants of an adenine insertion at c.496 and a two base deletion at c.496-497, causing premature stop codons at codon 173 (TGA) and codon 172 (TGA), respectively, in both Aip alleles. (B) Schematic of wild-type and mutant Aip structures found in GH3 cells.
(PDF)
Primers 1–6 were used to amplify Aip. Primers 7–13 were used for qPCR to determine the mRNA expression levels of respective genes.
(PDF)
(PDF)
Acknowledgments
We thank Prof. Kazuki Nabeshima (Department of Pathology, Fukuoka University) for teaching us about the pathology of GH3-FTY tumors.
Data Availability
All relevant data are within the paper and its Supporting Information files.
Funding Statement
This research was partially supported by an Intractable Disease Research Grant from the Ministry of Health, Labour and Welfare, Japan (ID: 27070201, URL: http://www.mhlw.go.jp) (TY), and by the Forum on Growth Hormone Research Grant (2016) from the Foundation for Growth Science, Japan (TF). The Department of Bioregulatory Science of Life-related Diseases of Fukuoka University (Fukuoka, Japan) was supported financially by a donation from MSD K. K. The funders had no role in study design, data collection and analysis, decision to publish, or preparation of manuscript.
References
- 1.Vierimaa O, Georgitsi M, Lehtonen R, Vahteristo P, Kokko A, Raitila A, et al. Pituitary adenoma predisposition caused by germline mutations in the AIP gene. Science (New York, NY). 2006;312:1228–30. 10.1126/science.1126100 . [DOI] [PubMed] [Google Scholar]
- 2.Daly AF, Vanbellinghen J-F, Khoo SK, Jaffrain-Rea M-L, Naves LA, Guitelman MA, et al. Aryl hydrocarbon receptor-interacting protein gene mutations in familial isolated pituitary adenomas: analysis in 73 families. The Journal of clinical endocrinology and metabolism. 2007;92:1891–6. 10.1210/jc.2006-2513 . [DOI] [PubMed] [Google Scholar]
- 3.Leontiou Ca, Gueorguiev M, van der Spuy J, Quinton R, Lolli F, Hassan S, et al. The role of the aryl hydrocarbon receptor-interacting protein gene in familial and sporadic pituitary adenomas. The Journal of clinical endocrinology and metabolism. 2008;93:2390–401. 10.1210/jc.2007-2611 . [DOI] [PubMed] [Google Scholar]
- 4.Chahal HS, Chapple JP, Frohman LA, Grossman AB, Korbonits M. Clinical, genetic and molecular characterization of patients with familial isolated pituitary adenomas (FIPA). Trends in endocrinology and metabolism: TEM. 2010;21:419–27. 10.1016/j.tem.2010.02.007 . [DOI] [PubMed] [Google Scholar]
- 5.Cazabat L, Bouligand J, Salenave S, Bernier M, Gaillard S, Parker F, et al. Germline AIP mutations in apparently sporadic pituitary adenomas: prevalence in a prospective single-center cohort of 443 patients. The Journal of clinical endocrinology and metabolism. 2012;97:E663–70. 10.1210/jc.2011-2291 . [DOI] [PubMed] [Google Scholar]
- 6.Tichomirowa MA, Barlier A, Daly AF, Jaffrain-Rea M-L, Ronchi C, Yaneva M, et al. High prevalence of AIP gene mutations following focused screening in young patients with sporadic pituitary macroadenomas. European journal of endocrinology / European Federation of Endocrine Societies. 2011;165:509–15. 10.1530/EJE-11-0304 . [DOI] [PubMed] [Google Scholar]
- 7.Morgan RML, Hernández-Ramírez LC, Trivellin G, Zhou L, Roe SM, Korbonits M, et al. Structure of the TPR domain of AIP: lack of client protein interaction with the C-terminal α-7 helix of the TPR domain of AIP is sufficient for pituitary adenoma predisposition. PloS one. 2012;7:e53339 10.1371/journal.pone.0053339 . [DOI] [PMC free article] [PubMed] [Google Scholar]
- 8.Daly AF, Tichomirowa Ma, Petrossians P, Heliövaara E, Jaffrain-Rea M-L, Barlier A, et al. Clinical characteristics and therapeutic responses in patients with germ-line AIP mutations and pituitary adenomas: an international collaborative study. The Journal of clinical endocrinology and metabolism. 2010;95:E373–83. 10.1210/jc.2009-2556 . [DOI] [PubMed] [Google Scholar]
- 9.Iacovazzo D, Carlsen E, Lugli F, Chiloiro S, Piacentini S, Bianchi A, et al. Factors predicting pasireotide responsiveness in somatotroph pituitary adenomas resistant to first-generation somatostatin analogues: an immunohistochemical study. European journal of endocrinology / European Federation of Endocrine Societies. 2016;174:241–50. 10.1530/EJE-15-0832 . [DOI] [PubMed] [Google Scholar]
- 10.Beckers A, Aaltonen La, Daly AF, Karhu A. Familial isolated pituitary adenomas (FIPA) and the pituitary adenoma predisposition due to mutations in the aryl hydrocarbon receptor interacting protein (AIP) gene. Endocrine reviews. 2013;34:239–77. 10.1210/er.2012-1013 . [DOI] [PMC free article] [PubMed] [Google Scholar]
- 11.Formosa R, Xuereb-Anastasi A, Vassallo J. Aip regulates cAMP signalling and GH secretion in GH3 cells. Endocrine-related cancer. 2013;20:495–505. 10.1530/ERC-13-0043 . [DOI] [PubMed] [Google Scholar]
- 12.Iwata T, Yamada S, Ito J, Inoshita N, Mizusawa N, Ono S, et al. A novel C-terminal nonsense mutation, Q315X, of the aryl hydrocarbon receptor-interacting protein gene in a Japanese familial isolated pituitary adenoma family. Endocrine pathology. 2014;25(3):273–81. Epub 2014/05/03. 10.1007/s12022-014-9318-7 . [DOI] [PubMed] [Google Scholar]
- 13.Tuominen I, Heliövaara E, Raitila A, Rautiainen M-R, Mehine M, Katainen R, et al. AIP inactivation leads to pituitary tumorigenesis through defective Gαi-cAMP signaling. Oncogene. 2015;34:1174–84. 10.1038/onc.2014.50 . [DOI] [PubMed] [Google Scholar]
- 14.Chahal HS, Trivellin G, Leontiou Ca, Alband N, Fowkes RC, Tahir A, et al. Somatostatin analogs modulate AIP in somatotroph adenomas: the role of the ZAC1 pathway. The Journal of clinical endocrinology and metabolism. 2012;97:E1411–20. 10.1210/jc.2012-1111 . [DOI] [PubMed] [Google Scholar]
- 15.Theodoropoulou M, Zhang J, Laupheimer S, Paez-Pereda M, Erneux C, Florio T, et al. Octreotide, a somatostatin analogue, mediates its antiproliferative action in pituitary tumor cells by altering phosphatidylinositol 3-kinase signaling and inducing Zac1 expression. Cancer research. 2006;66:1576–82. 10.1158/0008-5472.CAN-05-1189 . [DOI] [PubMed] [Google Scholar]
- 16.Theodoropoulou M, Stalla GK, Spengler D. ZAC1 target genes and pituitary tumorigenesis. Molecular and cellular endocrinology. 2010;326:60–5. 10.1016/j.mce.2010.01.033 . [DOI] [PubMed] [Google Scholar]
- 17.Raitila A, Lehtonen HJ, Arola J, Heliövaara E, Ahlsten M, Georgitsi M, et al. Mice with inactivation of aryl hydrocarbon receptor-interacting protein (Aip) display complete penetrance of pituitary adenomas with aberrant ARNT expression. The American journal of pathology. 2010;177:1969–76. 10.2353/ajpath.2010.100138 . [DOI] [PMC free article] [PubMed] [Google Scholar]
- 18.Tashjian AH, Yasumura Y, Levine L, Sato GH, Parker ML. Establishment of clonal strains of rat pituitary tumor cells that secrete growth hormone. Endocrinology. 1968;82:342–52. 10.1210/endo-82-2-342 . [DOI] [PubMed] [Google Scholar]
- 19.Tashjian aH, Bancroft FC, Levine L. Production of both prolactin and growth hormone by clonal strains of rat pituitary tumor cells. Differential effects of hydrocortisone and tissue extracts. The Journal of cell biology. 1970;47:61–70. 10.1083/jcb.47.1.61 . [DOI] [PMC free article] [PubMed] [Google Scholar]
- 20.Boockfor FR, Hoeffler JP, Frawley LS. Cultures of GH3 cells are functionally heterogeneous: thyrotropin-releasing hormone, estradiol and cortisol cause reciprocal shifts in the proportions of growth hormone and prolactin secretors. Endocrinology. 1985;117:418–20. 10.1210/endo-117-1-418 . [DOI] [PubMed] [Google Scholar]
- 21.Cong L, Ran FA, Cox D, Lin S, Barretto R, Habib N, et al. Multiplex genome engineering using CRISPR/Cas systems. Science. 2013;339(6121):819–23. Epub 2013/01/05. 10.1126/science.1231143 [DOI] [PMC free article] [PubMed] [Google Scholar]
- 22.Tanaka T, Gondo S, Okabe T, Ohe K, Shirohzu H, Morinaga H, et al. Steroidogenic factor 1/adrenal 4 binding protein transforms human bone marrow mesenchymal cells into steroidogenic cells. J Mol Endocrinol. 2007;39(5):343–50. Epub 2007/11/03. 10.1677/JME-07-0076 . [DOI] [PubMed] [Google Scholar]
- 23.Nomiyama T, Kawanami T, Irie S, Hamaguchi Y, Terawaki Y, Murase K, et al. Exendin-4, a GLP-1 receptor agonist, attenuates prostate cancer growth. Diabetes. 2014;63:3891–905. 10.2337/db13-1169 . [DOI] [PubMed] [Google Scholar]
- 24.Krishan A. Rapid flow cytofluorometric analysis of mammalian cell cycle by propidium iodide staining. The Journal of cell biology. 1975;66:188–93. 10.1083/jcb.66.1.188 . [DOI] [PMC free article] [PubMed] [Google Scholar]
- 25.Gupta S, Wang Y, Ramos-Garcia R, Shevrin D, Nelson JB, Wang Z. Inhibition of 5alpha-reductase enhances testosterone-induced expression of U19/Eaf2 tumor suppressor during the regrowth of LNCaP xenograft tumor in nude mice. The Prostate. 2010;70:1575–85. 10.1002/pros.21193 . [DOI] [PMC free article] [PubMed] [Google Scholar]
- 26.Lapp CA, Stachura ME, Tyler JM, Lee YS. GH3 cell secretion of growth hormone and prolactin increases spontaneously during perifusion. In vitro cellular & developmental biology: journal of the Tissue Culture Association. 1987;23:686–90. 10.1007/bf02620981 . [DOI] [PubMed] [Google Scholar]
- 27.Theodoropoulou M, Tichomirowa Ma, Sievers C, Yassouridis A, Arzberger T, Hougrand O, et al. Tumor ZAC1 expression is associated with the response to somatostatin analog therapy in patients with acromegaly. International journal of cancer Journal international du cancer. 2009;125:2122–6. 10.1002/ijc.24602 . [DOI] [PubMed] [Google Scholar]
- 28.Aggarwal BB, Kunnumakkara AB, Harikumar KB, Gupta SR, Tharakan ST, Koca C, et al. Signal transducer and activator of transcription-3, inflammation, and cancer: how intimate is the relationship?. Annals of the New York Academy of Sciences. 2009;1171:59–76. 10.1111/j.1749-6632.2009.04911.x . [DOI] [PMC free article] [PubMed] [Google Scholar]
- 29.Zhou C, Jiao Y, Wang R, Ren S-g, Wawrowsky K, Melmed S. STAT3 upregulation in pituitary somatotroph adenomas induces growth hormone hypersecretion. The Journal of clinical investigation. 2015;125:1692–702. 10.1172/JCI78173 . [DOI] [PMC free article] [PubMed] [Google Scholar]
- 30.Busto R, Carrero I, Zapata P, Colás B, Prieto JC. Multiple regulation of adenylyl cyclase activity by G-protein coupled receptors in human foetal lung fibroblasts. Regulatory peptides. 2000;95:53–8. 10.1016/s0167-0115(00)00129-4 . [DOI] [PubMed] [Google Scholar]
- 31.Florio T, Yao H, Carey KD, Dillon TJ, Stork PJ. Somatostatin activation of mitogen-activated protein kinase via somatostatin receptor 1 (SSTR1). Molecular endocrinology (Baltimore, Md). 1999;13:24–37. 10.1210/mend.13.1.0224 . [DOI] [PubMed] [Google Scholar]
- 32.Grozinsky-Glasberg S, Franchi G, Teng M, Leontiou CA, Ribeiro de Oliveira A, Dalino P, et al. Octreotide and the mTOR inhibitor RAD001 (everolimus) block proliferation and interact with the Akt-mTOR-p70S6K pathway in a neuro-endocrine tumour cell Line. Neuroendocrinology. 2008;87:168–81. 10.1159/000111501 . [DOI] [PubMed] [Google Scholar]
- 33.Barreca A, Cariola G, Ponzani P, Arvigo M, Foppiani L, Giordano G, et al. Effect of octreotide on circulating IGF-I chromatographic profile: evidence for an inhibitory action on the formation of the 150-kDa ternary complex. Clinical endocrinology. 1995;42:161–7. 10.1111/j.1365-2265.1995.tb01857.x . [DOI] [PubMed] [Google Scholar]
- 34.Fieffe S, Morange I, Petrossians P, Chanson P, Rohmer V, Cortet C, et al. Diabetes in acromegaly, prevalence, risk factors, and evolution: data from the French Acromegaly Registry. European journal of endocrinology / European Federation of Endocrine Societies. 2011;164:877–84. 10.1530/EJE-10-1050 . [DOI] [PubMed] [Google Scholar]
- 35.Melmed S. Acromegaly pathogenesis and treatment. The Journal of clinical investigation. 2009;119:3189–202. 10.1172/JCI39375 . [DOI] [PMC free article] [PubMed] [Google Scholar]
- 36.Jenkins PJ, Mukherjee A, Shalet SM. Does growth hormone cause cancer? Clinical endocrinology. 2006;64(2):115–21. Epub 2006/01/25. 10.1111/j.1365-2265.2005.02404.x . [DOI] [PubMed] [Google Scholar]
- 37.Jaffrain-Rea ML, Angelini M, Gargano D, Tichomirowa MA, Daly AF, Vanbellinghen JF, et al. Expression of aryl hydrocarbon receptor (AHR) and AHR-interacting protein in pituitary adenomas: pathological and clinical implications. Endocrine-related cancer. 2009;16(3):1029–43. Epub 2009/06/27. 10.1677/ERC-09-0094 . [DOI] [PubMed] [Google Scholar]
Associated Data
This section collects any data citations, data availability statements, or supplementary materials included in this article.
Supplementary Materials
(A) Nucleotide sequence of normal (wild-type) and mutant Aip exon 4 in GH3-FTY cells. GH3-FTY cells contained heterozygous mutants of an adenine insertion at c.496 and a two base deletion at c.496-497, causing premature stop codons at codon 173 (TGA) and codon 172 (TGA), respectively, in both Aip alleles. (B) Schematic of wild-type and mutant Aip structures found in GH3 cells.
(PDF)
Primers 1–6 were used to amplify Aip. Primers 7–13 were used for qPCR to determine the mRNA expression levels of respective genes.
(PDF)
(PDF)
Data Availability Statement
All relevant data are within the paper and its Supporting Information files.


