

Abstract
We herein study genetic recombination in three cattle populations from France, New Zealand, and the Netherlands. We identify 2,395,177 crossover (CO) events in 94,516 male gametes, and 579,996 CO events in 25,332 female gametes. The average number of COs was found to be larger in males (23.3) than in females (21.4). The heritability of global recombination rate (GRR) was estimated at 0.13 in males and 0.08 in females, with a genetic correlation of 0.66 indicating that shared variants are influencing GRR in both sexes. A genome-wide association study identified seven quantitative trait loci (QTL) for GRR. Fine-mapping following sequence-based imputation in 14,401 animals pinpointed likely causative coding (5) and noncoding (1) variants in genes known to be involved in meiotic recombination (HFM1, MSH4, RNF212, MLH3, MSH5) for 5/7 QTL, and noncoding variants (3) in RNF212B for 1/7 QTL. This suggests that this RNF212 paralog might also be involved in recombination. Most of the identified mutations had significant effects in both sexes, with three of them each accounting for ∼10% of the genetic variance in males.
Meiotic recombination refers to reciprocal exchange between paternal and maternal homologs. It ensures proper chromosome segregation during meiosis. It plays a major evolutionary role by creating diversity, bringing favorable alleles together and separating them from deleterious variants. Recombination shapes the patterns of linkage disequilibrium that make genome-wide association studies (GWAS) possible.
Our understanding of the recombination process has considerably increased in recent years (e.g., Coop and Przeworski 2007; Baudat et al. 2013). The present model postulates two mitotic-like pathways (leading, respectively, to noncrossovers and crossovers [COs] that are not subject to chromosome interference), and one meiosis-specific pathway (leading to COs that are subject to chromosome interference) (e.g., Kohl and Sekelsky 2013). Many genes have been identified that, upon mutation, affect meiotic recombination. The Gene Ontology Database reports at least 37 genes related to reciprocal meiotic recombination in humans (Supplemental Table S1) (e.g., Baudat et al. 2013).
Genealogies have been genotyped at high density for different purposes, including the study of complex diseases in humans or genomic selection in animals and plants. These can be used to map quantitative trait loci (QTL) affecting individual variation in genome-wide or global recombination rate (GRR). Such GWAS have been conducted in humans (Kong et al. 2008, 2014; Chowdhury et al. 2009; Fledel-Alon et al. 2011), cattle (Sandor et al. 2012; Ma et al. 2015), and sheep (Johnston et al. 2016), revealing the role of genes such as RNF212 in the three species. In humans, most identified variants were found to have sex-specific effects (Chowdhury et al. 2009; Fledel-Alon et al. 2011; Kong et al. 2014).
In the present study, we take advantage of a joint data set comprising more than 110,000 cattle genotyped with 50K SNP arrays to characterize GRR in the male and female germ line, map the QTL affecting it, and then apply sequence-based GWAS to fine-map the identified QTL.
Results
The autosomal recombination rate is higher in bulls than in cows
To study the autosomal recombination rate, we used data from three dairy cattle populations (Supplemental Fig. S1) and ∼31,000 autosomal SNPs (for a physical map of ∼2600 Mb). Using LINKPHASE3 (see Methods), we identified 2,395,177 COs in sperm cells transmitted by 2940 sires to 94,516 offspring, and 579,996 COs in oocytes transmitted by 11,461 cows to 25,332 offspring (Supplemental Note S1). The frequency distributions of the number of COs in sperm and oocytes in the different populations are presented in Supplemental Note S1. Consistently with recent findings in cattle (Ma et al. 2015) and sheep (Johnston et al. 2016), the GRR was found to be higher in males (23.3 Morgans [M]) than in females (21.4 M). This was consistent across populations (ratio of male to female GRR ranging from 1.06 to 1.10, corresponding to genetic maps being from +120 to +220 centimorgans [cM] larger in males) and chromosomes. COs tended to occur more often toward chromosomal ends than in their center (Supplemental Fig. S2). The frequency distribution of COs was generally similar between males and females for the central 60% of the chromosome length. At both ends (0%–20% and 80%–100%), however, the frequency of COs was higher in males than in females. The longer male than female map in cattle is primarily due to the higher frequency of terminal COs (particularly on the distal end) in males than in females. Increased recombination rates near telomeres have also been observed in human (Broman et al. 1998), mouse (Liu et al. 2014), chimpanzee (Venn et al. 2014), and cattle (Ma et al. 2015). In species other than cattle, the higher density of COs in subterminal regions in males (vs. females) is only relative to the corresponding chromosome average, while in cattle it is also higher in absolute terms.
GRR in bulls and cows is heritable and genetically correlated
We estimated heritability of the GRR with a restricted maximum likelihood (REML) approach. In males the heritability was 0.13 ± 0.03, whereas in females the heritability was 0.08 ± 0.02. These estimates are in the range of previous findings in humans and cattle. They indicate that the trait is heritable and hence under the control of genetic variants. We estimated the genetic correlation between male and female GRR using a bivariate linear mixed model (LMM) and obtained a value of 0.66 ± 0.16. This indicates that some variants are influencing the GRR in both males and females.
Haplotype-based genome scan identifies six QTL for GRR
We first performed a haplotype-based GWAS separately for males and females. At each marker position, haplotypes were sorted into 60 clusters or ancestral haplotypes (AHAPs) using a previously described hidden Markov model (Druet and Georges 2010). Association between AHAPs and GRRs was measured with a LMM including, in addition to the random haplotype effects, four principal components and a random polygenic effect to account for population stratification.
In males, we detected six QTL exceeding the genome-wide significance threshold, mapping to Bos taurus autosome (BTA)10 (position 21.23 Mb, P = 8.2 × 10−40), BTA6 (122.44 Mb [see Supplemental Note S4], P = 3.8 × 10⁻³¹), BTA10 (86.51 Mb, P = 1.0 × 10⁻¹⁴), BTA18 (52.85 Mb, P = 7.3 × 10⁻⁸), BTA3 (52.40 Mb, P = 1.2 × 10⁻⁷), and BTA23 (27.22 Mb, P = 4.5 × 10⁻⁷) (Fig. 1). Four of these were previously reported in Sandor et al. (2012) (BTA6 ∼122.44, BTA10 ∼21.23) and/or Ma et al. (2015) (BTA3 ∼52.40, BTA6 ∼122.44, BTA10 ∼21.23, BTA10 ∼86.51).
Figure 1.

Manhattan plots for male and female GRRs in cattle. The significance [−log10(P)] of the haplotype-based association is reported along the genome for male (upper panel) and female (lower panel) GRR. The horizontal dashed line marks the genome-wide significance threshold.
In females, three QTL were genome-wide significant, matching the positions of the three strongest male QTL: BTA10 (21.27 Mb, P = 1.8 × 10⁻²²), BTA6 (122.58 Mb, P = 2.3 × 10⁻¹²), and BTA10 (86.91 Mb, P = 1.2 × 10⁻⁷). A suggestive signal was observed on BTA3 (53.19 Mb, P = 9.4 × 10⁻⁴), but no signal was detectable on BTA18 and BTA23 (P-values > 0.1).
To determine whether the four shared QTL were driven by the same variants, we computed the correlations between the effects of the AHAPs estimated in males and females. All correlations were positive and significant (P ≤ 0.01), ranging from 0.35 for BTA3 to 0.64 for the proximal BTA10 QTL (Supplemental Figs. S3–S6). These positive correlations are compatible with the positive genetic covariance reported above. The haplotype effects were generally larger in males than in females (ratio of standard deviation of haplotypes effects ranged from 1.3 to 2.2).
Sequence-based fine-mapping of seven QTL for GRR
To fine-map the six identified QTL, we took advantage of two data sets of whole-genome sequences for, respectively, 122 Holstein-Friesian, Jersey, and crossbred animals and 215 Dutch Holstein cattle (≥15× depth). We used Beagle (Browning and Browning 2007) to impute the genomic sequence for windows averaging 5-Mb (range: ∼3.5–10 Mb) centered around the variants with the highest log(1/p) value for 14,401 animals with GRR phenotypes. We performed single-SNP association by replacing haplotype by SNP effects in the previously described LMM (Figs. 2–4; Supplemental Figs. S7–S13). Association analyses were conducted separately for male and female GRRs. We obtained log(1/p) values higher than those obtained with the haplotype-based analyses for all except the proximal BTA10 and the BTA6 QTL (Figs. 2–4; Supplemental Figs. S7–S13). For each of the corresponding “primary” signals, we identified variants in high LD (r² > 0.90) with the lead variant to define sets of 22.7 markers on average (range: 3–39) assumed to include the causative variant(s). For the four QTL shared by both sexes (BTA10 [21.23 Mb], BTA6 [122.44 Mb], BTA10 [86.51 Mb], and BTA3 [52.40 Mb]), LD-based sets of candidate variants defined in males and females were overlapping and merged (Table 1; Supplemental File S1).
Figure 2.

Fine-mapping QTL for GRR by sequence-based association analysis for BTA3 QTL (52.40 Mb) in females. Variants are colored according to their LD with the lead variant. The variants in red define “LD-based set of candidate variants” assumed to encompass the causative variants. The dashed curve in the inset represents the significance of the haplotype-based association signal, while the dotted vertical lines define the boundaries of the region that is zoomed in on the main graph.
Figure 3.

Cf. Figure 2 for BTA10 QTL (86.51 Mb) in males.
Figure 4.

Cf. Figure 2 for BTA10 QTL (21.23 Mb) in males.
Table 1.
Description of the LD-based sets of candidate variants defined by sequence-based association analyses
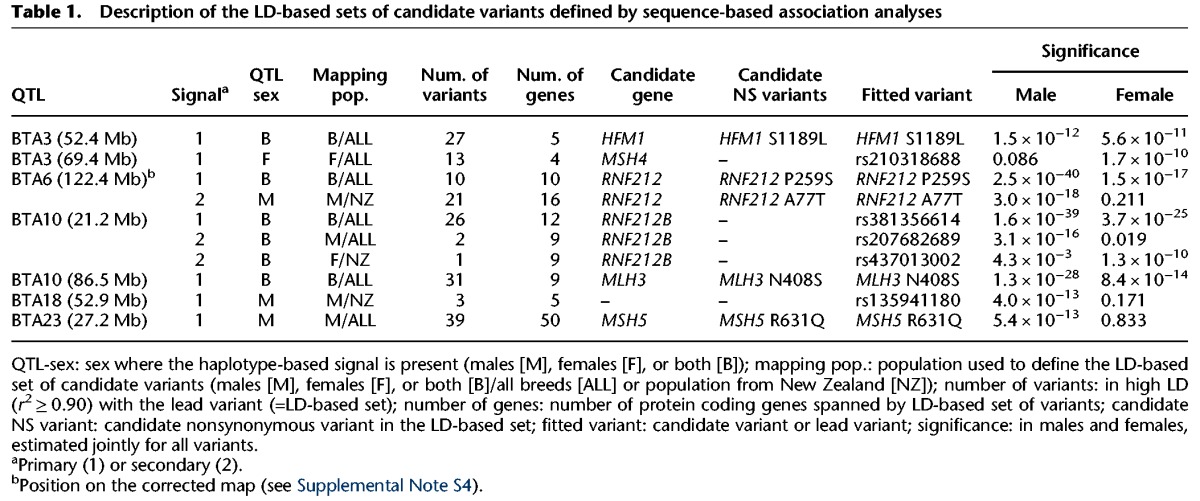
For the BTA10 (21.23 Mb) and BTA6 (122.44 Mb) QTL, the haplotype-based approach still yielded a significant signal when including the lead variant as covariate in the model (Supplemental Figs. S14–S17). For those, we repeated the sequence-based association analyses including the previously identified primary lead SNPs as covariates, yielding significant “secondary” signals and corresponding LD-based sets of candidate variants. For the BTA10 QTL, this yielded independent, nonoverlapping secondary sets in males and females (Table 1; Supplemental Figs. S18, S19; Supplemental Note S2).
We repeated a haplotype-based genome scan separately for males and females including the six detected primary and the three secondary lead SNPs. This revealed a seventh genome-wide significant QTL on BTA3 (69.42 Mb, P = 5.1 × 10⁻⁷) (Supplemental Fig. S20). The same QTL was previously reported by Ma et al. (2015). Strikingly, this QTL was only detected in females (P > 0.05 in males). As for the other QTL, we performed a sequence-based association analysis in a 5-Mb window centered around the peak (Supplemental Fig. S21). This resulted in the definition of an LD-based set of 13 candidate variants, fully explaining the haplotype effect (Table 1; Supplemental Fig. S14; Supplemental File S1).
LD-based sets of candidate variants are highly enriched in nonsynonymous variants affecting genes related to meiotic recombination
Within 100 kb of the variants defining the 10 LD-based sets are 104 protein-coding genes (plus two pseudogenes and 16 noncoding RNA genes) which were considered as candidate genes for the QTL (Supplemental Table S2). Intriguingly, five of these (mutS homolog 4 and 5 (MSH4, MSH5), mutL homolog 3 (MLH3), ring finger protein 212 (RNF212), and HFM1, an ATP-dependent DNA helicase homolog) were part of a list of 37 genes involved in reciprocal meiotic recombination (Supplemental Table S1; The Gene Ontology Consortium 2015). This is a highly significant (P = 1.3 × 10⁻⁶) 26-fold enrichment when compared to randomly selected genes. Consistently, GO term(s) related to meiotic recombination were found significantly overrepresented in the list of 104 positional candidate genes (Supplemental Table S3). Importantly, the five corresponding genes each mapped to a distinct QTL (Table 1). We showed by simulation that the probability for this to occur by chance was 5.3 × 10⁻⁸ (Methods). The three LD-based variant sets of the BTA10 (21.23 Mb) QTL (one primary, one male-specific secondary, and one female-specific secondary) each included the ring finger protein 212B (RNF212B) gene among a corresponding list of 13 positional candidate genes. RNF212B is the closest paralog of RNF212, which is well known to be involved in meiotic recombination in model organisms (Jantsch et al. 2004; Reynolds et al. 2013) and humans (e.g., Kong et al. 2008). These findings strongly suggest that the corresponding six genes are causally involved in the determinism of six of the seven identified QTL.
Further substantiating this assertion, we noted that nine of the 173 variants defining the 10 LD-based sets were nonsynonymous. This corresponds to a 15-fold enrichment when compared to random SNPs (P = 1.0 × 10⁻⁸). Most importantly, five of the nine nonsynonymous variants (HFM1 S1189L, RNF212 P259S, RNF212 A77T, MLH3 N4408S, MSH5 R631Q) affect four of the six recombination-related candidate genes (Table 1). Knowing that the six recombination-related genes account for 8.4% of the ORF space of the 104 candidates, the probability for this to occur by chance alone is 3.9 × 10⁻⁴. Moreover, the nonsynonymous variants in HFM1, MLH3, and MSH5 (but not RNF212) affect extremely conserved residues (phastCons46way Placental score ≥ 0.99) (Supplemental Figs. S22–S25). Taken together, these findings strongly suggest that the causative variants underlying at least some of the identified QTLs are nonsynonymous.
It is noteworthy that (1) for the BTA3 (69.42 Mb) QTL, a highly conserved (phastCons46way Placental score = 0.99) (Supplemental Fig. S26) nonsynonymous MSH4 variant (C342Y) was strongly associated with the GRR in females (P = 1.8 × 10⁻⁶), despite not being part of the LD-based set (Supplemental Fig. S21), and (2) for the BTA10 QTL (21.23 Mb), the secondary female-specific LD-based set included a synonymous variant in RNF212B (Supplemental Fig. S19). No recombination-related candidate gene was observed for the BTA18 QTL.
Identified variants account for a large proportion of the genetic variance
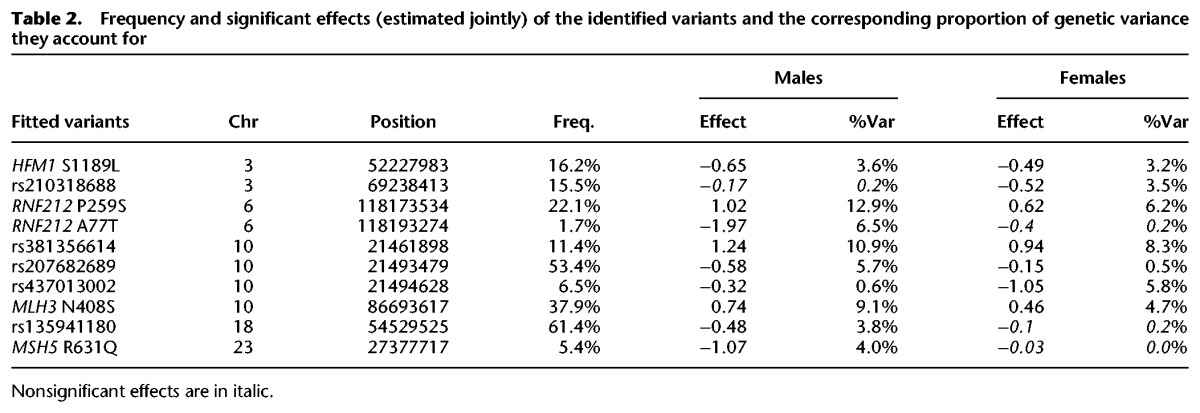
We jointly computed the effect sizes and variance explained by the 10 identified LD-based sets in our two largest populations (France and New Zealand). We used the pinpointed nonsynonymous variants in recombination-related genes when available, or the lead SNPs when not (Table 2). Six of the 10 variants affected both male and female recombination in a consistent manner (HFM1 S1189L, RNF212 P259S, rs381356614, rs207682689, rs437013002, and MLH3 N408S). Three appeared to affect recombination only in males (MSH5 R631Q, RNF212 A77T, and rs135941180), and one only in females (rs210318688). The frequency of the derived allele ranged from 1.7% to 61.4% (see Supplemental Table S4 for frequencies per population). Several of the QTL had large effects, increasing or decreasing the GRR by ≥1 CO (derived allele substitution effects ranged from −1.97 to +1.24 in males and −1.05 to +0.94 in females), and explained >5% of the genetic variance (≤12.9% in males and ≤8.3% in females). QTL effects were mostly additive, with little evidence for dominance or epistasis (Supplemental Note S3). Jointly, the significant variants explained 57% of the genetic variance in males, and 32% in females. Assuming additivity, the expected difference in the number of COs per gamete between the most extreme genotypes (which were not observed in the studied populations) is 16.5 in males and 9.5 in females.
Table 2.
Frequency and significant effects (estimated jointly) of the identified variants and the corresponding proportion of genetic variance they account for
Discussion
We herein use a data set corresponding to more than 94,000 inherited sperm cells and 25,000 inherited oocytes to measure GRR in the male and female germ line of cattle. The sex-averaged recombination rate was estimated at 22.35 M, close to expectation given the established linear relationship with the number of chromosome arms (Coop and Przeworski 2007). We observe that the autosomal recombination rate is larger in males (23.3 M) than in females (21.4 M), and this was consistent across chromosomes. Our results are in agreement with a recent report based on an even larger cattle data set by Ma et al. (2015). This contradicts Haldane's suggestion of a higher GRR in the homogametic versus heterogametic sex (Haldane 1922). Haldane's prediction has been confirmed in achiasmate species in which only one sex recombines (Lenormand and Dutheil 2005), such as Drosophila (Morgan 1912, 1914) or Bombyx (Haldane 1922), but it has also been consistently observed in fish (zebrafish: 2.7 female/male [F/M] ratio [Singer et al. 2002]; Atlantic salmon: 8.3 F/M ratio [Moen et al. 2004]) and most studied mammals (human: 1.6 F/M ratio [e.g., Broman et al. 1998; Chowdhury et al. 2009]; mouse: 1.3 F/M ratio [Petkov et al. 2007]; dog: 1.4 F/M ratio [Neff et al. 1999]; pig: 1.4 F/M ratio [Muñoz et al. 2012]). No difference between the male and female GRR was observed in poultry (Groenen et al. 2009). The male GRR was also found to be larger than the female GRR in sheep (0.77 F/M ratio [Crawford et al. 1995; Johnston et al. 2016]). The reason for this distinct behavior of two domesticated Bovidae remains unknown. The evolutionary significance of Haldane's prediction remains poorly understood. The differences in recombination rate between sexes have been found to correlate with the length of the synaptonemal complex (Lynn et al. 2002; Petkov et al. 2007). The observation of a higher male than female GRR in Bovinae allows testing the generality and hence functional significance of this association. It is noteworthy that, in humans, the recombination rate in imprinted regions was found to be higher in males than in females, at odds with the rest of the genome (Pàldi et al. 1995).
We show that GRR varies considerably between gametes. The total number of COs ranged from six to 45 in male, and from seven to 47 in female gametes. Two thousand one hundred and thirty-five sires and 3386 dams contributed more than one gamete, allowing estimation of the repeatability or importance of individual effects on GRR. Eighteen percent of the variation in male GRR and 9% in female GRR could be attributed to an effect of the parent. We further estimated what part of this repeatability was genetic in nature. Using an animal model, the (narrow sense) heritability of GRR was estimated at 13% in males and 8% in females.
We estimated the genetic correlation between male and female GRR to be 0.66. This contradicts reports in humans, where male and female GRR were shown to be genetically uncorrelated (Fledel-Alon et al. 2011). This suggests that, contrary to the situation in humans (where most variants were shown to be active in only one sex, or—in the case of RNF212—even have opposite effects in the two sexes [Kong et al. 2008, 2014; Chowdhury et al. 2009; Fledel-Alon et al. 2011]), at least some variants (including in RNF212) consistently affect male and female GRR. Indeed, six of the 10 identified variants had a significant and consistent effect in both sexes. We nevertheless observed three variants that appeared to only affect GRR in males, and one only in females. The female-specificity of the MSH4 variant (rs210318688) is in agreement with previous findings in human (Y589C) (Kong et al. 2014) and in cattle (Ma et al. 2015). It is noteworthy that knocking-out MSH4 in the mouse affects both male and female recombination (Kneitz et al. 2000). We cannot exclude the possibility that the apparent absence of an effect in one sex is due to insufficient statistical power rather than the genuine absence of a biological effect. This is particularly the case for females (for instance, the low frequency RNF212 A77T variant seems to have a large, albeit nonsignificant effect in females).
We showed (1) that the chromosomal segments to which the seven identified QTL were fine-mapped were significantly enriched in genes known to be involved in meiotic recombination, and (2) a significant enrichment of strongly associated nonsynonymous variants in these genes. This strongly suggests that the corresponding genes (HFM1, RNF212, MLH3, MSH4, and MSH5) and variants are causally involved in five of the seven QTL. In model organisms, meiotic arrest or strongly reduced recombination rates have been observed in HFM1 (Lipkin et al. 2002; Nakagawa and Kolodner 2002; Mercier et al. 2005; Guiraldelli et al. 2013), MLH3 (Lipkin et al. 2002; Brown et al. 2013), RNF212 (Reynolds et al. 2013), MSH5 (Hollingsworth et al. 1995; Edelmann et al. 1999), and MSH4 (Ross-Macdonald and Roeder 1994; Nishant et al. 2010) mutants. Naturally occurring variants in RNF212 (Kong et al. 2008, 2014; Chowdhury et al. 2009; Fledel-Alon et al. 2011; Sandor et al. 2012) and MSH4 (Kong et al. 2014; Ma et al. 2015) were previously shown to affect GRR in mammals. Intriguingly, four of these genes (MSH4, MSH5, HFM1, RNF212) operate at the same stage of meiotic recombination, namely the processing of recombination intermediates, while MLH3 participates in the downstream resolution to crossovers (e.g., Baudat et al. 2013). Evidence of physical interactions between the corresponding proteins has been demonstrated (Bocker et al. 1999; Santucci-Darmanin et al. 2002; Baudat et al. 2013; Reynolds et al. 2013). Three of the genes are DNA mismatch repair genes (MLH3, MSH4, and MSH5) and four of them (HFM1, MLH3, MSH4, and MSH5) are associated with the interfering pathway (Mercier et al. 2005; Baudat et al. 2013; Kohl and Sekelsky 2013).
The BTA10 (21.23 Mb) QTL was previously attributed to variants in the REC8 gene (Sandor et al. 2012). Sequence-based fine-mapping performed in this study indicates that the association maximizes at 645 kb from REC8. Intriguingly, the three corresponding LD-based sets of candidate variants define RNF212B as a positional candidate gene (Table 1; Fig. 4; Supplemental Figs. S10, S18, S19). RNF212B is a paralog of RNF212, a well-established meiotic recombination gene, but its function(s) remains unknown. Both genes trace back to a whole-genome duplication at the basis of the vertebrate lineage (Supplemental Fig. S27; Ohno 1970; Holland et al. 1994; Dehal and Boore 2005). Both are present in mammals and fish, whereas there is only one gene in cephalochordates (Ciona savigny and C. intestinalis). Putative orthologs in the more distantly related nematode C. elegans (zhp-3) and budding yeast S. cerevisiae (CST9) have been shown to play a role in recombination (Agarwal and Roeder 2000; Jantsch et al. 2004), indicating that prior to the duplication event the gene was already involved in recombination. After duplication, the function of RNF212 remained associated with the same biological process (e.g., Kong et al. 2008; Reynolds et al. 2013). Because RNF212B displays branch lengths that are shorter than those of RNF212, it has diverged even less than RNF212 since the duplication and is also likely to have retained the ancestral function. Moreover, we note the possible absence (according to Ensembl or UniProt databases) of either RNF212B (e.g., in birds) or RNF212 (e.g., in American alligator) in some lineages, suggesting that both copies play similar functions and may be partially redundant. In addition to these phylogenetic observations, RNF212B was shown to be strongly expressed in testis (Petryszak et al. 2014). Thus, our findings further support a role for RNF212B in meiotic recombination.
The identification of RNF212B as the most likely candidate (rather than the previously pinpointed REC8) illustrates the achievable gains in resolution from using imputed sequence information. Ma et al. (2015) performed their GWAS using 310,790 genome-wide SNPs. In the fine-mapped regions, this corresponds to a coverage that is ∼36-fold lower than the SNP density used in this study. Ma et al. (2015) reported 10 positional candidate genes on the basis of their proximity to lead SNPs, of which six genes for five QTLs also fine-mapped in this study. For only one of these QTL was the same candidate gene proposed in both studies (BTA3 [∼69.4 Mb]: MSH4). The highlighted candidate genes were different for the remaining four (BTA3 ∼52.4: GCLM; BTA6 ∼122.44: CPLX1; BTA10 ∼21.1: REC114/PABPN1; BTA10 ∼86.5: NEK9). GCLM and REC114 are at >1 Mb from our LD-based variant clusters and were therefore not included in our list of candidate genes (while the remaining three genes were). Evidence for a role in meiotic reciprocal recombination is well established only for MSH4 in the gene list of Ma et al. (2015). None of the variants in our LD-based sets are nonsynonymous variants in any one of their candidate genes. Considering all available information, HFM1, MSH4, RNF212, RNF212B, and MLH3 appear to us as the most likely causative genes.
We report two QTL that were not documented before, on BTA18 (∼52.85) and BTA23 (∼27.22). The latter was attributed to a missense variant in the MSH5 gene. Ma et al. (2015) reported five QTL that were not detected in our study. One of these is a QTL at the telomeric end of BTA1 (∼158.14 Mb) affecting GRR in females but not in males. The corresponding chromosome segment was initially ignored in our analysis as it was shown by LINKPHASE3 to be misplaced in the UMD3.1 build (Druet and Georges 2015). To follow up on the findings of Ma et al. (2015), we repositioned the misplaced segment to the telomeric end of BTA1 (consistent with the Baylor 4.6.1 bovine genome build) and repeated the analyses (Supplemental Fig. S28). We indeed observed a significant effect on GRR in females (P = 1.4 × 10⁻⁹), but not in males (P ≥ 0.1), consistent with Ma et al. (2015). The signal maximized at the penultimate SNP (rs110203897) interrogated by the array (Supplemental Fig. S28). An autosomal paralog of PRDM9 maps ∼113 kb distally from this position and was highlighted by Ma et al. (2015), given its established role in recombination. Consistent with the known function of PRDM9 (Baudat et al. 2010), the same variants were shown by Ma et al. (2015) to affect hotspot usage, yet more so in females (P = 2.2 × 10−134) than in males (P = 6.6 × 10⁻¹³). We attempted to impute sequence information in the corresponding region to provide additional information in support of PRDM9’s role (Supplemental Fig. S29). Single-SNP association analysis maximized at the position of the last SNPs interrogated by the array ∼89 kb from PRDM9 (rs1106661033; P = 1.0 × 10⁻¹²). Imputation accuracy was almost zero in the last 125 kb of the chromosome encompassing PRDM9 and ZNF596, precluding us from effectively testing the association of SNPs spanning these genes (Supplemental Fig. S30). It is noteworthy that we previously showed that coding variants in an X-linked PRDM9 paralog (with highest similarity to the human PRDM9 gene) strongly affect hotspot usage in males (Sandor et al. 2012), but this was not confirmed by Ma et al. (2015). Combined with the observation of limited sharing of recombination hotspots between males and females (Ma et al. 2015), these observations suggest that hotspot usage may be differentially regulated in both sexes in cattle.
In addition to the BTA1 (∼158,1 Mb) QTL, Ma et al. (2015) reported two QTL on BTA26 (∼14.9 Mb and ∼31.4 Mb) and two QTL on BTAX (∼3.5 Mb and ∼12.2 Mb) that were not detected in our study. This is probably due to the smaller sample size and hence lower power of our study design. It is noteworthy, however, that we observed suggestive signals on BTA26, respectively at ∼17.8 Mb (P = 0.0001) and ∼32.8 Mb (P = 0.001) in females.
One of the striking features of the identified allele substitution effects and the variance they explain is their magnitude. In males, effects ranged from −0.43 to +0.27 phenotypic standard deviations (corresponding to −1.97 to +1.24 CO) and explained up to 12.9% of genetic variance. If considered within populations, some QTL even account for a larger proportion of the genetic variance. Natural variants with large effects on GRR have also been described in human (Chowdhury et al. 2009) and sheep (Johnston et al. 2016). This observation could be related to the fact that several of the identified variants are nonsynonymous. These findings are at odds with the now prevalent view that most complex traits, including morphometric and physiological traits (e.g., height and reproductive aging), as well as common diseases in humans (Finucane et al. 2015) and phenotypic variation in domestic animals (Andersson 2008) are highly polygenic and primarily determined by large numbers of common variants that individually explain <1% of the genetic variance and only contain a minority of missense variants (hence, most bound to be regulatory variants) (Flint and Mackay 2009; Yang et al. 2010). In agreement with Kemper and Goddard (2012), we have previously shown that at least some production traits under intense directional selection (e.g., muscularity) involve a handful of young alleles with large effects that are sweeping through the population, in addition to a tail of many small “polygenic” effects (Druet et al. 2014). Directional selection is unlikely to be the explanation for the segregation of variants with large effects on GRR, as the effects of the derived allele are equally balanced between positive and negative effects (Table 2). Moreover, the derived alleles segregate in multiple breeds and on distinct haplotypes, pointing toward their old age. One possible explanation is that variants with major opposite effects are maintained in the populations as a form of balanced polymorphisms in response to stabilizing selection for an optimal GRR.
Battagin et al. (2016) suggested by simulations that cumulative response to directional selection could be significantly increased if GRR could at least be doubled. That this may in theory be possible, at least in plants, is demonstrated by the commensurate effects on GRR of anti-CO mutants including in FANCM (Crismani et al. 2012). However, fixing the 10 variants identified in this study would only increase GRR by ∼25% (+6.4 CO), which is unlikely to be sufficient to markedly improve genetic gains. One would also need to ensure that selection for the corresponding variants would not negatively affect fertility. Loss-of-function mutations in the five identified genes are indeed known to severely compromise fertility in the mouse (Edelmann et al. 1999; Kneitz et al. 2000; Lipkin et al. 2002; Guiraldelli et al. 2013). As a matter of fact, it would be interesting to know whether variations in GRR correlate with variation in fertility in cattle (as it does in humans) (Kong et al. 2004), and efforts toward addressing this are ongoing.
The same data set allows for the genetic analysis of variation in genome-wide hotspot usage, local recombination rate, and chromosome interference, as well as other facets of meiotic recombination, and work toward those goals is in progress.
Methods
Genotyping data
The three studied populations consisted of Holstein animals from France (45,348), Holstein animals from the Netherlands (11,831), and Holstein-Friesian, Jersey, or crossbred individuals from New Zealand (58,474). Individuals were genotyped with the BovineSNP50 (54,001 SNPs, 111,597 individuals) or BovineHD (777,962 SNPs, 4056 individuals) genotyping arrays (Illumina). Markers common to both arrays were selected for further analysis. Monomorphic markers, with low call rate (below 0.95), or deviating from Hardy-Weinberg proportions (P-value < 1.0 × 10⁻⁵ in Holstein populations and < 1.0 × 10⁻⁸ in New Zealand crossbred population), or with >10 Mendelian inconsistencies were discarded. Thirty thousand eight hundred and seventy-four SNPs (30,127 on autosomes) and 115,653 animals with an individual call rate higher than 0.90 were kept for further analyses. Remaining Mendelian inconsistencies were erased.
Marker maps
Physical maps corresponded to SNP positions from the UMD3.1 bovine genome assembly. We first ran LINKPHASE3 and used the local Map Confidence Score (MCS) to identify incorrectly mapped marker segments (MCS < 0.99) as described in Druet and Georges (2015). After deletion of 373 markers associated with putative map errors (72 segments; 0.6% of map length), MCSs were higher than 0.99 for the entire map. The largest putative map error was located on BTA6 and encompassed RNF212, known to be associated with GRR. Therefore, we corrected the local BTA6 marker map as described in Supplemental Note S4.
Principal component analysis
To correct for stratification, principal component analysis (PCA) was performed using GCTA (Yang et al. 2011). The M × N matrix, G, (M = number of SNPs = 30,127 and N = number of animals = 14,401) was normalized as described in Price et al. (2006). The N × N covariance matrix, X, was obtained whose elements give the covariances between the genotyped animals. The principal component analysis was performed on the X matrix and the first four eigenvectors were used as covariates in the association models.
Crossover identification
The genotyped animals can be arranged in 94,516 sire-offspring pairs and 25,332 dam-offspring pairs (Supplemental Table S5). Crossovers were identified by comparing haplotypes of a parent with those of its offspring. Haplotype reconstruction was performed with LINKPHASE3, relying exclusively on familial information (parental genotypes, Mendelian segregation rules, and linkage information). As demonstrated in Supplemental Note S5, the accuracy of CO identification is a function of the accuracy of inferred haplotypes. For the parent, the accuracy depends mostly on whether 0, 1, or 2 of its own parents are genotyped and the number of genotyped offspring, whereas for the offspring, the phasing accuracy depends mostly on whether its second parent (the mate of the parent) is genotyped. To compare male and female GRR without bias, we used identical subpedigrees (trios) in both sexes, consisting of the parent, one genotyped offspring, and one genotyped grand-parent (parent of the parent). The same design was used to estimate heritability and genetic correlations. We compared informativity (as the number of heterozygous markers in the parent, phased in both the parent and the offspring), and it was found to be equal between sexes in the controlled design (subpedigrees), whereas informativity was higher in females than in males when considering all available information (see Supplemental Note S5). For association studies, we used as much information as possible to maximize power. All parents with more than five genotyped offspring or with at least one of their own parents genotyped were conserved, and all the available familial information (all genotyped offspring, parents and mates) was used to reconstruct haplotypes.
Estimation of genetic parameters
A univariate linear mixed model was applied to male and female GRR separately:
where y is the vector of GRR (one per offspring), µ is the overall mean (1 represents a vector of 1), P, Zu, and Zp are incidence matrices relating principal components, random individual polygenic effects, and random permanent environment effects to their respective records, c is the vector of effects of the first four principal components, u is the vector of random individual polygenic effects assumed to be , where is the additive genetic variance and A is the additive relationship matrix estimated from the pedigree, p is the vector of random permanent environment effects assumed to be , where is the permanent environment variance and e is the vector of individual error terms assumed to be , where is the residual variance.
To estimate the genetic correlation between male and female GRR, the following bivariate LMM was applied:
where subscript i indicates the trait. For instance, y1 is the vector of male GRR records, whereas y2 is the vector of female GRR. The random polygenic effects have the following covariance structure:
where is the additive genetic variance for trait i, and is the genetic covariance between male and female GRR. Similarly, the random permanent environment effects have the following covariance structure:
where is the permanent environment variance for trait i. For the random residual effects:
where is the residual variance for trait i. We assume independent residual error terms.
Genetics parameters of univariate and bivariate mixed models were estimated using average information restricted maximum likelihood analysis (AI-REML) (Misztal et al. 2002). Standard errors were obtained from the inversion of the average-information matrix.
Haplotype-based association study
To find variants associated with GRR, we performed a haplotype-based GWAS. Partial haplotypes obtained with LINKPHASE3 were further phased using LD information with DAGPHASE (Druet and Georges 2010) and Beagle (Browning and Browning 2007). At each marker position, haplotypes were clustered in ancestral haplotypes (AHAP) using HiddenPHASE (Druet and Georges 2010). This hidden Markov model assigns the phased chromosomes of the genotyped individuals at each variant position to one of a predetermined number of hidden AHAP states based on their local similarity, following Scheet and Stephens (2006).
Association between AHAP and GRR is measured by adding a random AHAP effect to the previously described univariate LMM:
where Zu and Zh are incidence matrices relating random polygenic and AHAP effects to the GRR records and h is a vector of random AHAP effects. The presence of a QTL was tested using a likelihood ratio test (distributed as a χ2 distribution with 1 df) comparing the likelihood of the data assuming a model with versus without haplotype effect. The genome-wide significance threshold was set at 1.0 × 10⁻⁶ after Bonferroni correction for 50,000 independent tests.
Sequence-based association analysis
We performed imputation within populations as described in Supplemental Note S6. We selected two reference panels of individuals sequenced at cover ≥15×. For the European Holstein, we had 215 individuals, whereas for the population of New Zealand, the reference population consisted of 122 Holstein-Friesian, Jersey, and crossbred individuals. We filtered SNPs based on imputation accuracy (r2 > 0.50 in both data sets), marker allele frequency (>0.05), and presence in all populations where the QTL is segregating. The association study was performed with the same LMM as for the haplotype-based analysis, but random haplotype effects were replaced by a regression on SNP allelic dosage. We added a population effect to account for possible differences in imputation. The association was evaluated separately in males and females using a Z-test (the t-test was replaced by a Z-test since the Satterthwaite degrees of freedom were >20,000 in both males and females). For all QTL, we consider as candidate variants all the variants in high linkage disequilibrium (r2 > 0.90) with the lead variant. When the haplotype-based association signal came mostly from one population, we also tested the sequenced-based association analysis within that population alone and selected the most significant association to define the LD-based set of candidate variants (BTA3—69 Mb, BTA6—secondary signal, BTA10—21 Mb—secondary signal in females, BTA18, BTA23).
Enrichment in genes related to recombination or in nonsynonymous variants
For the enrichment in genes related to recombination, we sampled 1010×104 genes out of a list of 19,994 protein-coding genes and grouped them in 10 sets (with defined size) (Supplemental Table S1). We then counted the number of samples with five or more recombination genes and the number of samples with five or more sets containing at least one recombination gene.
To measure the enrichment of nonsynonymous (NS) variants in the LD-based sets of candidate variants, we estimated the probability to sample more than x NS mutations in a list of y random variants (the LD-based sets). To that end, we first used SnpEff (Cingolani et al. 2012) to annotate the VCF file of variants common to our reference populations. We then grouped the variants according to their predicted effects (modifier n = 18,817,133; low n = 63,622; moderate n = 57,856; high n = 5914). The NS variants (n = 56603) are in the category of moderate effects. The probability to sample a variant with a moderate or high effect is 3.37 × 10⁻³. We then used the binomial distribution to compute the probability to sample more than x variants with such effects out of y variants.
Data access
The VCF files for the seven QTL regions from this study (Chr 3: 49.5–54.5 Mb, Chr 3: 67–72 Mb, Chr 6: 117.7–121.1 Mb, Chr 10: 17.5–23.5 Mb, Chr 10: 83.5–88.5 Mb, Chr 18: 50–60 Mb, Chr 23: 25–31 Mb) have been submitted to the European Nucleotide Archive (ENA; http://www.ebi.ac.uk/ena). They include real genotypes (sequence data) at 320,294 and 357,039 variant positions in 215 and 122 reference animals belonging to European Holstein and New Zealand populations, respectively, and real (478 SNPs interrogated by Illumina arrays) (accession number PRJEB14878) and imputed genotypes for the 14,401 animals with GRR phenotype (accession number PRJEB14879). The phenotypes, including the positions of the 2,395,177 male and 579,996 female crossover events, and the pedigree files have also been submitted to ENA (accession number PRJEB14879).
Supplementary Material
Acknowledgments
We thank three anonymous reviewers for their helpful comments. This work was funded by the Damona European Research Council grant ERC AdG-GA323030 to M.G. T.D. and C.C. are Research Associate and Senior Research Associate from the Fonds de la Recherche Scientifique–FNRS (F.R.S.-FNRS). We also thank Livestock Improvement Corporation (Hamilton, New Zealand), Allice (Paris, France), INRA (Jouy-en-Josas, France), and CRV (Arnhem, the Netherlands) for providing us with the SNP genotype and pedigree data. We used the supercomputing facilities of the Consortium des Equipements de Calcul Intensitf en Fédération Wallonie Bruxelles (CECI), funded by the F.R.S.-FNRS.
Footnotes
[Supplemental material is available for this article.]
Article published online before print. Article, supplemental material, and publication date are at http://www.genome.org/cgi/doi/10.1101/gr.204214.116.
References
- Agarwal S, Roeder GS. 2000. Zip3 provides a link between recombination enzymes and synaptonemal complex proteins. Cell 102: 245–255. [DOI] [PubMed] [Google Scholar]
- Andersson L. 2008. Genome-wide association analysis in domestic animals: a powerful approach for genetic dissection of trait loci. Genetica 136: 341–349. [DOI] [PubMed] [Google Scholar]
- Battagin M, Gorjanc G, Faux A-M, Johnston SE, Hickey JM. 2016. Effect of manipulating recombination rates on response to selection in livestock breeding programs. Genet Sel Evol 48: 44. [DOI] [PMC free article] [PubMed] [Google Scholar]
- Baudat F, Buard J, Grey C, Fledel-Alon A, Ober C, Przeworski M, Coop G, De Massy B. 2010. PRDM9 is a major determinant of meiotic recombination hotspots in humans and mice. Science 327: 836–840. [DOI] [PMC free article] [PubMed] [Google Scholar]
- Baudat F, Imai Y, de Massy B. 2013. Meiotic recombination in mammals: localization and regulation. Nat Rev Genet 14: 794–806. [DOI] [PubMed] [Google Scholar]
- Bocker T, Barusevicius A, Snowden T, Rasio D, Guerrette S, Robbins D, Schmidt C, Burczak J, Croce CM, Copeland T. 1999. hMSH5: a human MutS homologue that forms a novel heterodimer with hMSH4 and is expressed during spermatogenesis. Cancer Res 59: 816–822. [PubMed] [Google Scholar]
- Broman KW, Murray JC, Sheffield VC, White RL, Weber JL. 1998. Comprehensive human genetic maps: individual and sex-specific variation in recombination. Am J Hum Genet 63: 861–869. [DOI] [PMC free article] [PubMed] [Google Scholar]
- Brown MS, Lim E, Chen C, Nishant K, Alani E. 2013. Genetic analysis of mlh3 mutations reveals interactions between crossover promoting factors during meiosis in baker's yeast. G3 (Bethesda) 3: 9–22. [DOI] [PMC free article] [PubMed] [Google Scholar]
- Browning SR, Browning BL. 2007. Rapid and accurate haplotype phasing and missing-data inference for whole-genome association studies by use of localized haplotype clustering. Am J Hum Genet 81: 1084–1097. [DOI] [PMC free article] [PubMed] [Google Scholar]
- Chowdhury R, Bois P, Feingold E, Sherman SL, Cheung VG. 2009. Genetic analysis of variation in human meiotic recombination. PLoS Genet 5: e1000648. [DOI] [PMC free article] [PubMed] [Google Scholar]
- Cingolani P, Platts A, Wang LL, Coon M, Nguyen T, Wang L, Land SJ, Lu X, Ruden DM. 2012. A program for annotating and predicting the effects of single nucleotide polymorphisms, SnpEff: SNPs in the genome of Drosophila melanogaster strain w1118; iso-2; iso-3. Fly 6: 80–92. [DOI] [PMC free article] [PubMed] [Google Scholar]
- Coop G, Przeworski M. 2007. An evolutionary view of human recombination. Nat Rev Genet 8: 23–34. [DOI] [PubMed] [Google Scholar]
- Crawford A, Dodds K, Ede A, Pierson C, Montgomery G, Garmonsway H, Beattie A, Davies K, Maddox J, Kappes S. 1995. An autosomal genetic linkage map of the sheep genome. Genetics 140: 703–724. [DOI] [PMC free article] [PubMed] [Google Scholar]
- Crismani W, Girard C, Froger N, Pradillo M, Santos JL, Chelysheva L, Copenhaver GP, Horlow C, Mercier R. 2012. FANCM limits meiotic crossovers. Science 336: 1588–1590. [DOI] [PubMed] [Google Scholar]
- Dehal P, Boore JL. 2005. Two rounds of whole genome duplication in the ancestral vertebrate. PLoS Biol 3: e314. [DOI] [PMC free article] [PubMed] [Google Scholar]
- Druet T, Georges M. 2010. A hidden Markov model combining linkage and linkage disequilibrium information for haplotype reconstruction and quantitative trait locus fine mapping. Genetics 184: 789–798. [DOI] [PMC free article] [PubMed] [Google Scholar]
- Druet T, Georges M. 2015. LINKPHASE3: an improved pedigree-based phasing algorithm robust to genotyping and map errors. Bioinformatics 31: 1677–1679. [DOI] [PubMed] [Google Scholar]
- Druet T, Ahariz N, Cambisano N, Tamma N, Michaux C, Coppieters W, Charlier C, Georges M. 2014. Selection in action: dissecting the molecular underpinnings of the increasing muscle mass of Belgian Blue Cattle. BMC Genomics 15: 796. [DOI] [PMC free article] [PubMed] [Google Scholar]
- Edelmann W, Cohen PE, Kneitz B, Winand N, Lia M, Heyer J, Kolodner R, Pollard JW, Kucherlapati R. 1999. Mammalian MutS homologue 5 is required for chromosome pairing in meiosis. Nat Genet 21: 123–127. [DOI] [PubMed] [Google Scholar]
- Finucane HK, Bulik-Sullivan B, Gusev A, Trynka G, Reshef Y, Loh P-R, Anttila V, Xu H, Zang C, Farh K. 2015. Partitioning heritability by functional annotation using genome-wide association summary statistics. Nat Genet 47: 1228–1235. [DOI] [PMC free article] [PubMed] [Google Scholar]
- Fledel-Alon A, Leffler EM, Guan Y, Stephens M, Coop G, Przeworski M. 2011. Variation in human recombination rates and its genetic determinants. PLoS One 6: e20321. [DOI] [PMC free article] [PubMed] [Google Scholar]
- Flint J, Mackay TF. 2009. Genetic architecture of quantitative traits in mice, flies, and humans. Genome Res 19: 723–733. [DOI] [PMC free article] [PubMed] [Google Scholar]
- The Gene Ontology Consortium. 2015. Gene Ontology Consortium: going forward. Nucleic Acids Res 43: D1049–D1056. [DOI] [PMC free article] [PubMed] [Google Scholar]
- Groenen MA, Wahlberg P, Foglio M, Cheng HH, Megens H-J, Crooijmans RP, Besnier F, Lathrop M, Muir WM, Wong GK-S. 2009. A high-density SNP-based linkage map of the chicken genome reveals sequence features correlated with recombination rate. Genome Res 19: 510–519. [DOI] [PMC free article] [PubMed] [Google Scholar]
- Guiraldelli MF, Eyster C, Wilkerson JL, Dresser ME, Pezza RJ. 2013. Mouse HFM1/Mer3 is required for crossover formation and complete synapsis of homologous chromosomes during meiosis. PLoS Genet 9: e1003383. [DOI] [PMC free article] [PubMed] [Google Scholar]
- Haldane JB. 1922. Sex ratio and unisexual sterility in hybrid animals. J Genet 12: 101–109. [Google Scholar]
- Holland PW, Garcia-Fernàndez J, Williams NA, Sidow A. 1994. Gene duplications and the origins of vertebrate development. Development 1994: 125–133. [PubMed] [Google Scholar]
- Hollingsworth NM, Ponte L, Halsey C. 1995. MSH5, a novel MutS homolog, facilitates meiotic reciprocal recombination between homologs in Saccharomyces cerevisiae but not mismatch repair. Genes Dev 9: 1728–1739. [DOI] [PubMed] [Google Scholar]
- Jantsch V, Pasierbek P, Mueller MM, Schweizer D, Jantsch M, Loidl J. 2004. Targeted gene knockout reveals a role in meiotic recombination for ZHP-3, a Zip3-related protein in Caenorhabditis elegans. Mol Cell Biol 24: 7998–8006. [DOI] [PMC free article] [PubMed] [Google Scholar]
- Johnston SE, Bérénos C, Slate J, Pemberton JM. 2016. Conserved genetic architecture underlying individual recombination rate variation in a wild population of Soay sheep (Ovis aries). Genetics 203: 583–598. [DOI] [PMC free article] [PubMed] [Google Scholar]
- Kemper KE, Goddard ME. 2012. Understanding and predicting complex traits: knowledge from cattle. Hum Mol Genet 21: R45–R51. [DOI] [PubMed] [Google Scholar]
- Kneitz B, Cohen PE, Avdievich E, Zhu L, Kane MF, Hou H, Kolodner RD, Kucherlapati R, Pollard JW, Edelmann W. 2000. MutS homolog 4 localization to meiotic chromosomes is required for chromosome pairing during meiosis in male and female mice. Genes Dev 14: 1085–1097. [PMC free article] [PubMed] [Google Scholar]
- Kohl KP, Sekelsky J. 2013. Meiotic and mitotic recombination in meiosis. Genetics 194: 327–334. [DOI] [PMC free article] [PubMed] [Google Scholar]
- Kong A, Barnard J, Gudbjartsson DF, Thorleifsson G, Jonsdottir G, Sigurdardottir S, Richardsson B, Jonsdottir J, Thorgeirsson T, Frigge ML. 2004. Recombination rate and reproductive success in humans. Nat Genet 36: 1203–1206. [DOI] [PubMed] [Google Scholar]
- Kong A, Thorleifsson G, Stefansson H, Masson G, Helgason A, Gudbjartsson DF, Jonsdottir GM, Gudjonsson SA, Sverrisson S, Thorlacius T. 2008. Sequence variants in the RNF212 gene associate with genome-wide recombination rate. Science 319: 1398–1401. [DOI] [PubMed] [Google Scholar]
- Kong A, Thorleifsson G, Frigge ML, Masson G, Gubjartsson DF, Villemoes R, Magnusdottir E, Olafsdottir SB, Thorsteinsdottir U, Stefansson K. 2014. Common and low-frequency variants associated with genome-wide recombination rate. Nat Genet 46: 11–16. [DOI] [PubMed] [Google Scholar]
- Lenormand T, Dutheil J. 2005. Recombination difference between sexes: a role for haploid selection. PLoS Biol 3: e63. [DOI] [PMC free article] [PubMed] [Google Scholar]
- Lipkin SM, Moens PB, Wang V, Lenzi M, Shanmugarajah D, Gilgeous A, Thomas J, Cheng J, Touchman JW, Green ED. 2002. Meiotic arrest and aneuploidy in MLH3-deficient mice. Nat Genet 31: 385–390. [DOI] [PubMed] [Google Scholar]
- Liu EY, Morgan AP, Chesler EJ, Wang W, Churchill GA, de Villena FP-M. 2014. High-resolution sex-specific linkage maps of the mouse reveal polarized distribution of crossovers in male germline. Genetics 197: 91–106. [DOI] [PMC free article] [PubMed] [Google Scholar]
- Lynn A, Koehler KE, Judis L, Chan ER, Cherry JP, Schwartz S, Seftel A, Hunt PA, Hassold TJ. 2002. Covariation of synaptonemal complex length and mammalian meiotic exchange rates. Science 296: 2222–2225. [DOI] [PubMed] [Google Scholar]
- Ma L, O'Connell JR, VanRaden PM, Shen B, Padhi A, Sun C, Bickhart DM, Cole JB, Null DJ, Liu GE. 2015. Cattle sex-specific recombination and genetic control from a large pedigree analysis. PLoS Genet 11: e1005387. [DOI] [PMC free article] [PubMed] [Google Scholar]
- Mercier R, Jolivet S, Vezon D, Huppe E, Chelysheva L, Giovanni M, Nogué F, Doutriaux M-P, Horlow C, Grelon M. 2005. Two meiotic crossover classes cohabit in Arabidopsis: One is dependent on MER3, whereas the other one is not. Curr Biol 15: 692–701. [DOI] [PubMed] [Google Scholar]
- Misztal I, Tsuruta S, Strabel T, Auvray B, Druet T, Lee D. 2002. BLUPF90 and related programs (BGF90). In Proceedings of the 7th world congress on genetics applied to livestock production, Vol. 28, pp. 21–22, Montpellier, France. [Google Scholar]
- Moen T, Hoyheim B, Munck H, Gomez-Raya L. 2004. A linkage map of Atlantic salmon (Salmo salar) reveals an uncommonly large difference in recombination rate between the sexes. Anim Genet 35: 81–92. [DOI] [PubMed] [Google Scholar]
- Morgan TH. 1912. Complete linkage in the second chromosome of the male of Drosophila. Science 36: 719–720. [Google Scholar]
- Morgan T. 1914. No crossing over in the male of Drosophila of genes in the second and third pairs of chromosomes. Biol Bull 26: 195–204. [Google Scholar]
- Muñoz M, Alves E, Ramayo-Caldas Y, Casellas J, Rodríguez C, Folch J, Silió L, Fernández A. 2012. Recombination rates across porcine autosomes inferred from high-density linkage maps. Anim Genet 43: 620–623. [DOI] [PubMed] [Google Scholar]
- Nakagawa T, Kolodner RD. 2002. Saccharomyces cerevisiae Mer3 is a DNA helicase involved in meiotic crossing over. Mol Cell Biol 22: 3281–3291. [DOI] [PMC free article] [PubMed] [Google Scholar]
- Neff MW, Broman KW, Mellersh CS, Ray K, Acland GM, Aguirre GD, Ziegle JS, Ostrander EA, Rine J. 1999. A second-generation genetic linkage map of the domestic dog, Canis familiaris. Genetics 151: 803–820. [DOI] [PMC free article] [PubMed] [Google Scholar]
- Nishant K, Chen C, Shinohara M, Shinohara A, Alani E. 2010. Genetic analysis of baker's yeast Msh4-Msh5 reveals a threshold crossover level for meiotic viability. PLoS Genet 6: e1001083. [DOI] [PMC free article] [PubMed] [Google Scholar]
- Ohno S. 1970. Evolution by gene duplication. Springer, New York. [Google Scholar]
- Pàldi A, Gyapay G, Jami J. 1995. Imprinted chromosomal regions of the human genome display sex-specific meiotic recombination frequencies. Curr Biol 5: 1030–1035. [DOI] [PubMed] [Google Scholar]
- Petkov PM, Broman KW, Szatkiewicz JP, Paigen K. 2007. Crossover interference underlies sex differences in recombination rates. Trends Genet 23: 539–542. [DOI] [PubMed] [Google Scholar]
- Petryszak R, Burdett T, Fiorelli B, Fonseca NA, Gonzalez-Porta M, Hastings E, Huber W, Jupp S, Keays M, Kryvych N. 2014. Expression Atlas update—a database of gene and transcript expression from microarray- and sequencing-based functional genomics experiments. Nucleic Acids Res 42: D926–D932. [DOI] [PMC free article] [PubMed] [Google Scholar]
- Price AL, Patterson NJ, Plenge RM, Weinblatt ME, Shadick NA, Reich D. 2006. Principal components analysis corrects for stratification in genome-wide association studies. Nat Genet 38: 904–909. [DOI] [PubMed] [Google Scholar]
- Reynolds A, Qiao H, Yang Y, Chen JK, Jackson N, Biswas K, Holloway JK, Baudat F, de Massy B, Wang J. 2013. RNF212 is a dosage-sensitive regulator of crossing-over during mammalian meiosis. Nat Genet 45: 269–278. [DOI] [PMC free article] [PubMed] [Google Scholar]
- Ross-Macdonald P, Roeder GS. 1994. Mutation of a meiosis-specific MutS homolog decreases crossing over but not mismatch correction. Cell 79: 1069–1080. [DOI] [PubMed] [Google Scholar]
- Sandor C, Li W, Coppieters W, Druet T, Charlier C, Georges M. 2012. Genetic variants in REC8, RNF212, and PRDM9 influence male recombination in cattle. PLoS Genet 8: e1002854. [DOI] [PMC free article] [PubMed] [Google Scholar]
- Santucci-Darmanin S, Neyton S, Lespinasse F, Saunières A, Gaudray P, Paquis-Flucklinger V. 2002. The DNA mismatch-repair MLH3 protein interacts with MSH4 in meiotic cells, supporting a role for this MutL homolog in mammalian meiotic recombination. Hum Mol Genet 11: 1697–1706. [DOI] [PubMed] [Google Scholar]
- Scheet P, Stephens M. 2006. A fast and flexible statistical model for large-scale population genotype data: applications to inferring missing genotypes and haplotypic phase. Am J Hum Genet 78: 629–644. [DOI] [PMC free article] [PubMed] [Google Scholar]
- Singer A, Perlman H, Yan Y, Walker C, Corley-Smith G, Brandhorst B, Postlethwait J. 2002. Sex-specific recombination rates in zebrafish (Danio rerio). Genetics 160: 649–657. [DOI] [PMC free article] [PubMed] [Google Scholar]
- Venn O, Turner I, Mathieson I, de Groot N, Bontrop R, McVean G. 2014. Strong male bias drives germline mutation in chimpanzees. Science 344: 1272–1275. [DOI] [PMC free article] [PubMed] [Google Scholar]
- Yang J, Benyamin B, McEvoy BP, Gordon S, Henders AK, Nyholt DR, Madden PA, Heath AC, Martin NG, Montgomery GW. 2010. Common SNPs explain a large proportion of the heritability for human height. Nat Genet 42: 565–569. [DOI] [PMC free article] [PubMed] [Google Scholar]
- Yang J, Lee SH, Goddard ME, Visscher PM. 2011. GCTA: a tool for genome-wide complex trait analysis. Am J Hum Genet 88: 76–82. [DOI] [PMC free article] [PubMed] [Google Scholar]
Associated Data
This section collects any data citations, data availability statements, or supplementary materials included in this article.