

Abstract
Context:
T deprivation increases risk of insulin resistance in men, but whether this risk is independent of changes in body composition is unknown. Further, the metabolic roles of T and its metabolite estradiol have not been clearly defined in men.
Objective:
This study sought to establish the effects of selective sex steroid withdrawal on insulin sensitivity in healthy men.
Design, Setting, and Participants:
This was a double-blinded, placebo-controlled, randomized trial at an academic medical center of 56 healthy men, 19–55 years of age.
Interventions:
Subjects received the GnRH antagonist acyline plus one of the following: placebo gel (Castrate), 1.25 g testosterone gel (Low T/E), 5 g testosterone gel (Normal T/E), or 5 g testosterone gel with letrozole (Normal T/Low E) daily for 4 weeks. Body composition and glucose tolerance were assessed at baseline and end of treatment.
Main Outcome Measure:
Insulin sensitivity was quantified by the Matsuda index.
Results:
Predicted circulating sex steroid concentrations were achieved in all treatment groups. The time-by-group interaction for Matsuda index did not achieve significance in overall repeated measures ANOVA (baseline vs week 4; P = .16). A significant time-by-group interaction was observed for fat mass (P = .003), with changes in fat mass attributable predominantly to estrogen exposure in linear regression analysis (P = .016). A time-by-group interaction also was observed for lean mass (P = .03) and influenced by androgen exposure (P = .003).
Conclusions:
Short-term sex steroid withdrawal in healthy men causes adverse changes in body composition. These findings support the role of estradiol as a determinant of adiposity in men.
Body composition and glucose tolerance were assessed in healthy men before and after short-term sex steroid withdrawal. Changes in body composition were due to both estrogen and androgen deprivation.
Type 2 diabetes mellitus (T2DM) affects 29.1 million people in the United States, and the U.S. Centers for Disease Control and Prevention projects that one in three U.S. adults will have diabetes by 2050 (1). Insulin resistance is a primary pathogenic feature of T2DM and an independent risk factor for cardiovascular disease (CVD) (2–4). Thus, understanding the mechanisms through which insulin resistance evolves is critical for improved strategies for the prevention and treatment of cardiometabolic disease.
Clinical data suggest that endogenous T may contribute to the regulation of insulin sensitivity in men. An inverse relationship between circulating total T levels and insulin resistance has been observed in men (5, 6), and prospective studies have demonstrated that men with low serum T levels are at increased risk for the development of T2DM (7). Older men undergoing androgen deprivation therapy (ADT) for the treatment of prostate cancer exhibit elevated risk of T2DM, CVD, and metabolic syndrome relative to controls matched for age and disease status (8–10). Notably, prospective studies of men receiving ADT have found significant increases in insulin resistance within only 12–24 weeks of treatment (11, 12), and it has been hypothesized that worsened insulin resistance in these men underlies subsequent risk of T2DM, CVD, and associated mortality (13). However, although physiologic T replacement has been shown to improve insulin sensitivity in some studies of hypogonadal men (14, 15), the results of intervention trials are mixed (16, 17).
The mechanisms whereby T may contribute to the regulation of insulin sensitivity in men remain poorly understood. T deprivation in men leads to increased adiposity and reduced lean mass, both of which are reversed with exogenous T therapy (18, 19). T may influence insulin sensitivity in part through mediating changes in body composition both independently and via aromatization to estradiol. Interestingly, withdrawal of T replacement in men with idiopathic hypogonadotropic hypogonadism led to a significant decline in insulin sensitivity within 2 weeks in the absence of changes in body weight (20). Similarly, we observed increased insulin resistance in healthy men within 4 weeks of experimental medical castration (21). The rapidity of these changes suggests that T withdrawal may reduce insulin sensitivity prior to any changes in body composition, although this has not been tested. Recent evidence suggests that estradiol is a key regulator of adiposity in men (19), adding further complexity to the relationships among sex steroids, insulin sensitivity and body composition. Studies of medical castration, which results in both androgen and estrogen deficiency, lack the specificity to determine the independent effects of androgens and estradiol on metabolic endpoints.
We performed a randomized, placebo-controlled intervention study to determine the respective effects of partial and complete short-term T deprivation on insulin sensitivity and body composition in healthy, eugonadal men. T replacement was administered both in the presence and absence of an aromatase inhibitor (to block the conversion of T to estradiol) to discriminate between the androgen- and estrogen-mediated effects of T withdrawal.
Materials and Methods
Subjects
Fifty-six healthy male volunteers were enrolled in the study. The study enrollment goal was 60 to ensure 48 (n = 12 per group) subjects completed all study visits and related procedures, given that this would provide 80% power to detect a difference of at least 25% in the change in insulin sensitivity between any two groups, at an alpha error of 0.05.
Written informed consent was obtained prior to screening. Specific inclusion criteria included a prostate-specific antigen ≤ 3 ng/mL, age 19–55 years, ability to understand the study and study procedures and provide informed consent, serum total T > 300 ng/dL, and an International Prostate Symptom Score < 11.
Exclusion criteria included use of T or glucocorticoids within 3 months of screening; prostate-specific antigen > 3 ng/mL; body mass index (BMI) > 33 kg/m2; uncontrolled hypertension; clinically significant abnormal laboratory results; comorbidities including diabetes, cancer, or heart disease; use of illicit drugs or alcohol abuse; a history of bleeding disorders or current anticoagulant use; and untreated sleep apnea. The study protocol was approved by the Institutional Review Board of the University of Washington.
Research design
All subjects received 300 mcg/kg of the GnRH antagonist acyline subcutaneously, at weeks 0 and 2, to suppress endogenous gonadal steroid production. Subjects were assigned by block randomization with a block size of four to one of the following drug regimens: 1) placebo topical gel and an oral placebo tab daily (Castrate), 2) low-dose, 1.25 g of a topical 1.62% T gel (AndroGel, AbbVie Inc.) and an oral placebo tab daily (Low T/E), 3) replacement-dose, 5 g of T gel and an oral placebo tab daily (Normal T/E), or 4) 5 g of T gel with 5 mg of the oral aromatase inhibitor letrozole (Apotex Corporation) daily (Normal T/Low E). The drug treatment period was 4 weeks. Both subjects and investigators were blinded to treatment group.
Study visits were conducted at weeks 0, 2, 4, and 10; the week-10 visit was a recovery visit. At each visit, vital signs and adverse events were monitored, and morning fasting blood samples were collected for hormonal and routine laboratory assessments; these included gonadal steroid concentrations, fasting glucose and insulin levels, liver function tests, serum chemistries, and a complete blood count. At baseline, week 4, and week 10, body composition was assessed using dual-energy x-ray absorptiometry (DXA), and a 75-g frequently sampled oral glucose tolerance test (OGTT) was conducted between 0900 and 1000 hours after a 10- to 12-hour overnight fast. Plasma glucose and insulin concentrations were measured at 0, 15, 30, 60, 90, 120, and 180 minutes after glucose ingestion.
Analytical techniques
Blood samples for measurement of sex steroids were obtained from subjects between 7000 and 1130 hours. T and estradiol were quantified from fresh-frozen plasma stored at −70°C using liquid chromatography–tandem mass spectrometry. Samples were analyzed on an AB Sciex 5500 QTRAP tandem quadrupole mass spectrometer using positive electrospray ionization (AB Sciex) through modified methods described previously (22). Quantification of T has been validated by the U.S. Centers or Disease Control and Prevention using certified reference materials. The lower limit of quantification for T and estradiol are 5 and 2 pg/mL, respectively. The intra-assay coefficients of variation were <5% for both assays. SHBG concentrations were quantified by immunofluorometric assay, and free T was calculated as described by Södergard (23).
Serum glucose levels were measured enzymatically using Roche reagents on a Roche Module P Chemistry autoanalyzer (Roche Diagnostics, Inc.) with intra- and interassay coefficients of variation of ≤1.1% and ≤1.7%, respectively. Serum insulin concentrations were measured by a two-site immuno-enzymometric assay on a TOSOH 2000 autoanalyzer (TOSOH Bioscience, Inc.), with an inter and intra-assay coefficients of variation ≤2.8%. Whole-body composition was analyzed through Lunar iDXA, software version 14.1 (General Electric). Based on the respective precision errors of 0.25 and 0.15 kg for fat mass and total body mass, the least significant change for each metric was 0.68 and 0.42 kg, respectively.
Outcomes and assessments
The primary outcome variable was change in insulin sensitivity quantified by the Matsuda index (24). Secondary outcomes included changes in insulin resistance determined by homeostasis model assessment of insulin resistance (HOMA-IR) (25), the insulinogenic index (IGI; Δ insulin0–30/Δ glucose0–30), changes in β-cell function quantified by the oral DI (IGI × Matsuda index) (26, 27), glucose area under the curve (AUCglucose) during OGTT, and changes in fat and lean mass, as measured by DXA.
Subjects noncompliant with study medication were not included in the analyses per protocol. Compliance was defined as at least 80% use of study medication and monitored through collection of all gel bottles and pill packets at the end of the treatment period and review of drug diaries maintained by subjects. Total administration of gel was determined by measuring bottle weights before and after the drug treatment period. Only subjects who completed all study visits were included in the final analyses.
Statistical analysis
Normality of primary and secondary outcome measures was evaluated by Shapiro-Wilk test, and log transformation was performed for all nonnormally distributed data. Serum total and free T, weight, fat mass, lean mass, AUCglucose, percent fat mass, and percent lean mass were normally distributed. The outcome variables serum estradiol, Matsuda index, HOMA-IR, IGI, and DI were log transformed. Differences among groups at baseline were evaluated by one-way ANOVA. Repeated-measures ANOVA (RM-ANOVA) was the primary analysis performed to evaluate the interaction between time and treatment group for each outcome measure. Significant findings in overall RM-ANOVA were followed up post hoc by multiple linear regression analysis to assess the individual effect of androgen and estrogen withdrawal. Post-hoc analyses also were performed to determine within-group changes in body composition using paired Student t test with an adjusted P-value threshold of ≤ .0125 for statistical significance. Data were analyzed using GraphPad Prism version 6 (GraphPad, Inc.) and SPSS Statistics 23 (IBM Corporation). A P ≤ .05 was considered statistically significant for all analyses except as noted otherwise. Results are presented as mean ± SD for normally distributed variables and median (interquartile range) for all other variables. Unstandardized β-coefficient values are shown.
Results
Baseline characteristics and study completion
One hundred and sixteen volunteers were screened, and 60 failed screening (Figure 1). The most common reasons for screening failure were abnormal laboratory values and baseline BMI greater than 33 kg/m2. A total of 56 subjects were enrolled, and 50 completed all study-related visits and procedures. Four subjects withdrew from the study prior to drug initiation, and a subject from the Low T/E group withdrew following the week 2 visit for personal reasons. One subject from the Castrate group was found to have diabetes mellitus based on a 2-hour OGTT glucose level > 200 mg/dL at baseline and was excluded from the analyses. Four additional subjects were excluded for noncompliance with study drug. Final analyses included 45 subjects: 10 in the Castrate group, 11 each in the Low T/E and Normal T/E groups, and 13 in the Normal T/-E group. At baseline, median (interquartile range [IQR]) age among the subjects was 36 (29–48) years and median BMI was 25 (23–28) kg/m2. Baseline characteristics including weight, fasting glucose, gonadotropins, serum sex steroids, percentage body fat, and percentage lean mass were comparable among the four groups (Table 1).
Figure 1.

Recruitment of subjects and study completion.
Table 1.
Baseline Characteristics of Study Subjects
| Characteristic | Study Group (T Gel Dose ± Aromatase Inhibitor) |
P-Value | |||
|---|---|---|---|---|---|
| Castrate (0 g/d) | Low T/E (1.25 g/d) | Normal T/E (5 g/d) | Normal T/Low E (5 g/d + AI) | ||
| n | 10 | 11 | 11 | 13 | |
| Age, y | 37 (27–51) | 35 (27–45) | 42 (31–51) | 34 (28–45) | .793 |
| Weight, kg | 82 ± 14 | 81 ± 15 | 78 ± 8 | 82 ± 11 | .894 |
| BMI, kg/m2 | 26 ± 4 | 26 ± 4 | 25 ± 2 | 25 ± 4 | .892 |
| Fasting glucose, mg/dL | 97 ± 6 | 97 ± 13 | 101 ± 7 | 98 ± 9 | .736 |
| Fasting insulin, μU/mL | 4.4 (3.0–6.0) | 4.8 (1.7–11.8) | 4.7 (2.8–6.3) | 2.6 (2.0–5.0) | .328 |
| HOMA-IR | 1.1 (0.7–1.4) | 1.1 (0.4–3.2) | 1.2 (0.6–1.7) | 0.7 (0.5–1.2) | .388 |
| Matsuda index of insulin sensitivity | 6.8 (5.7–7.5) | 6.4 (2.9–19.0) | 8.2 (4.1–11.0) | 11.0 (7.3–14.0) | .343 |
| Total T, ng/mL | 4.9 ± 1.6 | 5.4 ± 1.6 | 4.9 ± 1.4 | 6.1 ± 1.8 | .240 |
| Calculated free T, ng/dL | 11.4 ± 4.1 | 9.9 ± 2.0 | 9.7 ± 3.8 | 11.8 ± 3.8 | .379 |
| SHBG, μg/dL | 246 ± 83 | 372 ± 166 | 330 ± 104 | 392 ± 205 | .135 |
| Estradiol, pg/mL | 25 (18–31) | 27 (24–31) | 26 (19–29) | 27 (23–29) | .499 |
| Fat mass, % | 28 ± 7 | 23 ± 6 | 24 ± 4 | 23 ± 7 | .242 |
| Lean mass, % | 68 ± 7 | 73 ± 5 | 72 ± 4 | 73 ± 7 | .278 |
| Fat mass, kg | 24 ± 10 | 20 ± 6 | 19 ± 3 | 20 ± 8 | .400 |
| Lean mass, kg | 55 ± 6 | 60 ± 10 | 57 ± 8 | 59 ± 6 | .471 |
Abbreviation: AI, aromatase inhibitor.
Baseline data are presented as mean ± sd for normally distributed data and median (IQR) for nonnormally distributed data.
Serum hormone concentrations
As expected, acyline administration suppressed serum LH and follicular stimulating hormone (FSH) in all four groups (Supplemental Figure 1, A and B). Significant differences in serum total T (P = .005 in overall RM-ANOVA) and estradiol (P < .0001) concentrations among the four groups were achieved at week 2 (Figure 2, A and B). Serum total T levels in the Castrate group decreased from 4.9 ± 1.5 ng/mL (mean ± SD) at baseline to 0.98 ± 1.5 ng/mL at week 2. Serum levels of 17β-estradiol were similarly suppressed and decreased from 25 (18–31) to 5 (3–9) pg/mL. In the Low T/E group, serum total T levels were 5.4 ± 1.6 ng/mL at baseline and decreased to 3.0 ± 1.1 ng/mL after 2 weeks of treatment. Serum 17β-estradiol concentrations in the Low T/E group also declined markedly from 27 (24–31) to 12 (9–15) pg/mL. The Normal T/E and Normal T/Low E groups maintained serum total T levels comparable to baseline values and within the normal range at week 2 (5.6 ± 3.9 and 5.2 ± 2.7 ng/mL, respectively). Whereas the Normal T/E group subjects also maintained normal serum estradiol levels (16 [12–44] pg/mL) during treatment, administration of the aromatase inhibitor letrozole resulted in significant suppression of serum estradiol concentrations in Normal T/Low E group subjects (2 [0–3] pg/mL) at week 2. Serum sex steroid levels were similar at weeks 2 and 4 and recovered to baseline, normal levels in all experimental groups by week 10. Serum free T concentrations showed similar magnitude of change relative to changes in total T levels (Supplemental Figure 2), given that SHBG concentrations did not change significantly during the study (data not shown).
Figure 2.
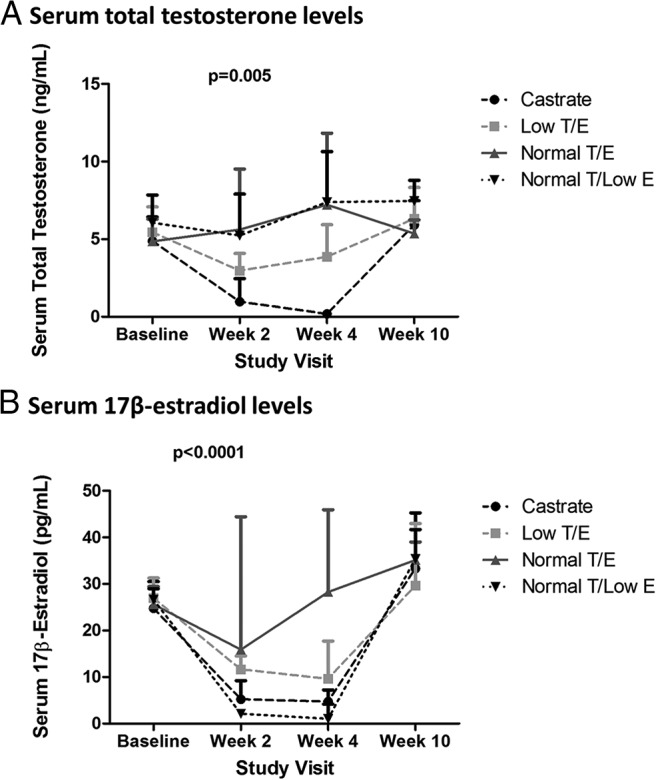
Serum sex steroid concentrations. Intended serum sex steroid concentrations were achieved during treatment. Results presented are mean + SD for free T and median + interquartile range for serum estradiol.
Glucose tolerance and its determinants
At baseline, all subjects had normal insulin sensitivity (Table 1). During the treatment period, a time-by-group interaction was not observed for the primary study endpoint, insulin sensitivity as measured by the Matsuda index (P = .16 in overall RM-ANOVA, Table 2). Insulin resistance, given that calculated by HOMA-IR, also did not differ among treatment groups over the treatment period (P = .14 in overall RM-ANOVA). Consistent with the comparable degree of insulin sensitivity among groups, no differences in pancreatic β-cell function were evident as quantified by the IGI (P = .66 in overall RM-ANOVA). Thus, the oral disposition index (DI), the product of insulin sensitivity and IGI, did not vary as a function of treatment group, nor did glucose tolerance as assessed by AUCglucose values during the OGTT (P = .865 in overall RM-ANOVA).
Table 2.
Indices of Glucose Homeostasis
| Index | Castrate | Low T/E | Normal T/E | Normal T/Low E | P-Value (Time) | P-Value (Time × Group) |
|---|---|---|---|---|---|---|
| Matsuda Index | .608 | .164 | ||||
| Baseline | 6.8 (5.7–7.5) | 6.4 (2.9–19) | 8.2 (4.1–11.0) | 11 (7.3–14.0) | ||
| Week 4 | 5.0 (3.9–6.3) | 9.4 (4.5–14.0) | 7.2 (4.6–15.0) | 7.3 (5.9–10.0) | ||
| IGI | .022 | .659 | ||||
| Baseline | 0.8 (0.5–1.0) | 0.7 (0.3–1.4) | 0.5 (0.3–0.8) | 0.5 (0.4–0.7) | ||
| Week 4 | 0.7 (0.6–1.0) | 0.7 (0.5–0.8) | 0.6 (0.4–0.9) | 0.9 (0.4–1.0) | ||
| DI | .081 | .288 | ||||
| Baseline | 4.9 (3.4–6.1) | 3.4 (2.2–7.8) | 3.7 (1.9–6.0) | 6.0 (3.4–6.7) | ||
| Week 4 | 3.7 (2.8–5.1) | 6.4 (3.9–8.7) | 4.8 (2.0–7.0) | 6.4 (5.3–7.5) | ||
| HOMA-IR | .700 | .138 | ||||
| Baseline | 1.1 (0.7–1.4) | 1.1 (0.4–3.2) | 1.2 (0.6–1.7) | 0.7 (0.5–1.2) | ||
| Week 4 | 1.7 (1.0–1.9) | 0.8 (0.5–1.3) | 1.0 (0.6–1.2) | 0.9 (0.6–1.5) | ||
| 3-h AUCglucose (mg/dL × min) | .275 | .865 | ||||
| Baseline | 17 127 ± 1829 | 16 520 ± 3475 | 17 412 ± 2347 | 16 278 ± 2772 | ||
| Week 4 | 16 796 ± 2664 | 15 686 ± 2264 | 17 472 ± 3158 | 15 629 ± 1846 |
Data are presented as mean ± sd for normally distributed data and median (IQR) for nonnormally distributed data. P-values represent results of overall RM-ANOVA.
Although one-way ANOVA did not demonstrate statistically significant differences in baseline insulin sensitivity across study groups, small intergroup baseline differences could affect end-of-treatment analyses. Accordingly, analyses were repeated with baseline values included as a covariate. With this model, a time-by-group interaction was evident as a statistical trend for Matsuda index (P = .09 in overall RM-ANOVA for baseline and week 4). Similarly, the time-by-group interaction achieved statistical significance for HOMA-IR after accounting for baseline HOMA-IR (P = .04 in overall RM-ANOVA).
Body composition parameters
In all treatment groups, body weight remained stable over the 4-week study intervention (Supplemental Table 1). However, significant differences were observed across groups in the change in fat mass over time (P = .003 in overall RM-ANOVA; Figure 3A). Post-hoc analyses demonstrated significant increases in fat mass within the Castrate group between baseline and week 4 (+1.1 ± 0.8 kg; P = .004). Smaller increments in fat mass were evident in the Low T/E and Normal T/Low E groups (+0.7 ± 0.8 kg and +0.5 ± 0.8 kg, respectively), although these changes did not reach statistical significance after correction for multiple comparisons. No change in fat mass was seen in the Normal T/E group (−0.4 ± 1.0 kg; P = not significant). Significant differences in fat mass similarly were evident when expressed as a percentage of total body mass (P < .0001 in overall RM-ANOVA, Supplemental Figure 3A).
Figure 3.
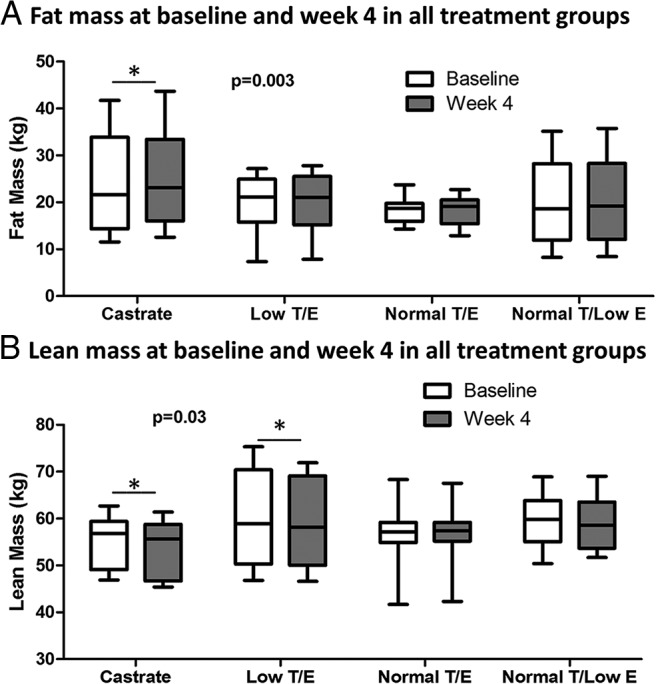
Changes in body composition over the treatment period by group. Significant differences across groups were found for fat mass (A) and lean mass (B). P-values represent results of overall RM-ANOVA. Asterisks indicate significant within-group changes over time as determined through post-hoc analyses with an adjusted P-value threshold of ≤ .0125 for statistical significance. Whiskers represent minimum and maximum values.
Significant differences also were seen in lean mass across treatment groups (P = .03 in overall RM-ANOVA for baseline and week 4; Figure 3B). In post-hoc analyses, decreases in lean mass between baseline and week 4 were significant in the Castrate group (−1.2 ± 1.0 kg; P = .003) and evident uniformly across subjects in this group. A significant decline in lean mass also was seen in the Low T/E group (−1.4 ± 1.5 kg; P = .01). Lean mass was unchanged in the Normal T/E and Normal T/Low E groups. Differences in lean mass expressed as a percentage of total body mass similarly were apparent among the treatment groups (P < .0001 in overall RM-ANOVA, Supplemental Figure 3B).
Post-hoc linear regression analysis suggested that changes in serum estradiol but not T concentrations were a significant determinant of changes in fat mass between baseline and week 4 (β-coefficient = −0.28 per 10 pg/mL change in serum 17β-estradiol; P = .016). In contrast, changes in serum T levels associated with changes in lean mass (β-coefficient = 0.14 per 1 ng/mL change in serum T; P = .003).
Significant time-by-group interactions were evident for fat mass (P = .001 in overall RM-ANOVA) and lean mass (P = .03 in overall RM-ANOVA) when baseline, week 4, and week 10 time points were analyzed together (Supplemental Figure 4, A and B). Strikingly, between week 4 (end-of-treatment) and the week 10 recovery visit, subjects in the Castrate group exhibited a significant, progressive increase in fat mass (+1.9 ± 0.6 kg; P < .0001). All groups had returned to baseline lean mass by the week 10 recovery visit.
Discussion
This study demonstrates that significant body composition changes occur in healthy, eugonadal men after only 4 weeks of sex-steroid deprivation. Significant changes in fat mass were observed and attributable to estrogen withdrawal. Concurrently, decreases in lean mass occurred consequent to androgen withdrawal. Notably, however, these unexpectedly rapid changes in body composition prevented direct address of our original hypothesis that sex steroids contribute to the regulation of insulin sensitivity in men independent of body composition. These findings nonetheless support important metabolic roles for both androgens and estrogens in men and demonstrate negative effects of even partial sex steroid deprivation over a short duration.
Prior studies have demonstrated decreased lean mass and increased fat mass in healthy men following suppression of gonadal sex steroid production, but these studies employed longer treatment periods of 12–16 weeks (12, 19). Our findings demonstrate that body composition changes are evident within only 4 weeks of sex steroid withdrawal. Similar to the recent study by Finkelstein et al (19), our results also suggest that estradiol plays an important role in the regulation of adiposity in men, whereas androgen exposure was not a significant determinant of changes in fat mass. Notably, differences in fat mass among the treatment groups persisted throughout the recovery period, particularly evident in the Castrate group, suggesting that the detrimental metabolic effects of severe sex steroid deprivation may not be immediately reversible. Although we cannot rule out the possibility that the hormonal effects of castration were prolonged, the effects of acyline have been shown to be reversed within 14–16 days of injection with normalization of serum T levels by 21 days postinjection (29), so these continued differences in adiposity likely occurred despite restoration of normal circulating sex steroid levels. T exposure may influence motivation, mood, and physical activity in men (30); thus, resultant findings could reflect behavioral changes resulting from sex steroid manipulation. Although subjects were instructed to maintain their usual diet and activity level, behavioral data were not collected in our study. Thus, uncaptured differences in behavior across groups also could have confounded findings, and future studies will control for altered patterns of diet and/or activity consequent to treatment.
Previous studies have found increased insulin resistance after androgen withdrawal in men, including studies of men undergoing ADT for treatment of prostate cancer (12). ADT worsens glycemic control in men with diabetes and reduces insulin sensitivity in nondiabetic men (9, 12). Similarly, in men with idiopathic hypogonadotropic hypogonadism, acute androgen withdrawal of only 2 weeks yielded increases in fasting insulin levels and greater insulin resistance (20). We previously have shown that acute T deprivation led to significant increases in HOMA-IR in a small cohort of young, healthy, eugonadal men (21). In the present study, however, no significant differences in insulin resistance were observed. These discrepant results may be attributable, in part, to differences across the populations studied including age, developmental exposure to sex steroids, and perhaps baseline BMI. Importantly, the present findings are limited to healthy men, and the metabolic effects of short-term sex steroid deprivation could differ among men with extant insulin resistance, T2DM, or other baseline metabolic dysregulation.
An alternative explanation for these apparently discrepant findings is that treatment effects in our current study were obscured by unexpectedly high baseline variance in Matsuda index and HOMA-IR. Our randomization strategy did not result in equal distribution of variance across treatment groups, which may have compromised our ability to capture small changes in insulin sensitivity. Supporting this possibility, time-by-group interactions for both indices became evident in sensitivity analyses that included baseline values. Treatment effects on insulin sensitivity also may have been missed as a result of our small sample size; thus, our study may have been inadequately powered. Finally, insulin sensitivity was assessed through oral glucose tolerance testing, a less-sensitive method than the gold standard of the hyperinsulinemic-euglycemic clamp. More sensitive measurement of insulin sensitivity could capture smaller changes that nonetheless may be clinically important.
Notably, Rabiee et al (31) employed an insulin clamp and found no significant changes in insulin sensitivity in men subject to 4 weeks of medical castration. However, Rabiee et al did not observe any changes in body composition, which may in part be attributable to lesser suppression of serum estradiol levels relative to that achieved in our current study. Collectively, then, these findings suggest that regulation of insulin sensitivity by sex steroids may be mediated indirectly through changes in body composition rather than through direct effects on peripheral insulin signaling. Further work is therefore needed to elucidate potential body composition–independent regulation of insulin sensitivity by sex steroids. Future studies will require even shorter duration, larger sample size, and, ideally, use of the insulin clamp.
Our study design benefitted from use of a GnRH antagonist to achieve short-term sex steroid suppression, thus avoiding the transient flare in sex steroids that may be seen with the use of GnRH agonists. Further, different doses of T add-back enabled modeling of the respective metabolic effects of physiologic hypogonadism and medical castration. Finally, although no group in our study was rendered selectively deficient in androgens, our analytic approach nonetheless enabled reasonable attribution of any observed effects to androgens, estrogens, or both.
In conclusion, our findings suggest that even a very brief period of sex-steroid deprivation causes metabolic perturbations characterized predominantly by increased adiposity without changes in body weight. Changes in body composition are apparent with partial as well as complete sex steroid withdrawal, and findings fail to demonstrate body composition–independent effects of sex-steroid deprivation on insulin sensitivity. Our results are consistent with previous data demonstrating a substantial role of estradiol in the regulation of adiposity in men and show for the first time that changes in fat mass are evident as soon as 4 weeks after estrogen withdrawal. Further, our findings suggest that even transient sex-steroid deficiency may yield metabolic aberrations that persist beyond normalization of circulating sex-steroid levels. Thus, these data add to a growing body of evidence demonstrating the metabolic harm of sex-steroid deprivation in men, even of short duration, and suggest contributory roles of both androgen and estrogen deficiency.
Acknowledgments
AbbVie Inc. supplied the T and placebo gel. Study visits were performed in the Clinical Research Center of University of Washington Medical Center. We thank all research volunteers for their participation in this study; the study team: Marilyn Busher, Connie Pete, and Dorothy McGuinness for assistance with study visits and sample processing; Janice Yamauchi and Sheree Miller for study blinding and study drug counseling; and Danielle Yancey for performing the DEXA scans. We are grateful to Genecelle Delossantos and Kathy Winter for coordinating the study. Without the effort of the study participants and study staff, these analyses would not have been possible.
This study was registered in ClinicalTrials.gov as trial number NCT01686828.
Transdermal T gel and placebo gel were provided at no cost to the study by AbbVie Inc. (Chicago, IL), as an investigator-initiated grant. AbbVie Inc. had no input into the study design or conduct, data analyses, or manuscript preparation and provided no other financial support for the study. K.B.R. is supported by the American Heart Association Clinical Research Program and the Eunice Kennedy Shriver National Institute of Child Health and Development (6K12 HD053984). S.T.P. is supported by the Eunice Kennedy Shriver National Institute of Child Health and Development (HD042454), the National Institute of Aging (RO1AG037603), and the Robert McMillen Professorship in Lipid Research. J.C. received support through the National Institute of Diabetes and Digestive and Kidney Diseases (T32DK007247–37). A.M.M. is supported by the Department of Veterans Affairs.
Disclosure Summary: J.C., K.B.R., M.K., J.K.A., and A.M.M. have nothing to disclose. S.T.P. has received drug supplies for an investigator-initiated study from Besins Healthcare (Bangkok, Thailand).
Footnotes
- ADT
- androgen deprivation therapy
- BMI
- body mass index
- CVD
- cardiovascular disease
- DI
- disposition index
- DXA
- dual-energy x-ray absorptiometry
- HOMA-IR
- homeostasis model assessment of insulin resistance
- IGI
- insulinogenic index
- OGTT
- oral glucose tolerance test
- RM
- repeated measures
- T2DM
- type 2 diabetes mellitus.
References
- 1. U.S. Centers for Disease Control and Prevention National Diabetes Statistics Report, 2014. 2014. Atlanta, GA: U.S. Dept. of Health and Human Services, Centers for Disease Control and Prevention. [Google Scholar]
- 2. Després JP, Lamarche B, Mauriège P, et al. Hyperinsulinemia as an independent risk factor for ischemic heart disease. N Engl J Med. 1996;334(15):952–957. [DOI] [PubMed] [Google Scholar]
- 3. Pyörälä M, Miettinen H, Laakso M, Pyörälä K. Hyperinsulinemia predicts coronary heart disease risk in healthy middle-aged men: The 22-year follow-up results of the Helsinki Policemen Study. Circulation. 1998;98(5):398–404. [DOI] [PubMed] [Google Scholar]
- 4. DeFronzo RA, Ferrannini E. Insulin resistance. A multifaceted syndrome responsible for NIDDM, obesity, hypertension, dyslipidemia, and atherosclerotic cardiovascular disease. Diabetes Care. 1991;14(3):173–194. [DOI] [PubMed] [Google Scholar]
- 5. Pitteloud N, Hardin M, Dwyer AA, et al. Increasing insulin resistance is associated with a decrease in Leydig cell testosterone secretion in men. J Clin Endocrinol Metab. 2005;90(5):2636–2641. [DOI] [PubMed] [Google Scholar]
- 6. Pitteloud N, Mootha VK, Dwyer AA, et al. Relationship between testosterone levels, insulin sensitivity, and mitochondrial function in men. Diabetes Care. 2005;28(7):1636–1642. [DOI] [PubMed] [Google Scholar]
- 7. Ding EL, Song Y, Malik VS, Liu S. Sex differences of endogenous sex hormones and risk of type 2 diabetes: A systematic review and meta-analysis. JAMA. 2006;295(11):1288–99. [DOI] [PubMed] [Google Scholar]
- 8. Keating NL, O'Malley AJ, Freedland SJ, Smith MR. Diabetes and cardiovascular disease during androgen deprivation therapy: Observational study of veterans with prostate cancer. J Natl Cancer Inst. 2010;102(1):39–46. [DOI] [PMC free article] [PubMed] [Google Scholar]
- 9. Derweesh IH, Diblasio CJ, Kincade MC, et al. Risk of new-onset diabetes mellitus and worsening glycaemic variables for established diabetes in men undergoing androgen-deprivation therapy for prostate cancer. BJU Int. 2007;100(5):1060–1065. [DOI] [PubMed] [Google Scholar]
- 10. Braga-Basaria M, Dobs AS, Muller DC, et al. Metabolic syndrome in men with prostate cancer undergoing long-term androgen-deprivation therapy. J Clin Oncol. 2006;24(24):3979–3983. [DOI] [PubMed] [Google Scholar]
- 11. Smith JC, Bennett S, Evans LM, et al. The effects of induced hypogonadism on arterial stiffness, body composition, and metabolic parameters in males with prostate cancer. J Clin Endocrinol Metab. 2001;86(9):4261–4267. [DOI] [PubMed] [Google Scholar]
- 12. Smith MR, Lee H, Nathan DM. Insulin sensitivity during combined androgen blockade for prostate cancer. J Clin Endocrinol Metab. 2006;91(4):1305–1308. [DOI] [PubMed] [Google Scholar]
- 13. Shahani S, Braga-Basaria M, Basaria S. Androgen deprivation therapy in prostate cancer and metabolic risk for atherosclerosis. J Clin Endocrinol Metab. 2008;93(6):2042–2049. [DOI] [PubMed] [Google Scholar]
- 14. Simon D, Charles MA, Lahlou N, et al. Androgen therapy improves insulin sensitivity and decreases leptin level in healthy adult men with low plasma total testosterone: A 3-month randomized placebo-controlled trial. Diabetes Care. 2001;24(12):2149–51. [DOI] [PubMed] [Google Scholar]
- 15. Jones TH. Effects of testosterone on Type 2 diabetes and components of the metabolic syndrome. J Diabetes. 2010;2(3):146–156. [DOI] [PubMed] [Google Scholar]
- 16. Liu PY, Wishart SM, Celermajer DS, et al. Do reproductive hormones modify insulin sensitivity and metabolism in older men? A randomized, placebo-controlled clinical trial of recombinant human chorionic gonadotropin. Eur J Endocrinol. 2003;148(1):55–66. [DOI] [PubMed] [Google Scholar]
- 17. Grossmann M, Hoermann R, Wittert G, Yeap BB. Effects of testosterone treatment on glucose metabolism and symptoms in men with type 2 diabetes and the metabolic syndrome: A systematic review and meta-analysis of randomized controlled clinical trials. Clin Endocrinol (Oxf). 2015;83(3):344–351. [DOI] [PubMed] [Google Scholar]
- 18. Spitzer M, Huang G, Basaria S, Travison TG, Bhasin S. Risks and benefits of testosterone therapy in older men. Nat Rev Endocrinol. 2013;9(7):414–424. [DOI] [PubMed] [Google Scholar]
- 19. Finkelstein JS, Lee H, Burnett-Bowie SA, et al. Gonadal steroids and body composition, strength, and sexual function in men. N Engl J Med. 2013;369(11):1011–1022. [DOI] [PMC free article] [PubMed] [Google Scholar]
- 20. Yialamas MA, Dwyer AA, Hanley E, Lee H, Pitteloud N, Hayes FJ. Acute sex steroid withdrawal reduces insulin sensitivity in healthy men with idiopathic hypogonadotropic hypogonadism. J Clin Endocrinol Metab. 2007;92(11):4254–4259. [DOI] [PubMed] [Google Scholar]
- 21. Rubinow KB, Snyder CN, Amory JK, Hoofnagle AN, Page ST. Acute testosterone deprivation reduces insulin sensitivity in men. Clin Endocrinol (Oxf). 2012;76(2):281–288. [DOI] [PMC free article] [PubMed] [Google Scholar]
- 22. Mostaghel EA, Nelson PS, Lange P, et al. Targeted androgen pathway suppression in localized prostate cancer: A pilot study. J Clin Oncol. 2014;32(3):229–237. [DOI] [PMC free article] [PubMed] [Google Scholar]
- 23. Södergård R, Bäckström T, Shanbhag V, Carstensen H. Calculation of free and bound fractions of testosterone and estradiol-17 beta to human plasma proteins at body temperature. J Steroid Biochem. 1982;16(6):801–810. [DOI] [PubMed] [Google Scholar]
- 24. Matsuda M., DeFronzo R.A. Insulin sensitivity indices obtained from oral glucose tolerance testing: Comparison with the euglycemic insulin clamp. Diabetes Care. 1999;22(9):1462–1470. [DOI] [PubMed] [Google Scholar]
- 25. Wallace TM, Levy JC, Matthews DR. Use and abuse of HOMA modeling. Diabetes Care. 2004;27(6):1487–1495. [DOI] [PubMed] [Google Scholar]
- 26. Utzschneider KM, Prigeon RL, Faulenbach MV, et al. Oral disposition index predicts the development of future diabetes above and beyond fasting and 2-h glucose levels. Diabetes Care. 2009;32(2):335–341. [DOI] [PMC free article] [PubMed] [Google Scholar]
- 27. Goedecke JH, Dave JA, Faulenbach MV, et al. Insulin response in relation to insulin sensitivity: An appropriate beta-cell response in black South African women. Diabetes Care. 2009;32(5):860–865. [DOI] [PMC free article] [PubMed] [Google Scholar]
- 28. Kelly DM, Jones TH. Testosterone and obesity. Obes Rev. 2015;16(7):581–606. [DOI] [PubMed] [Google Scholar]
- 29. Herbst KL, Coviello AD, Page S, Amory JK, Anawalt BD, Bremner WJ. A single dose of the potent gonadotropin-releasing hormone antagonist acyline suppresses gonadotropins and testosterone for 2 weeks in healthy young men. J Clin Endocrinol Metab. 2004;89(12):5959–5965. [DOI] [PubMed] [Google Scholar]
- 30. Bhasin S, Cunningham GR, Hayes FJ, et al. Testosterone therapy in men with androgen deficiency syndromes: An Endocrine Society clinical practice guideline. J Clin Endocrinol Metab. 2010;95(6):2536–2559. [DOI] [PubMed] [Google Scholar]
- 31. Rabiee A, Dwyer AA, Caronia LM, et al. Impact of acute biochemical castration on insulin sensitivity in healthy adult men. Endocr Res. 2010;35(2):71–84. [DOI] [PubMed] [Google Scholar]
- 32. Samocha-Bonet D, Dixit VD, Kahn CR, et al. Metabolically healthy and unhealthy obese—The 2013 Stock Conference report. Obes Rev. 2014;15(9):697–708. [DOI] [PMC free article] [PubMed] [Google Scholar]