

Abstract
Background:
This hypothesis generating study explores second trimester maternal body mass index (BMI) during pregnancy and offspring neurocognitive development.
Methods:
Mothers and offspring served as controls in two earlier studies: 101 children at age two years and 118 children at age eight years.
Results
Frequency of maternal BMI ≥30 kg/m2 increased from 10% in 1987-1990 to 30% in 2004-2006 (P < 0.001); the socioeconomic gradient became more pronounced. At age two, one or more BSID-III (Bayley Scales of Infant Development, 3rd Edition) scores <85 were more frequent with higher maternal BMI (P = 0.029); regression analysis suggested an inverse relationship between language scores and BMI (P = 0.054). Among eight-year-olds, one or more WISC-III (Wechsler Intelligence Scale for Children, 3rd edition) scores <85 increased with maternal BMI (P = 0.017); regression analysis showed an inverse relationship between performance subscale IQ score and BMI (P = 0.023).
Conclusion:
Second trimester maternal obesity may be an independent risk factor for some aspects of children's neurocognitive development. Further study is indicated.
Keywords: BMI, pregnancy, offspring neurocognitive development
Introduction
As part of our recent case-control study involving maternal hypothyroxinaemia and neurocognitive development of two-year-old offspring, we examined covariates with known neurocognitive associations (e.g. mother's education, socioeconomic status) along with several variables that were not known to be associated.1 Second trimester maternal body mass index (BMI) of euthyroxinaemic women (controls) showed an unexpected inverse association with offspring neurocognitive development. Two published studies have addressed this relationship tangentially. The first examined maternal BMI and neurocognitive development among 355 five-year-old children of disadvantaged women in Tennessee;2 the second examined maternal BMI and intellectual disability (neurocognitive scores <70) in two Finnish cohorts.3 Findings in both studies were consistent with our preliminary observations, but both had important limitations. More recently, an association between maternal BMI and autism spectrum disorder has been observed in the Childhood Autism Risks from Genetics and the Environment (CHARGE) case-control study.4 The present analysis examines more extensively the maternal BMI/offspring neurocognitive relationship in our recent study.1 To further explore this relationship, we analyse maternal BMI and neurocognitive development among eight-year-old children of euthyroid control women in our earlier study that measured the impact of undiagnosed thyroid deficiency during pregnancy.5
Methods
Study subjects
The selection criteria and methods used to identify and evaluate study subjects have been previously presented.1, 5 Subjects in both studies were identified from within a general population of pregnant women undergoing routine serum screening for Down's syndrome during the second trimester. The population's racial composition was 98% Caucasian. Standardized demographic and health-related information was routinely collected, much of which was used for aiding the original screening test interpretation. Weight measurements were performed and current smoking status was ascertained in obstetric offices prior to the screening test. Average weight gain over pre-pregnant weight at that time in gestation is 3.2 kg.6 Answers to the smoking question were previously verified by cotinine measurements.7, 8 Hypothyroid/hypothyroxinaemic cases were identified and matched with controls after completion of pregnancy.
Matching used variables documented in the second trimester, supplemented with birth record data (e.g. birth weight, sex of child, gestational age at birth, maternal education). In neither study was maternal weight or BMI a selection criterion. The Four Factor Index of Social Status (Hollingshead scale) was administered to assess the family's socioeconomic status during the child's neurocognitive testing visit.9 This served to assess validity of matching that used the mother's earlier reported education status and also provided a more complete measure of current socioeconomic status.
Both study protocols were approved by the Foundation for Blood Research Institutional Review Board. Neurocognitive testing was scheduled based on verbal consent; women gave written informed consent at the testing appointment. The present analysis is limited to the two sets of control women and their children, where maternal BMI data were available.
Dataset A
Between May 2004 and March 2006, 5734 women gave informed consent for thyroid-stimulating hormone (TSH) and free thyroxine measurements in conjunction with second trimester serum screening for Down's syndrome.1 This initial recruitment was sufficient to identify and enroll 99 women with isolated hypothyroxinaemia (euthyroid women with free T4 ≤3rd centile) and 99 matched euthyroxinaemic women (euthyroid women, serum TSH 0.26-3.34 mIU/L and free T4 between the 10th and 90th centiles). Complete data (including maternal BMI) were available for 101 controls. This included 95 of the 99 controls (96%),1 along with six control women not included in the original analysis (their matched case withdrew).
Birth record information was available through a data sharing agreement between the Foundation for Blood Research and the Bureau of Vital Statistics, Maine Department of Health and Human Services. Women were excluded from the study if birth records or patient records indicated multiple gestation, delivery at <36 weeks’ gestation, delivery of a baby with congenital anomalies or a birth weight <2500 g. The Bayley Scales of Infant Development, 3rd Edition (BSID-III) were administered to offspring at mean age 2.4 years (standard deviation 0.4) to obtain standard scores for cognitive, language (receptive and expressive) and motor (gross, fine) domains.10
Dataset B
Between January 1987 and March 1990, TSH measurements were performed in stored second trimester sera from 25,216 women with viable singleton pregnancies in five batches over a two-year period.5 Birth weights under 1500 g were not considered. The 62 recruited thyroid-deficient woman were each matched with two euthyroid control women (TSH <98th percentile). Maternal BMI data obtained during the early second trimester were available for 118 of the 123 controls (96%). Neurocognitive testing of the women's children at mean age 8.1 years (standard deviation 0.6) assessed intelligence with the Wechsler Intelligence Scale for Children, 3rd edition (WISC III).11 This test provides a full-scale IQ score and subscale scores (range, 40-160) for verbal skills, performance and freedom from distractibility.
Data analysis
We used statistical software from SAS Institute, Inc. (Cary, NC, USA) and Analyze-it for Excel (Microsoft Inc., Seattle, WA, USA). Analysis of variance (ANOVA) or chi-squared test were used, as appropriate, to assess differences between both unadjusted and adjusted variables stratified by the three BMI groups. Significance was two-sided at the 0.05 level. To account for potential covariates (e.g. maternal age, Hollingshead score), we performed stepwise regression with the neurocognitive score as the dependent variable, using a low threshold for inclusion of P = 0.20. An expected neurocognitive score was determined using the multiple regression equation and each woman's data. To isolate the impact of BMI on the expected IQ, each woman's BMI value was replaced with the geometric mean BMI. The normalized, adjusted score was computed as 100 (observed score/expected score). In the figures, we normalized scores to a mean value of 100 by dividing each score by the mean value of the relevant control group, to allow more direct comparisons between the BMI and neurocognitive development scores. This allows for visualization of the relationship between neurocognitive score and BMI, after accounting for other potential covariates. We used linear regression to assess this univariate relationship, after a logarithmic transformation of BMI.
Results
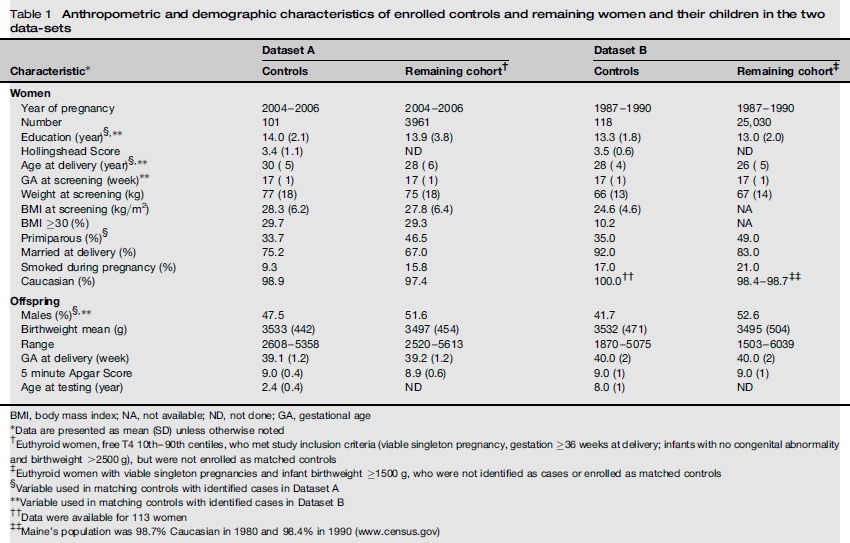
Table 1 shows selected anthropometric and demographic characteristics of control women and their children from the two neurocognitive studies and also of the cohorts from which the study subjects were selected. Differences between controls and their respective cohort result from the use of specific characteristics to match controls with their respective cases in the original studies (e.g. mothers’ education, age at delivery, parity, offspring sex). Mothers’ weights were not used for matching; average weights of controls in both datasets are consistent with their respective cohort (77 versus 75 kg in Dataset A and 66 versus 67 kg in Dataset B). Similarly, average BMI and percent of women with BMI ≥30 in Dataset A are similar for controls and the entire cohort from which they were selected (28.3 versus 27.8 kg/m2 average BMI; 29.7% versus 29.3% BMI ≥30 kg/m2). In Dataset B, average BMI data (24.6 kg/m2) and percent with BMI >30 kg/m2 (10.2%) are available only for enrolled women. Weight gain among women at 17 weeks’ gestation averages 3.2 kg.6 Taking this into account, the percent of women in Dataset A with pre-pregnant BMI ≥30 would be reduced to 27%; for Dataset B that figure would be 7.6%. The following analyses use second trimester BMI.
Table 1.
Anthropometric and demographic characteristics of enrolled controls and remaining women and their children in the two datasets
| Characteristic* | Dataset A |
Dataset B |
||
|---|---|---|---|---|
| Controls | Remaining cohort† | Controls | Remaining cohort‡ | |
| Women | ||||
| Year of pregnancy | 2004-2006 | 2004-2006 | 1987-1990 | 1987-1990 |
| Number | 101 | 3961 | 118 | 25,030 |
| Education (year)§, ** | 14.0 (2.1) | 13.9 (3.8) | 13.3 (1.8) | 13.0 (2.0) |
| Hollingshead Score | 3.4 (1.1) | ND | 3.5 (0.6) | ND |
| Age at delivery (year)§,** | 30 (5) | 28 (6) | 28 (4) | 26 (5) |
| GA at screening (week)** | 17 (1) | 17 (1) | 17 (1) | 17 (1) |
| Weight at screening (kg) | 77 (18) | 75 (18) | 66 (13) | 67 (14) |
| BMI at screening (kg/m2) | 28.3 (6.2) | 27.8 (6.4) | 24.6 (4.6) | NA |
| BMI >30 (%) | 29.7 | 29.3 | 10.2 | NA |
| Primiparous (%)§ | 33.7 | 46.5 | 35.0 | 49.0 |
| Married at delivery (%) | 75.2 | 67.0 | 92.0 | 83.0 |
| Smoked during pregnancy (%) | 9.3 | 15.8 | 17.0 | 21.0 |
| Caucasian (%) | 98.9 | 97.4 | 100.0†† | 98.4-98.7‡‡ |
| Offspring | ||||
| Males (%)§,** | 47.5 | 51.6 | 41.7 | 52.6 |
| Birthweight mean (g) | 3533 (442) | 3497 (454) | 3532 (471) | 3495 (504) |
| Range | 2608-5358 | 2520-5613 | 1870-5075 | 1503-6039 |
| GA at delivery (week) | 39.1 (1.2) | 39.2 (1.2) | 40.0 (2) | 40.0 (2) |
| 5 minute Apgar Score | 9.0 (0.4) | 8.9 (0.6) | 9.0 (1) | 9.0 (1) |
| Age at testing (year) | 2.4 (0.4) | ND | 8.0 (1) | ND |
BMI, body mass index; NA, not available; ND, not done; GA, gestational age
Data are presented as mean (SD) unless otherwise noted
Euthyroid women, free T4 10th-90th centiles, who met study inclusion criteria (viable singleton pregnancy, gestation ≥36 weeks at delivery; infants with no congenital abnormality and birthweight >2500 g), but were not enrolled as matched controls
Euthyroid women with viable singleton pregnancies and infant birthweight ≥1500 g, who were not identified as cases or enrolled as matched controls
Variable used in matching controls with identified cases in Dataset A
Variable used in matching controls with identified cases in Dataset B
Data were available for 113 women
Maine's population was 98.7% Caucasian in 1980 and 98.4% in 1990 (www.census.gov)
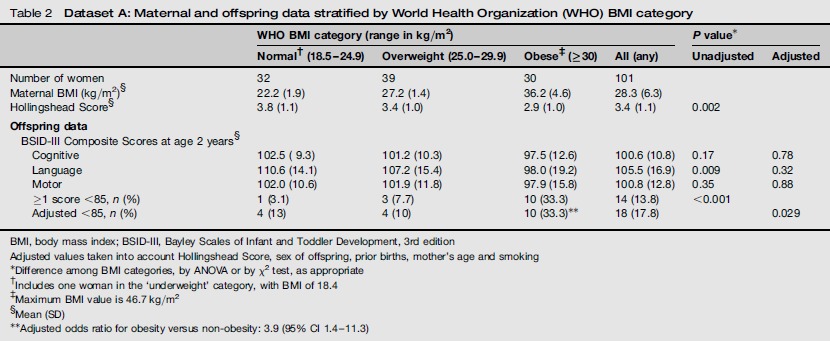
Table 2 shows neurocognitive test results from 101 children enrolled in the later time period (Dataset A) stratified by maternal BMI using World Health Organization (WHO) classification. The table shows unadjusted scores for BSID III results for comparison with other published studies. The Hollingshead scores differ by BMI category (P = 0.002) and are lowest in the obese category. The mean BSID III composite cognitive, language and motor scores for children of obese mothers are lower by 5.0, 12.6 and 4.1 points, respectively, compared with the normal BMI category. After adjustment for confounders, the differences in mean scores among the three BMI categories are not significant. As a BSID-III composite score <85 may identify children requiring additional services,11 we examined the distribution of these children among BMI categories. The percentage of children with ≥1 score below 85 increases monotonically with maternal BMI category and is higher among the children of obese, compared with normal BMI, mothers. After adjusting for confounders and setting mean scores to 100, the numbers of children in the three BMI categories with ≥1 score below 85 are 4, 4 and 10, respectively (χ2 test of trend, with factors in the three groups equal to the mean BMI: χ2 = 5.5, P = 0.029). The adjusted odds ratio for ≥1 score below 85 for obese versus non-obese women is 3.9 (95% confidence interval [CI] 1.4-11.3). All of the obese women delivered at 37 weeks’ gestation or later. Seven cases of pregnancy hypertension were identified. These did not relate to obesity and had no impact on BSID scores below 85. We identified six cases of gestational diabetes (2 in overweight and 3 in obese women). After removing these subjects, the adjusted P value for a difference in BSID scores <85 among BMI categories (P = 0.015) remained significant.
Table 2.
Dataset A: Maternal and offspring data stratified by World Health Organization (WHO) BMI category
| WHO BMI category (range in kg/m2) |
P value* |
|||||
|---|---|---|---|---|---|---|
| Normal† (18.5-24.9) | Overweight (25.0-29.9) | Obese‡ (≥30) | All (any) | Unadjusted | Adjusted | |
| Number of women | 32 | 39 | 30 | 101 | ||
| Maternal BMI (kg/m2)§ | 22.2 (1.9) | 27.2 (1.4) | 36.2 (4.6) | 28.3 (6.3) | ||
| Hollingshead Score§ | 3.8 (1.1) | 3.4 (1.0) | 2.9 (1.0) | 3.4 (1.1) | 0.002 | |
| Offspring data | ||||||
| BSID-III Composite Scores at age 2 years§ | ||||||
| Cognitive | 102.5 (9.3) | 101.2 (10.3) | 97.5 (12.6) | 100.6 (10.8) | 0.17 | 0.78 |
| Language | 110.6 (14.1) | 107.2 (15.4) | 98.0 (19.2) | 105.5 (16.9) | 0.009 | 0.32 |
| Motor | 102.0 (10.6) | 101.9 (11.8) | 97.9 (15.8) | 100.8 (12.8) | 0.35 | 0.88 |
| ≥1 score <85, n (%) | 1 (3.1) | 3 (7.7) | 10 (33.3) | 14 (13.8) | <0.001 | |
| Adjusted <85, n (%) | 4 (13) | 4 (10) | 10 (33.3)** | 18 (17.8) | 0.029 | |
BMI, body mass index; BSID-III, Bayley Scales of Infant and Toddler Development, 3rd edition
Adjusted values taken into account Hollingshead Score, sex of offspring, prior births, mother's age and smoking
Difference among BMI categories, by ANOVA or by χ2 test, as appropriate
Includes one woman in the ‘underweight’ category, with BMI of 18.4
Maximum BMI value is 46.7 kg/m2
Mean (SD)
Adjusted odds ratio for obesity versus non-obesity: 3.9 (95% CI 1.4-11.3)
As an initial step in developing a model for adjusting BSID III scores for potential effect modifiers, we performed stepwise regression on the following maternal/offspring characteristics: mother's age, education, BMI, marital status, number of prior births, smoking during pregnancy, socioeconomic status (Hollingshead score), home environment (HOME score), offspring's sex, gestational age at delivery, birth weight and days in hospital. BMI was forced into the model. For the remaining covariates, a P value of 0.20 was needed to enter the model and to remain in the model. In addition to BMI, five other variables were in the final model. In descending order of significance, they were: Hollingshead score (P < 0.0001), sex of offspring (P < 0.0001), number of prior births (P = 0.005), mother's age (P = 0.05) and smoking (P = 0.05).
Figure 1 shows a scatter plot between language domain scores (median score set to 100, no adjustment for covariates) and maternal BMI in Dataset A. Language was chosen because it demonstrates the strongest unadjusted relationship with BMI (solid line) among the three domains (log BMI versus normalized language score, r = -0.30, slope = -61.265, P < 0.001). This relationship is less strong after adjustment for the five variables described above (dashed line) (r = -0.16, slope = -26.810, P = 0.054). Based on this, BMI increases of 5, 10 and 15 kg/m2 would be associated with reductions in language domain scores of 2.2, 4.4 and 6.1 points, respectively. Adjusted relationships between cognitive and motor scores and BMI (not shown in 1) are r = -0.07, slope = -9.538, P = 0.34 and r = -0.05, slope = -7.408, P = 0.58, respectively.
Figure 1.
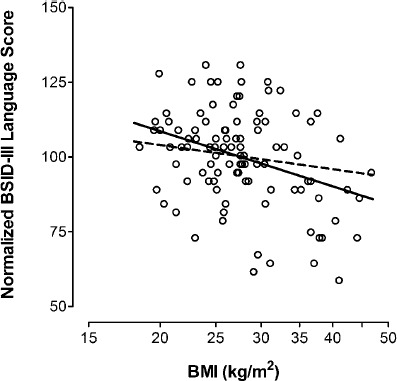
Normalized Bayley Scales of Infant Development, 3rd edition (BSID-III) language composite scores at age 2.4 (0.4) years among 101 children in Dataset A (vertical axis), plotted against their mothers’ body mass index (BMI) during the second trimester (horizontal axis). The BSID-III language scores were normalized to 100, by dividing each result by the overall mean of 105.5. The solid line shows the unadjusted relationship (r = -0.30, slope = -61.265, P = 0.0003), while the dashed line shows the relationship after adjusting for Hollingshead score (hhs), child's sex, number of prior births (npb), mother's age and smoking (r = -0.16, slope = -26.644, P = 0.054). The adjustment equation for the expected BSID-III language scores is shown below. Expected score = 109.606-26.644 × log(bmi) + 5.781 × hhs -10.124 × sex-3.724 × npb + 0.603 × age + 9.27 × smoke
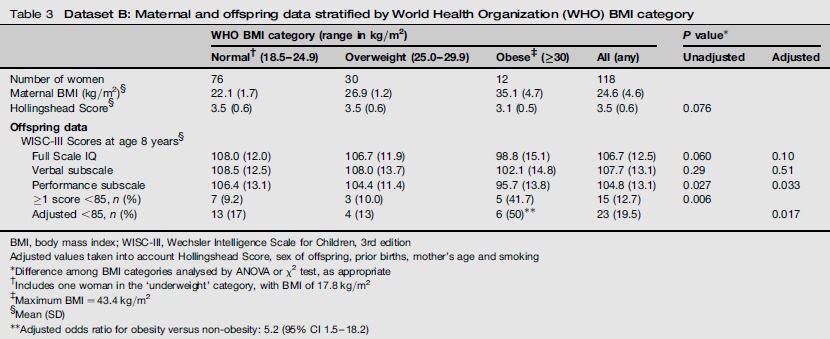
Table 3 shows unadjusted neurocognitive test results from 118 children enrolled in the earlier time period (Dataset B), grouped once again by maternal BMI using WHO classification. The Hollingshead scores are lowest in the group of obese women, but the difference among BMI subgroups does not reach statistical significance (P = 0.076 by ANOVA). The mean unadjusted WISC-III performance IQ score for children of mothers in the uppermost maternal BMI category is lower by 10.7 points than in the normal BMI category, and the full scale IQ and verbal subscale scores are also lower, by 9.2 and 6.4 points, respectively. After adjustment, mean performance subscale scores remain significantly different (P = 0.033) among maternal BMI categories. The observed percentage of children with ≥1 WISC-III score below 85 is highest among women in the highest BMI category. After adjusting for confounders and setting mean scores to 100, the numbers of children in the three BMI categories with ≥1 score below 85 are 13, 4 and 6, respectively (χ2 test of trend, 4.68, P = 0.030). The adjusted odds ratio for ≥1 score below 85 is 5.2 (95% CI 1.5-18.2). Data on pregnancy hypertension and gestational diabetes were not available.
Table 3.
Dataset B: Maternal and offspring data stratified by World Health Organization (WHO) BMI category
| WHO BMI category (range in kg/m2) |
P value* |
|||||
|---|---|---|---|---|---|---|
| Normal† (18.5-24.9) | Overweight (25.0-29.9) | Obese‡ (≥30) | All (any) | Unadjusted | Adjusted | |
| Number of women | 76 | 30 | 12 | 118 | ||
| Maternal BMI (kg/m2)§ | 22.1 (1.7) | 26.9 (1.2) | 35.1 (4.7) | 24.6 (4.6) | ||
| Hollingshead Score§ | 3.5 (0.6) | 3.5 (0.6) | 3.1 (0.5) | 3.5 (0.6) | 0.076 | |
| Offspring data | ||||||
| WISC-III Scores at age 8 years§ | ||||||
| Full Scale IQ | 108.0 (12.0) | 106.7 (11.9) | 98.8 (15.1) | 106.7 (12.5) | 0.060 | 0.10 |
| Verbal subscale | 108.5 (12.5) | 108.0 (13.7) | 102.1 (14.8) | 107.7 (13.1) | 0.29 | 0.51 |
| Performance subscale | 106.4 (13.1) | 104.4 (11.4) | 95.7 (13.8) | 104.8 (13.1) | 0.027 | 0.033 |
| ≥1 score <85, n (%) | 7 (9.2) | 3 (10.0) | 5 (41.7) | 15 (12.7) | 0.006 | |
| Adjusted <85, n (%) | 13 (17) | 4 (13) | 6 (50)** | 23 (19.5) | 0.017 | |
BMI, body mass index; WISC-III, Wechsler Intelligence Scale for Children, 3rd edition
Adjusted values taken into account Hollingshead Score, sex of offspring, prior births, mother's age and smoking
Difference among BMI categories analysed by ANOVA or χ2 test, as appropriate
Includes one woman in the ‘underweight’ category, with BMI of 17.8 kg/m2
Maximum BMI = 43.4 kg/m2
Mean (SD)
Adjusted odds ratio for obesity versus non-obesity: 5.2 (95% CI 1.5-18.2)
In developing a model for adjusting WISC III scores for potential effect modifiers, we used the same covariates as applied in the regression analysis for BSID III scores. Along with BMI, two additional variables remained in the model: Hollingshead score (P = 0.002) and number of prior births (P = 0.12). Sex of offspring, mother's age and smoking during pregnancy did not reach the threshold for inclusion but were allowed into the model for consistency with adjustments in Dataset A.
Figure 2 shows a scatterplot of WISC-III performance subscale IQ scores versus maternal BMI among the 118 eight-year-old children in Dataset B. As with 1, the median performance subscale IQ score is adjusted to 100. The unadjusted relationship between performance subscale IQ scores and maternal BMI (solid line) is significant (r = -0.20, slope = -34.733, P = 0.028). Following adjustment for the above five covariates (dashed line), the relationship remains significant (r = -0.20, slope = -34.873, P = 0.023). Based on this, BMI increases of 5, 10 and 15 kg/m2 would be associated with reductions in performance subscale IQ scores of 3.1, 5.7 and 7.9 points, respectively. Although not shown in the figure, adjusted full scale and verbal subscale scores are r = -0.16, slope = -23.371, P = 0.093 and r = -0.06, slope = -9.772, P = 0.50, respectively.
Figure 2.
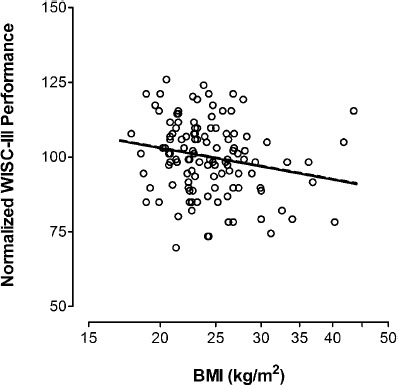
Normalized Wechsler Intelligence Scale for Children, 3rd edition (WISC-III) performance subscale IQ scores at age 8.1 (0.6) years among 118 children in Dataset B (vertical axis), plotted against their mothers’ body mass index (BMI) during the second trimester (horizontal axis). The BSID-III language scores were normalized to 100, by dividing each result by the overall mean of 104.8. The solid line shows the unadjusted relationship (r = -0.20, slope = -34.733, P = 0.028), while the dashed line shows the relationship after adjusting for Hollingshead score (hhs), child's sex, number of prior births (npb), mother's age and smoking (r = -0.20, slope = -35.534, P = 0.023). The adjustment equation for the expected WISC-III performance subscale IQ scores is shown below. Expected Score = 131.633 -35.534 × log(bmi) + 3.843 × hhs + 2.544 × sex -1.149 × npb + 0.147 × age + 1.391 × smoke
Discussion
The present hypothesis generating study is a post hoc analysis based on a convenience sample; the original studies examined other relationships. Additional limitations include relatively small numbers of study subjects (given the need for adjustments) and the fact that other, unknown confounders may be present. Too few study subjects are in the ≥30 kg/m2 category in Dataset B to reliably assess weaker relationships such as those that might be present between maternal BMI and verbal subscale/full scale IQ. Furthermore, a direct between-study comparison of children's neurocognitive development is not possible, due to differing ages at the time of neurocognitive testing and the different tests used (BSID III and WISC III).
As strengths, serum samples, anthropometric and demographic information in both studies were collected at a standardized time during the second trimester. The reference cohorts were sufficiently large to provide reliable demographics for evaluating selection bias that might occur in conjunction with recruiting subjects for the original case-control studies, and BMI (or weight) was not a selection criterion. Known confounders of child development (e.g. gestational age at birth, maternal education) were recorded for both cohorts, supplemented by Hollingshead scores (in both datasets) and HOME scores (in Dataset A) at the visit for neurocognitive testing. The Hollingshead score includes mother's and father's education, as well as type of work, while the HOME score focuses on the home environment. Neurocognitive testing in both study groups was carried out by expert testers. Further insight about cognitive performance might be gained if additional testing could be carried out on both parents.
In both datasets, women from racially homogeneous cohorts were euthyroid controls for studies involving hypothyroidism or hypothyroxinaemia. In Dataset A, children with ≥1 BSID III score <85 increased with higher maternal BMI; regression analysis suggested that lower language scores may be related to higher maternal BMI. Among children in Dataset B, offspring with ≥1 WISC III score <85 also increased with higher maternal BMI; regression analysis indicated a statistically significant association between higher maternal BMI and lower performance subscale scores.
Women in the uppermost BMI category (≥30 kg/m2) increased from 10% to 30% in the 16-year interval, reflecting a similar trend for the general US population during roughly the same time period (22.9% to 30.5% from 1988-1994 through 1999-2000).12, 13 In the more recent time period (Dataset A), women with lower Hollingshead scores are disproportionately represented in the uppermost BMI category, suggesting a societal shift in the relationship between socioeconomic status and obesity.14
Two published studies provide limited corroborative data. Heikura et al.3 assessed intellectual disability (ID) (standardized score < 70) in relation to pre-pregnancy BMI in 1966 and in 1986, utilizing two cohorts of Finnish children (12,058 and 9432). Testing was administered by psychologists in hospitals, institutions for children with ID, family counselling centres and schools. When test scores were unavailable but the child had a diagnosed disorder associated with ID, a score was arbitrarily assigned. It was not possible to determine which children with ID might have a well defined cause, such as Down's syndrome or cerebral palsy; inclusion of these could mask the real effect size. The 1988 cohort, but not the 1966 cohort, showed a significant association between BMI and ID (odds ratio 2.9; 95% CI 1.3-6.1), after adjustment for relevant covariates.
In Tennessee, USA, Neggers et al.2 measured neurocognitive development in a disadvantaged black population. The authors hypothesized that five-year-old children of women with low pre-pregnancy BMI would perform less well than those of women with higher BMI. The converse was found, with children of obese women performing least well. Pre-pregnancy BMI was a significant predictor of general IQ scores (slope -0.25, P = 0.005) as well as non-verbal scores (β = -0.20, P = 0.01). There was no significant association of BMI with verbal or gross motor ability scores. The study's focus on a disadvantaged population makes it difficult to apply the findings more generally; the average IQ score was 82.1 (standard deviation 12.6). Although the Finnish and Tennessee studies have limitations, both are consistent with our preliminary findings.
Maternal obesity in pregnancy is associated with multiple metabolic changes, including increased maternal serum levels of leptin, lipids, insulin and markers/mediators of inflammation.15,18 Clinical studies suggest that maternal obesity may pre-program offspring to develop obesity, diabetes and cardiovascular disease later in life19 and this concept may extend to brain development.20 In mice, obesity induced by a high-fat diet alters fetal hippocampal development21 and impairs spatial learning performance,22 while in non-human primate offspring the result is central serotonergic changes and increased anxiety-like behaviour.23 In both rats and mice, later offspring obesity may be related to hypothalamic programming in utero.24, 25 Studies in animal models also suggest that the effect on neural development could be modulated by leptin26 and/or inflammation.27
In addition to metabolic changes associated with obesity during pregnancy that might directly influence nervous system development in utero, possible explanations include other covariates that might not have been measured in this study. As one example, BMI-related features of the home environment might cause developmental stimulation to be reduced and might introduce additional confounding, even after socioeconomic status has been taken into account. Regardless of whether a metabolic or environmental factor (or artifact) is responsible, an independent effect of maternal obesity on the child's early neurocognitive development is plausible and deserves further investigation.
Funding Statement
Dataset A-supported by the grant # HD 44111 from the National Institute of Child Health and Human Development; Dataset B-supported by the grants from the Thrasher Fund (02810-7), Knoll Pharmaceutical Company (SYN-0398-09) and the National Institute of Child Health and Human Development (supplement to RO1-HD31183).
DECLARATIONS
Competing interests: None.
Ethical approval: The Institutional Review Board of the Foundation for Blood Research approved this study.
Guarantor: JEH.
Contributorship: WC and JEH researched literature and conceived the study. GP and LN were involved in data analysis. All authors reviewed and edited the manuscript and approved the final version of the manuscript.
Acknowledgements: None.
References
- 1.Craig WY, Allan WC, Kloza EM, et al. Mid-gestational maternal free thyroxine concentration and offspring neurocognitive development at age two years. J Clin Endocrinol Metab 2012; 97: E22–8 [DOI] [PMC free article] [PubMed] [Google Scholar]
- 2.Neggers YH, Goldenberg RL, Ramey SL, Cliver SP. Maternal prepregnancy body mass index and psychomotor development in children. Acta Obstet Gynecol Scand 2003; 82: 235–40 [DOI] [PubMed] [Google Scholar]
- 3.Heikura U, Taanila A, Hartikainen AL, et al. Variations in prenatal sociodemographic factors associated with intellectual disability: a study of the 20-year interval between two birth cohorts in northern Finland. Am J Epidemiol 2008; 167: 169–77 [DOI] [PubMed] [Google Scholar]
- 4.Krakowiak P, Walker CK, Bremer AA, et al. Maternal metabolic conditions and risk for autism and other neurodevelopmental disorders. Pediatrics 2012; 129: e1121–8 [DOI] [PMC free article] [PubMed] [Google Scholar]
- 5.Haddow JE, Palomaki GE, Allan WC, et al. Maternal thyroid deficiency during pregnancy and subsequent neuropsychological development of the child. N Engl J Med 1999; 341: 549–55 [DOI] [PubMed] [Google Scholar]
- 6.Rasmussen KM, Yaktine AL. Committee to reexamine IOM Pregnancy Weight Guidelines. Weight gain during pregnancy: reexamining the guidelines. Institute of Medicine. National Research Council, 2009 [Google Scholar]
- 7.Haddow JE, Knight GJ, Palomaki GE, Haddow PK. Estimating fetal morbidity and mortality resulting from cigarette smoke exposure my measuring cotinine levels in maternal serum. Prog Clin Biol Res 1988; 281: 289–300 [PubMed] [Google Scholar]
- 8.Haddow JE, Palomaki GE, Knight GJ. Use of serum cotinine to assess the accuracy of self reported non-smoking. Br Med J (Clin Res Ed) 1986; 293: 1306. [DOI] [PMC free article] [PubMed] [Google Scholar]
- 9.Hollingshead AB. Four Factor Index of Social Status, New Haven, CT: Yale University, 1975 [Google Scholar]
- 10.Bayley N. Bayley Scales of Infant and Toddler Development, third edition San Antonio, TX: Harcourt Assessment, 2006 [Google Scholar]
- 11.Wechsler D. Wechsler Intelligence Scale for Children, third edition. San Antonio, TX: The Psychological Corporation, 1991 [Google Scholar]
- 12.Flegal KM, Carroll MD, Kit BK, Ogden CL. Prevalence of obesity and trends in the distribution of body mass index among US adults, 1999-2010. JAMA 2012; 307: 491–7 [DOI] [PubMed] [Google Scholar]
- 13.Flegal KM, Carroll MD, Ogden CL, Johnson CL. Prevalence and trends in obesity among US adults, 1999-2000. JAMA 2002; 288: 1723–7 [DOI] [PubMed] [Google Scholar]
- 14.Fleischer NL, Diez Roux AV, Hubbard AE. Inequalities in body mass index and smoking behavior in 70 countries: evidence for a social transition in chronic disease risk. Am J Epidemiol 2012; 175: 167–76 [DOI] [PMC free article] [PubMed] [Google Scholar]
- 15.Madan JC, Davis JM, Craig WY, et al. Maternal obesity and markers of inflammation in pregnancy. Cytokine 2009; 47: 61–4 [DOI] [PubMed] [Google Scholar]
- 16.Misra VK, Trudeau S. The influence of overweight and obesity on longitudinal trends in maternal serum leptin levels during pregnancy. Obesity (Silver Spring) 2011; 19: 416–21 [DOI] [PubMed] [Google Scholar]
- 17.Ramsay JE, Ferrell WR, Crawford L, et al. Maternal obesity is associated with dysregulation of metabolic, vascular, and inflammatory pathways. J Clin Endocrinol Metab 2002; 87: 4231–7 [DOI] [PubMed] [Google Scholar]
- 18.Roberts KA, Riley SC, Reynolds RM, et al. Placental structure and inflammation in pregnancies associated with obesity. Placenta 2011; 32: 247–54 [DOI] [PubMed] [Google Scholar]
- 19.Drake AJ, Reynolds RM. Impact of maternal obesity on offspring obesity and cardiometabolic disease risk. Reproduction 2010; 140: 387–98 [DOI] [PubMed] [Google Scholar]
- 20.Van Lieshout RJ, Taylor VH, Boyle MH. Pre-pregnancy and pregnancy obesity and neurodevelopmental outcomes in offspring: a systematic review. Obes Rev 2011; 12: e548–59 [DOI] [PubMed] [Google Scholar]
- 21.Niculescu MD, Lupu DS. High fat diet-induced maternal obesity alters fetal hippocampal development. Int J Dev Neurosci 2009; 27: 627–33 [DOI] [PMC free article] [PubMed] [Google Scholar]
- 22.Tozuka Y, Kumon M, Wada E, et al. Maternal obesity impairs hippocampal BDNF production and spatial learning performance in young mouse offspring. Neurochem Int 2010; 57: 235–47 [DOI] [PubMed] [Google Scholar]
- 23.Sullivan EL, Grayson B, Takahashi D, et al. Chronic consumption of a high-fat diet during pregnancy causes perturbations in the serotonergic system and increased anxiety-like behavior in nonhuman primate offspring. J Neurosci 2010; 30: 3826–30 [DOI] [PMC free article] [PubMed] [Google Scholar]
- 24.Chen H, Simar D, Morris MJ. Hypothalamic neuroendocrine circuitry is programmed by maternal obesity: interaction with postnatal nutritional environment. PLoS One 2009; 4: e6259. [DOI] [PMC free article] [PubMed] [Google Scholar]
- 25.Vucetic Z, Kimmel J, Totoki K, Hollenbeck E, Reyes TM. Maternal high-fat diet alters methylation and gene expression of dopamine and opioid-related genes. Endocrinology 2010; 151: 4756–64 [DOI] [PMC free article] [PubMed] [Google Scholar]
- 26.Bouret SG. Neurodevelopmental actions of leptin. Brain Res 2010; 1350: 2–9 [DOI] [PMC free article] [PubMed] [Google Scholar]
- 27.Bilbo SD, Tsang V. Enduring consequences of maternal obesity for brain inflammation and behavior of offspring. FASEB J 2010; 24: 2104–15 [DOI] [PubMed] [Google Scholar]