

Abstract
Among important components of American ginseng, protopanaxadiol (PPD) showed more active anticancer potential than other triterpenoid saponins. In this study, we determined the in vivo effects of PPD in a mouse cancer model first. Then, using human colorectal cancer cell lines, we observed significant cancer cell growth inhibition by promoting G1 cell cycle redistribution and apoptosis. Subsequently, we characterized the downstream genes targeted by PPD in HCT-116 cancer cells. Using Affymetrix high density GeneChips, we obtained the gene expression profile of the cells. Microarray data indicated that the expression levels of 76 genes were changed over two-fold after PPD, of which 52 were upregulated while the remaining 24 were downregulated. Ingenuity pathway analysis of top functions affected was carried out. Data suggested that by regulating the interactions between p53 and DR4/DR5, the tumor necrosis factor-related apoptosis-inducing ligand (TRAIL) pathway played a key role in the action of PPD, a promising colon cancer inhibitory compound.
Keywords: Panax quinquefolius, protopanaxadiol, human colorectal cancer, xenograft, gene expression, microarray, tumor necrosis factor, apoptosis, TRAIL
Introduction
Colorectal cancer (CRC) is one of the most common cancers and a leading cause of cancer death in both men and women. Although promising progress has been made in the diagnosis and treatment of CRC over the last decade, this cancer remains a major public health problem (1-3). There is an urgent demand to better understand the molecular mechanisms underlying the different phenotypes of CRC. This understanding may provide information supporting drug discovery and prevention strategies (1). The development of human genome technologies, such as DNA microarrays, has allowed us to simultaneously examine thousands of genes, leading to a better understanding of carcinogenesis (4). Studies related to compound treatment outcomes by differences in gene expression profiling facilitate the search for more curative interventions (5).
Increasing evidence shows that patients with cancer often resort to complementary and alternative medical supplements to treat cancer, cancer-related symptoms, or to reduce the adverse effects of chemotherapy (6). Botanicals can contain effective anticancer compounds that can be used alone or as adjuncts to existing chemotherapy, thereby improving efficacy and reducing drug-induced adverse events (7, 8). In current cancer treatment, approximately 80% of novel drugs have originated from natural products (9).
American ginseng (Panax quinquefolius L.) is a commonly used herbal medicine in the United States. Protopanaxadiol (PPD, Fig. 1), an aglycon of ginseng saponins from the ginseng, has shown anticancer potential in our previous studies (10). However, the previous study emphasized in vitro bioactivity screening using PPD and its derivatives, the in vivo antitumor effects were not evaluated. In addition, PPD’s anti-CRC mechanisms have largely not been explored.
Fig. 1.
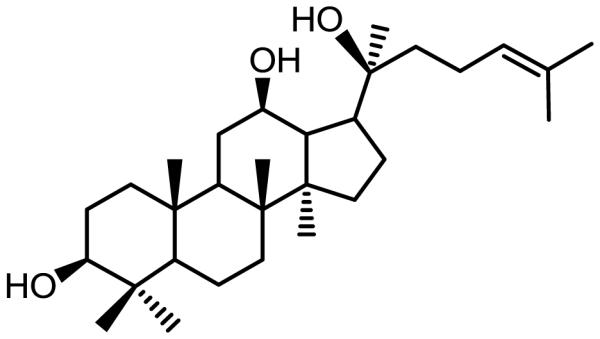
Chemical structure of protopanaxadiol (PPD).
To better understand the anticancer effects of PPD, in the present study, we first used an athymic nude mouse xenograft tumor model to observe the compound’s in vivo activity. Next, a panel of human colorectal cancer cell lines (i.e., SW-480, HT-29, and HCT-116), which differ in the expression of the tumor suppressor gene, p53, were used to compare the anti-proliferation activities. Then, HCT-116 cells, which showed the most significant growth inhibition by PPD, were selected to explore the compound’s effect on mRNA. Our data showed that PPD was involved in the upregulation of several tumor suppressor genes, suggesting that DR4/DR5 (a tumor necrosis factor-related apoptosis-inducing ligand, or TRAIL) was associated with the anticancer effect of PPD.
Materials and Methods
Protopanaxadiol (PPD) preparation
Total ginsenosides (2.0 g), n-butanol (250 mL), and sodium hydroxide (10 g) were added to a 500 ml round bottom flask. The mixture was heated to 130°C stirring with argon for 2 days and allowed to cool at room temperature. Then, the reaction mixture was washed with water (2×100 mL), 1% HCl (2×100 ml), 5% NaHCO3, and brine. The organic phase was dried over magnesium sulfate. The removal of the solvent under reduced pressure resulted in a sticky oil, which was purified by a silica gel column to release PPD. PPD was dissolved in DMSO to make stock solution (varied concentrations 5-40 mM) and kept at −80°C as aliquots before use.
HCT-116-Luc cell line, xenograft tumor model and bioluminescence imaging
The HCT-116-Luc cells that stably express firefly luciferase were used as described previously (11, 12). The firefly luciferase activity was tested using Promega's Luciferase Assay kit (Promega, Madison, WI). Female athymic nude mice (Harlan Sprague-Dawley, Indianapolis, IN), 4 weeks old and 10 mice per group, were used. The use and care of animals was performed following the guidelines approved by the Institutional Animal Care and Use Committee (ACUP number: 70917, approved on April 4, 2013).
Subconfluent HCT-116-Luc cells were harvested and resuspended in phosphate buffered saline (PBS) to a density of 2.0×10⁷ cells/mL. Before injection, cell viability was analyzed by 0.4% trypan blue (viable cells > 90%). For subcutaneous injection, approximately 1.0×10⁶ HCT116-Luc cells in 50 μL PBS were injected into both flanks of each animal. From the same day of inoculation, PPD (25 or 50 mg/kg body weight) was administered intraperitoneally (IP) every other day until the experiment ended. Optical imaging procedure and analysis was carried out as described previously (13).
Animals were subjected to Xenogen IVIS 200 imaging system (Caliper Life Sciences, Hopkinton, MA) for imaging at indicated time points after HCT-116-Luc cell inoculation. D-Luciferin sodium salt (Gold Biotechnology, St. Louis, MO) at 100 mg/kg body weight in 0.1 mL sterile PBS was administered IP as a substrate before each imaging. Pseudo images were acquired by superimposing the emitted light over the grayscale photographs of the animal. Quantitative image analysis was performed with Xenogen's Living Image V4.0.1 software.
Cell culture and cell proliferation inhibition analysis
SW-480, HT-29, HCT-116 human colorectal cancer cells, and IEC-6 rat small intestine epithelial cells were purchased from American Type Culture Collection (ATCC, Manassas, VA) and grown in the L-15 or McCoy’s 5A medium supplemented with 10% FBS and 50 IU penicillin/streptomycin in a humidified atmosphere of 5% CO2 (100% air for SW-480 cells) at 37°C. For the proliferation assay, each type of cell was seeded in 96-well plates (5×10³ cells/well) to adhere overnight. Various concentrations of PPD (5, 10, 20, 30, and 40 µM) then were administrated to the wells. Controls were treated with culture medium containing 0.1% DMSO. After 24, 48, and 72 hr, cell survival and growth were measured by the Cell Titer 96 Aqueous MTS Reagent (Promega, Madison, WI) according to the manufacturer’s protocol. All experiments were performed in triplicate and repeated three times, independently. The light absorbance was measured by using an automatic microplate reader (Epoch, Bio-Tek Instruments, Winooski, VT) at 490 nm (14). Data were expressed as a percentage versus control (vehicle set at 100%).
Apoptosis assay
HCT-116 and SW-480 cells were seeded in 24-well plates. After 24 hr, the medium was changed and PPD was added at different concentrations. After treatment for 48 hr, all adherent cells were collected with 0.05% trypsin, including the floating cells in the medium, and centrifuged for 5 min at 600 g. Then, the cells were double stained with Annexin-V-(FITC) and propidium iodide (PI) (Becton Dickinson, San Diego, CA) according to the manufacturer's instructions (15). Untreated cells were used as control. The stained cells were subsequently analyzed by a FACS Canto flow cytometer (Becton Dickinson, Mountain View, CA). All experiments were performed independently three times, and run in triplicate. At least 10,000 cells were counted each time. Data were analyzed by Flowjo software 9.0.
Cell cycle assay
For cell cycle assay, 1×10⁵ cells were seeded in 12-well plates. On the second day, PPD or vehicle was added. 48 hr later, all adherent cells were collected by trypsin, fixed with 80% ethanol and stored for 2 h at −20°C. After treatment with 0.25% Triton X-100 for 5 min, the cells were resuspended in 200 µL of PI/RNase staining buffer (Becton Dickinson, San Diego, CA), incubated in the dark for 20 min at room temperature, and counted with a FACS Canto flow cytometer. At least 10,000 cells were counted for each measurement. Data were analyzed by Flowjo software 9.0.
HCT-116 cell treatment protocol and total RNA preparation
HCT-116 cells were plated at a density of 1×10⁵ cells/dish in 60 mm tissue culture plates. Cells were allowed to adhere for 24 hr before treatment. Thereafter, cells were treated with 20 or 25 μM of PPD for 24 or 48 hrs. Total RNA was extracted using miRNeasy mini kit (Qiagen, Valencia, CA) following the manufacturer’s instruction and quantified by Nanodrop (Thermo, Wilmington, DE) before hybridization.
mRNA array assay
A group of 6 samples obtained from the in vitro assays were included in the cDNA array assays. Gene arrays were performed by using Affymetrix GeneChip Human Gene 1.0 ST Array (Dumbarton Circle, Fremont, CA), which contains 28,853 mouse genes being represented on the array by approximately 27 probes spread across the full length of a given gene. This provides a more complete and more accurate picture of gene expression than 3'-based expression array designs. After hybridization and background correction according to the standard protocols, the quantified signals were then normalized using Robust Multi-array Average (RMA), which is a robust algorithm of background-adjustment, quantile normalization, and log-transformation (16). Partek Genomics Suite (Partek Inc., St. Louis, MI) was used for the analysis of the normalized data.
Q-PCR analysis of core genes
The differential expression level of a subset of genes selected from highly expressed genes by microarray was confirmed by quantitative real-time RT-PCR analysis. Isolated RNA was reverse transcribed and the resulting cDNA was then amplified using SYBR green and specific primers according to the manufacturer’s instructions (Applied Biosystems, Carlsbad, CA). All samples were run in triplicate and the expression of each gene was standardized using the housekeeping gene glyceraldehyde-3-phosphate dehydrogenase (GAPDH) as a reference. Amplification reactions were performed using a 9700H real-time PCR instrument (Applied Biosystems, Carlsbad, CA). The conditions for the reactions were: 95°C, 10 min; 95°C, 15 s; 60°C, 60 s for 40 cycles. The related genes expression was determined using 2−ΔΔct method.
Statistical analysis
Data are expressed as mean ± SE. A one-way ANOVA determined whether the results had statistical significance. In some cases, a Student’s t-test was used for comparing the two groups. A P-value set at 0.05 was used to determine significant differences. All analyses were performed using SPSS 14.0 (IBM Corporation, Somers, NY).
Results
PPD significantly inhibits the growth of xenograft tumors in Athymic nude mice
Xenograft tumor model mice implanted with HCT-116 human colorectal carcinoma cells were administrated with 25 and 50 mg/kg PPD. After 30 days of treatment, 25 and 50 mg/kg PPD inhibited tumor growth approximately by 35% and 50%, respectively (Fig. 2: A and B; P < 0.01 compared to control, P < 0.05, compared to 25 mg/kg group).
Fig. 2.

PPD inhibits tumor growth in xenograft mice with colorectal cancer. (A) HCT-116 induced tumor growth was monitored using Xenogen bioluminescence imaging for up to 30 days. Representative Xenogen imaging results (Control, PPD 25 mg/kg and PPD 50 mg/kg) at day 1 and day 30 are shown. (B) Quantitative analysis of Xenogen bioluminescence imaging. Average tumor sizes at the indicated time points are represented with imaging signal intensities (in photons/second/cm2/steradian). PPD significantly inhibits the tumor growth in Athymic nude mice in a dose dependent manner (n = 10). ** P < 0.01, compared with control; # P < 0.01, compared with 25 mg/kg group).
With the assistance of veterinary staff in the animal care facility in our university, no obvious clinical signs of adverse events were observed during the PPD treatment. These daily observations included: motor activity (locomotion, catalepsy), respiration (dyspnea), skin (edema, erythema), and reflexes (light) (17).
PPD significantly inhibits colorectal cancer cell proliferation
Growth inhibitory effects of PPD on SW-480, HT-29, and HCT-116 cancer cells at various PPD concentrations (5, 10, 20, 30 and 40 μM) were evaluated at 24, 48 or 72 hr. The MTS assay results are shown in Fig. 3: A, B and C. The growth of the treated cells decreased significantly in a concentration-dependent manner. We also observed that, PPD at 20 μM, HCT-116 cells were significantly more sensitive to the treatment than the other two cells, suggesting that the status of p53 could account for this difference.
Fig. 3.

PPD inhibits the growth of SW-480, HT-29, and HCT-116 human colorectal cancer cells. Cell survival was determined by MTS assay and calculated as a ratio of the control. PPD inhibited SW-480 cell (A), HT-29 (B), and HCT-116 cell (C) proliferation in a time- and concentration-dependent manner. (D) HCT-116 cells showed more sensitivity than the other two cell lines after 20 μM PPD treatment. Data are presented as triplicate wells and three independent experiments. * P < 0.05, ** P < 0.01, compared with control.
A normal rat small intestine epithelial cell line, IEC-6, was used to evaluate the effects of PPD. Compared with the control (100%), the cell viabilities of PPD on IEC-6 cells in 10, 20, 30 and 40 µM for 48 h were 100.8±5.0%, 103.5±4.8%, 101.4±7.3%, and 86.3±6.6%, respectively. In contrast, cell growth was almost totally inhibited in all the three colorectal cancer cell lines when treated with PPD at 30 µM (Fig. 3).
PPD promotes cancer cell apoptosis
HCT-116 and SW-480 cells were treated with different PPD concentrations (15, 20, 25, 30, and 35 μM) for 72 hr. The apoptotic cells were determined by flow cytometry using Annexin V/propidium iodide (PI) double labeling. The ratio of apoptotic cells was significantly increased, dependent on PPD concentration (i.e., > 20 μM, consistent with the above cell proliferative data), compared with control (Fig. 4A; P < 0.01).
Fig. 4.

(A) Bar plot of PPD-induced apoptosis in HCT-116 and SW-480 cells at 48 hr. Data are presented as a percentage of total cells counted, three independent assays calculated. ** P < 0.01, compared with control. (B) Bar plot of PPD-induced G1 cell redistribution in HCT-116 and SW-480 cells at 48 hr. Three independent assays are calculated * P < 0.05, compared with control.
PPD induces cell G1 cycle arrest in cancer cells
HCT-116 and SW-480 cells were treated with different concentrations (15, 20, 25, 30, and 35 μM) of PPD for 48 hr and the cell cycle was examined by flow cytometry. As shown in Fig. 4B, PPD induced G1 cell cycle arrest in a concentration-dependent manner in both cell lines (both P < 0.01).
mRNA expression profiling and quantitative real-time PCR (qPCR) analysis after exposure of PPD to HCT-116 cells
HCT-116 cells were selected to perform mRNAs expression profiling analysis on six samples, including three control vehicle treated cells and different concentrations and time-points of PPD treated cells. We first performed an unsupervised, two-way (genes against samples), hierarchical cluster analysis (HCA). Remarkably, three PPD-treated cell samples (24p20, 48p20, 48p25) clearly grouped into one cluster, while three normal control cell samples also grouped together and formed a cluster (Fig. 5A). 204 genes significantly changed (over 1.5-fold) after PPD treatment. A sub-analysis based 79 genes significantly altered (over 2-fold) (Fig. 5B). 20 of the most upregulated and downregulated genes were compiled based on the microarray data, shown in Tables 1 and 2.
Fig. 5.

mRNA expression profiling and quantitative real-time PCR (qPCR) analysis after PPD treatment in HCT-116 cells. (A) Comparison of gene expression profiles of control HCT-116 cells and PPD treated cells. The heat map was generated using the expression ratios of 4187 genes that differed in PPD treated HCT-116 cells compared to no-treated cells, according to significance analysis of microarrays (SAM). Red represents overexpressed mRNAs. Green represents underexpressed mRNAs, compared to the counterparts. 204 genes significantly changed (above 1.5 fold) after PPD treatment. (B) Sub-analysis of significant 79 genes transcriptionally deregulated (threshold above 2 fold) when treated with PPD. (C) Six selected down regulated genes screening out of the microarray analysis are verified by qPCR. (D) Five selected upregulated genes screening out of the microarray analysis are confirmed by qPCR array.
Table 1.
Top 20 upregulated genes induced by PPD in HCT-116 cells.
| Gene Symbol | Gene assignment | 48NC1 | 48NC2 | 48NC3 | 24P20 | 48P20 | 48P25 | Fold change (Unlogged) |
|---|---|---|---|---|---|---|---|---|
| SLC7A11 | NM014331 | −1.099 | −1.147 | −1.028 | 0.993 | 1.463 | 1.547 | 5.445 |
| CHAC1 | NM024111 | −0.923 | −1.322 | −0.798 | 0.566 | 1.424 | 1.728 | 4.977 |
| DDIT4 | NM019058 | −0.952 | −0.941 | −0.987 | 1.298 | 1.287 | 1.081 | 4.546 |
| C12orf39 | NM_030572 | −0.715 | −1.203 | −0.948 | 0.645 | 1.296 | 1.558 | 4.459 |
| TCP11L2 | NM_152772 | −0.820 | −0.807 | −0.601 | −0.264 | 1.404 | 2.022 | 4.195 |
| NRP1 | NM003873 | −0.818 | −1.055 | −0.761 | 0.952 | 1.149 | 1.198 | 3.934 |
| ASNS | NM_133436 | −0.816 | −0.829 | −0.829 | 1.066 | 1.130 | 1.211 | 3.894 |
| CSTA | NM_005213 | −0.859 | −0.729 | −0.836 | 1.132 | 1.057 | 1.033 | 3.684 |
| SERPINE1 | NM000602 | −0.908 | −0.834 | −0.715 | 0.589 | 0.891 | 1.538 | 3.677 |
| SESN2 | NM031459 | −0.662 | −0.843 | −0.642 | 0.370 | 1.137 | 1.574 | 3.534 |
| ABCC3 | NM003786 | −0.727 | −0.747 | −0.855 | 0.721 | 0.867 | 1.382 | 3.467 |
| SLFN5 | NM_144975 | −0.703 | −0.666 | −0.802 | 0.137 | 1.180 | 1.496 | 3.402 |
| SLC6A9 | NM201649 | −0.668 | −0.699 | −0.832 | 0.629 | 0.942 | 1.263 | 3.247 |
| PCK2 | NM004563 | −0.564 | −0.915 | −0.673 | 0.624 | 1.203 | 1.043 | 3.219 |
| OR2A20P | NR002158 | −0.673 | −0.637 | −0.774 | 0.750 | 0.930 | 1.201 | 3.173 |
| UPP1 | NM003364 | −0.648 | −0.629 | −0.826 | 0.681 | 0.768 | 1.144 | 2.983 |
| BTG1 | NM001731 | −0.706 | −0.647 | −0.689 | 0.719 | 0.712 | 1.179 | 2.965 |
| C9orf150 | NM_203403 | −0.701 | −0.730 | −0.557 | 0.351 | 0.936 | 1.268 | 2.949 |
| STC2 | NM003714 | −0.584 | −0.706 | −0.737 | 0.444 | 0.951 | 1.156 | 2.937 |
| FAM129A | NM052966 | −0.818 | −0.731 | −0.422 | 0.286 | 0.983 | 1.237 | 2.898 |
Table 2.
Top 20 downregulated genes induced by PPD in HCT-116 cells.
| Gene Symbol | Gene assignment | 48NC1 | 48NC2 | 48NC3 | 24P20 | 48P20 | 48P25 | Fold change (Unlogged) |
|---|---|---|---|---|---|---|---|---|
| HIST1H2BM | NM_003521 | 0.783 | 0.713 | 1.161 | −0.076 | −0.636 | −2.476 | 0.317 |
| DHRS2 | NM182908 | 0.692 | 0.777 | 0.788 | −0.795 | −0.397 | −1.726 | 0.324 |
| ACAT2 | NM005891 | 0.623 | 0.711 | 0.693 | −0.713 | −0.652 | −1.273 | 0.346 |
| HIST1H3J | NM_003535 | 0.887 | 0.609 | 0.632 | −0.187 | −0.389 | −2.079 | 0.382 |
| INSIG1 | NM_005542 | 0.539 | 0.551 | 0.581 | −0.920 | −0.593 | −0.638 | 0.416 |
| ADAM21 | NM003813 | 0.458 | 0.476 | 0.778 | −0.554 | −0.769 | −0.584 | 0.432 |
| SYTL2 | NM_206927 | 0.457 | 0.566 | 0.596 | −0.368 | −0.610 | −0.905 | 0.450 |
| ADAM21 | NM003813 | 0.435 | 0.318 | 0.732 | −0.617 | −0.662 | −0.544 | 0.462 |
| CENPI | NM006733 | 0.430 | 0.496 | 0.552 | −0.267 | −0.314 | −1.415 | 0.476 |
| CCNE2 | NM_057749 | 0.525 | 0.493 | 0.378 | −0.517 | −0.488 | −0.822 | 0.477 |
| SHCBP1 | NM_024745 | 0.443 | 0.496 | 0.517 | −0.223 | −0.416 | −1.268 | 0.481 |
| HMGCS1 | NM_001098272 | 0.531 | 0.526 | 0.266 | −0.733 | −0.549 | −0.524 | 0.485 |
| KIF11 | NM_004523 | 0.511 | 0.440 | 0.502 | −0.189 | −0.352 | −1.358 | 0.489 |
| HIST1H2AB | NM003513 | 0.430 | 0.555 | 0.406 | −0.258 | −0.504 | −1.036 | 0.490 |
| STARD4 | NM139164 | 0.444 | 0.386 | 0.544 | −0.837 | −0.229 | −0.706 | 0.491 |
| HIST1H2BF | NM_003522 | 0.502 | 0.389 | 0.503 | −0.168 | −0.336 | −1.346 | 0.501 |
| FAM83D | NM030919 | 0.480 | 0.464 | 0.505 | −0.070 | −0.390 | −1.366 | 0.502 |
| DLGAP5 | NM_014750 | 0.470 | 0.558 | 0.530 | 0.098 | −0.303 | −1.840 | 0.502 |
| PLA2G4A | NM_024420 | 0.347 | 0.444 | 0.568 | −0.194 | −0.604 | −0.903 | 0.502 |
| CLSPN | NM022111 | 0.394 | 0.437 | 0.486 | −0.229 | −0.562 | −0.955 | 0.503 |
Among the genes that were significantly altered when treated with PPD in HCT-116 cells, six downregulated genes (CLSPN, CCNA2, SPAG5, DNM3, DHCR24, DSCC1) and five upregulated genes (BTG1, DDIT4, PDCD4, KLF4, NRP1) were validated by quantitative real-time RT-PCR. The same RNA samples for microarray were used to generate cDNA templates for reverse transcription reactions. The SYBR green-based real-time RT-PCR analysis was then carried out. Consistent with the microarray data, the 11 selected genes showed the same expression profile as the microarray data presented (Fig. 5: C and D).
Pathway analysis microarray data of HCT-116 cells treated with PPD
We performed gene network analysis using the 204 significant genes from our microarray analysis through the Ingenuity Pathway Analysis (IPA). A bar plot presenting ten classic pathways related to tumorigenesis is shown in Fig. 6A. Among them, apoptosis, proliferation, and angiogenesis were significantly induced. This is consistent with our in vitro data, suggesting that PPD is probably involved in cancer cell growth by modulating these processes. The selected regulatory cell death pathway gene network is shown in Fig. 6B, in which 23 affected genes of this network were either upregulated or downregulated after PPD treatment. Among the genes, DR4 and DR5 are important members of the tumor necrosis factors (TNF) family. It appears that HCT-116 cell apoptosis was induced after PPD exposure by the interaction of p53 and DR4/DR5, and suggests that the TRAIL pathway was associated with the PPD activities.
Fig. 6.

Pathway analysis of microarray data from HCT-116 cancer cells treated with PPD. (A) 10 selected tumorigenesis-related pathways are shown. (B) Cell death regulatory genes network plot. 23 affected assorted by microarray analysis are presented, marked with red filled circle.
Discussion
CRC is one of the most common cancers worldwide (18). Although the CRC tumorigenesis process offers a good understanding of human solid malignancies, the medical management of advanced colon cases remains highly challenging. Our previous in vitro studies observed that American ginseng exhibited anticancer potential in human colorectal cancer cells (19, 20).
PPD, one of the aglycones of American ginseng, has been shown to have cytotoxic activities against different cancer cells such as THP-1 leukemia cells and Caco-2 colorectal cancer cells (21, 22). Recently, PPD and its analogs have also been reported for their significant cancer cell growth inhibitory effects on human lung adenocarcinoma and oral squamous cell carcinoma. However, previous PPD studies focused on in vitro evaluations (23, 24). This study confirmed the anti-CRC effects of PPD in a dose-related manner using an in vivo xenograft nude mice model. Using a panel of colorectal cell lines, we observed that PPD suppressed cell proliferation, arrested specific cell cycle distribution, and promoted apoptosis. This is consistent with a previous observation that PPD and other ginsenoside aglycones are strong promoters of apoptosis (25). Recent pre-clinical research reported that orally administered PPD exhibited therapeutic activity on a home-sensitive prostate cancer model (26), addressing that the activity benefited from in situ apoptosis and proliferation inhibition. Interestingly, our study observed that PPD inhibited HCT-116 cell proliferation significantly more than the other two colon cancer cells. Based on the p53 status in these cell lines, it is suggested that p53 might contribute to the difference.
Previous in vitro studies that involved a PPD metabolized product (compound K or CK) revealed that it had an anticancer effect in human CRC cell lines. CK could induce apoptosis by activation of CAMK-IV/AMPK pathways in HT-29 cells (27). Another report also showed that PPD could suppress the activation of NF-κB pathway and MMP-9 expression, which would inhibit murine CRC cell migration and invasion. However, activity pathway of PPD as an anticancer agent in human CRC is largely unknown.
In a previous study, we reported gene profile and pathway activation after ginsenoside Rg3 treatment. In this study, we observed that the ephrin receptor (Ephs) pathway is the most affected. Ephs are the largest receptors in the tyrosine kinase family of transmembrane proteins, capable of recognizing signals from the cell environment and influencing cell-cell interaction and cell migration (28). To explore the molecular mechanism of the anticancer properties of PPD, we performed a screening test to distinguish the potential targets of PPD using a genome-wide microarray analysis. Hundreds of genes were transcriptionally activated or downregulated after PPD treatment in HCT-116 cells. Among them, attention was paid to the core pathways mainly related cancer and some crucial oncogenes and tumor suppressors. It is conceivable that the potential molecular targets might be those candidate genes that we reported.
Top 20 upregulated and downregulated genes are shown in Tables 1 and 2. BTG1, a cell proliferative inhibitory factor, was upregulated, which was confirmed by qPCR analysis (29). DDIT4, the DNA-damage-inducible transcript 4, was reported as mTOR inhibitor. Overexpression of DDIT4 promotes apoptosis in different types of cancer cells (30). Upregulation of BTG1 and DDIT4 could contribute to PPD’s effect on the cell proliferation and apoptosis in the human CRC.
CCNA2, a key regulator of the regular cell cycle progression, is overexpressed in multiple cancer malignancies such as lung, liver, colon, and breast cancers (31-33). Any treatment suppressing CCNA2 expression would be beneficial in inhibiting tumor growth. In our study, CCNA2 was decreased in HCT-116 cells when treated with PPD in both microarray screening and real-time PCR arrays. CCNE2 (cyclin E2), a significant overexpression gene in tumor-derived cells, was downregulated by PPD. Cyclin E2 is reported to specifically interact with CIP/KIP family of CDK inhibitors, and plays a role in cell cycle G1/S transition. The expression of cyclin E2 peaks at the G1-S phase and exhibits a pattern of tissue specificity distinct from that of cyclin E1 (34, 35). In addition, although not involved in top 20 upregulated gene list, CDKN1A (p21) was significantly upregulated by the treatment of PPD, which is consistent with previous reports that PPD analogs increased p21 expression in protein level (36, 37). The p21 binds to all G1/S cyclin-cdk complexes, in preventing the G1-S transition, leading to G1 arrest and inhibiting cell proliferation (38). Our cell cycle and gene expression assays suggested that the PPD-induced G1 cell cycle checkpoint blockage might result from the regulation of a number of gene clusters such as CDKN1A, CCNE2 and CCNA2.
An interesting issue was pathway activation or suppression. In our microarray analysis, apoptosis regulation, NF-κB, and m-TOR pathways, were transcriptionally activated when treated with PPD. A number of studies have investigated that these pathways are the crucial and essential in tumor initiation and progression (39-41). Among these pathways, the p53 pathway might be pivotal to controlling the human cancer cell response to PPD exposure. Two important members of the TNF family, DR4 and DR5, were significantly upregulated in our assays. The p53-DR5 crosstalk regulatory network might contribute to the induced apoptosis of ginsenoside Rg3, a derivative of PPD, in hepatoma cell lines and in vivo assays (42).
Previous studies have also shown that the upregulation of DR4 and DR5 sensitized to TRAIL-induced apoptosis (43, 44). The correlations between the tumor necrosis factor-related apoptosis-inducing ligand or TRAIL and human malignancies has been shown (Ref… …). The role of TRAIL in cancer……(2 sentences). In particular, studies have been shown that… TRAIL and colon cancer…. Ginseng is one of the most commonly used botanical in the world. In ginseng investigations, ..connection between the TRAIL (Ref…).
Moreover, the mechanisms have been described, including ER stress, ROS generation, p53 induction, NF-κB, and MAPK activation (44-46). Consistent with these studies, our data suggested that by regulation of crosstalk of the p53-DR4/DR5 interaction, a TRAIL pathway, PPD performed as a promising agent for anticancer application (26). The logical next step for TRAIL apoptotic pathway verification should be employing western blot or immunostaining to evaluate expressions of the key target regulators. These observations should lead to the marker identifications that reflect the responsiveness of colon tumor to PPD treatment.
In summary, the present study demonstrated that PPD possessed significant antitumor effects in an in vivo model. Human colorectal cancer lines, especially HTC-116 cells, are highly sensitive to the growth inhibition by PPD. The effects of the compound are associated with G1 cell cycle arrest and induction of apoptosis. Microarray analysis showed that PPD inhibited CRC cell growth by activation of a cluster of gene expression, including oncogenes as well as tumor suppressors. Our data suggested that by regulating the interactions between p53 and DR4/DR5, the TRAIL pathway played an important role in PPD’s CRC inhibition. Our data suggest that PPD may have potential in preventing colorectal tumorigenesis and treating CRC alone or in combination with other agents.
Acknowledgements
This work was supported in part by the grants of NIH/NCCAM AT004418 and AT005362, NIH/GM 074197 and 5P30DK042086, NIH/NCI CA149275, and DOD W81XWH-10-1-0077
Footnotes
Conflict of Interest
The authors report no conflict of interest.
References
- 1.Markowitz SD, Bertagnolli MM. Molecular origins of cancer: Molecular basis of colorectal cancer. N Engl J Med. 2009;361:2449–2460. doi: 10.1056/NEJMra0804588. [DOI] [PMC free article] [PubMed] [Google Scholar]
- 2.Jemal A, Ward E, Thun M. Declining death rates reflect progress against cancer. PLoS One. 2010;5:e9584. doi: 10.1371/journal.pone.0009584. [DOI] [PMC free article] [PubMed] [Google Scholar]
- 3.Hara K, Beppu T, Kimura M, Fujita Y, Takata T, Nishio K, et al. Influence of novel supramolecular substance, [2] rotaxane, on the caspase signaling pathway in melanoma and colon cancer cells in vitro. J Pharmacol Sci. 2013;122:153–157. doi: 10.1254/jphs.12244sc. [DOI] [PubMed] [Google Scholar]
- 4.Pollack JR. A perspective on DNA microarrays in pathology research and practice. Am J Pathol. 2007;171:375–385. doi: 10.2353/ajpath.2007.070342. [DOI] [PMC free article] [PubMed] [Google Scholar]
- 5.Inokuchi M, Uetake H, Shirota Y, Yamada H, Tajima M, Sugihara K. Gene expression of 5-fluorouracil metabolic enzymes in primary colorectal cancer and corresponding liver metastasis. Cancer Chemother Pharmacol. 2004;53:391–396. doi: 10.1007/s00280-003-0747-0. [DOI] [PubMed] [Google Scholar]
- 6.Ott MJ. Complementary and alternative therapies in cancer symptom management. Cancer Pract. 2002;10:162–166. doi: 10.1046/j.1523-5394.2002.103004.x. [DOI] [PubMed] [Google Scholar]
- 7.Zhou X, Lin J, Yin Y, Zhao J, Sun X, Tang K. Ganodermataceae: natural products and their related pharmacological functions. Am J Chin Med. 2007;35:559–574. doi: 10.1142/S0192415X07005065. [DOI] [PubMed] [Google Scholar]
- 8.Li XJ, Zhang HY. Western-medicine-validated anti-tumor agents and traditional Chinese medicine. Trends Mol Med. 2008;14:1–2. doi: 10.1016/j.molmed.2007.11.002. [DOI] [PubMed] [Google Scholar]
- 9.Newman DJ, Cragg GM. Natural products as sources of new drugs over the last 25 years. J Nat Prod. 2007;70:461–477. doi: 10.1021/np068054v. [DOI] [PubMed] [Google Scholar]
- 10.Du GJ, Dai Q, Williams S, Wang CZ, Yuan CS. Synthesis of protopanaxadiol derivatives and evaluation of their anticancer activities. Anticancer Drugs. 2011;22:35–45. doi: 10.1097/CAD.0b013e32833fde29. [DOI] [PMC free article] [PubMed] [Google Scholar]
- 11.Luo X, Chen J, Song WX, Tang N, Luo J, Deng ZL, et al. Osteogenic BMPs promote tumor growth of human osteosarcomas that harbor differentiation defects. Lab Invest. 2008;88:1264–1277. doi: 10.1038/labinvest.2008.98. [DOI] [PMC free article] [PubMed] [Google Scholar]
- 12.He BC, Chen L, Zuo GW, Zhang W, Bi Y, Huang J, et al. Synergistic antitumor effect of the activated PPARgamma and retinoid receptors on human osteosarcoma. Clin Cancer Res. 2010;16:2235–2245. doi: 10.1158/1078-0432.CCR-09-2499. [DOI] [PubMed] [Google Scholar]
- 13.He BC, Gao JL, Zhang BQ, Luo Q, Shi Q, Kim SH, et al. Tetrandrine inhibits Wnt/beta-catenin signaling and suppresses tumor growth of human colorectal cancer. Mol Pharmacol. 2011;79:211–219. doi: 10.1124/mol.110.068668. [DOI] [PMC free article] [PubMed] [Google Scholar]
- 14.Asano H, Horinouchi T, Mai Y, Sawada O, Fujii S, Nishiya T, et al. Nicotine- and tar-free cigarette smoke induces cell damage through reactive oxygen species newly generated by PKC-dependent activation of NADPH oxidase. J Pharmacol Sci. 2012;118:275–287. doi: 10.1254/jphs.11166fp. [DOI] [PubMed] [Google Scholar]
- 15.Jia Y, Guan Q, Guo Y, Du C. Echinacoside stimulates cell proliferation and prevents cell apoptosis in intestinal epithelial MODE-K cells by up-regulation of transforming growth factor-beta1 expression. J Pharmacol Sci. 2012;118:99–108. doi: 10.1254/jphs.11186FP. [DOI] [PubMed] [Google Scholar]
- 16.Irizarry RA, Bolstad BM, Collin F, Cope LM, Hobbs B, Speed TP. Summaries of Affymetrix GeneChip probe level data. Nucleic Acids Res. 2003;31:e15. doi: 10.1093/nar/gng015. [DOI] [PMC free article] [PubMed] [Google Scholar]
- 17.Karl T, Pabst R, von Horsten S. Behavioral phenotyping of mice in pharmacological and toxicological research. Experimental and toxicologic pathology : official journal of the Gesellschaft fur Toxikologische Pathologie. 2003;55:69–83. doi: 10.1078/0940-2993-00301. [DOI] [PubMed] [Google Scholar]
- 18.Siegel R, Ma J, Zou Z, Jemal A. Cancer statistics, 2014. CA: A Cancer Journal for Clinicians. 2014;64:9–29. doi: 10.3322/caac.21208. [DOI] [PubMed] [Google Scholar]
- 19.Wang CZ, Zhang B, Song WX, Wang A, Ni M, Luo X, et al. Steamed American ginseng berry: ginsenoside analyses and anticancer activities. J Agric Food Chem. 2006;54:9936–9942. doi: 10.1021/jf062467k. [DOI] [PubMed] [Google Scholar]
- 20.Wang CZ, Aung HH, Ni M, Wu JA, Tong R, Wicks S, et al. Red American ginseng: ginsenoside constituents and antiproliferative activities of heat-processed Panax quinquefolius roots. Planta Med. 2007;73:669–674. doi: 10.1055/s-2007-981524. [DOI] [PMC free article] [PubMed] [Google Scholar]
- 21.Popovich DG, Kitts DD. Structure-function relationship exists for ginsenosides in reducing cell proliferation and inducing apoptosis in the human leukemia (THP-1) cell line. Arch Biochem Biophys. 2002;406:1–8. doi: 10.1016/s0003-9861(02)00398-3. [DOI] [PubMed] [Google Scholar]
- 22.Popovich DG, Kitts DD. Mechanistic studies on protopanaxadiol, Rh2, and ginseng (Panax quinquefolius) extract induced cytotoxicity in intestinal Caco-2 cells. J Biochem Mol Toxicol. 2004;18:143–149. doi: 10.1002/jbt.20019. [DOI] [PubMed] [Google Scholar]
- 23.Liu J, Wang X, Liu P, Deng R, Lei M, Chen W, et al. 20(S)-Protopanaxadiol (PPD) analogues chemosensitize multidrug-resistant cancer cells to clinical anticancer drugs. Bioorg Med Chem. 2013;21:4279–4287. doi: 10.1016/j.bmc.2013.04.067. [DOI] [PubMed] [Google Scholar]
- 24.Zhang YL, Zhang R, Xu HL, Yu XF, Qu SC, Sui DY. 20(S)-protopanaxadiol triggers mitochondrial-mediated apoptosis in human lung adenocarcinoma A549 cells via inhibiting the PI3K/Akt signaling pathway. The American Journal of Chinese Medicine. 2013;41:1137–1152. doi: 10.1142/S0192415X13500778. [DOI] [PubMed] [Google Scholar]
- 25.Wang W, Rayburn ER, Hao M, Zhao Y, Hill DL, Zhang R, et al. Experimental therapy of prostate cancer with novel natural product anti-cancer ginsenosides. Prostate. 2008;68:809–819. doi: 10.1002/pros.20742. [DOI] [PubMed] [Google Scholar]
- 26.Musende AG, Eberding A, Wood CA, Adomat H, Fazli L, Hurtado-Coll A, et al. A novel oral dosage formulation of the ginsenoside aglycone protopanaxadiol exhibits therapeutic activity against a hormone-insensitive model of prostate cancer. Anticancer Drugs. 2012;23:543–552. doi: 10.1097/CAD.0b013e32835006f5. [DOI] [PubMed] [Google Scholar]
- 27.Kim do Y, Park MW, Yuan HD, Lee HJ, Kim SH, Chung SH. Compound K induces apoptosis via CAMK-IV/AMPK pathways in HT-29 colon cancer cells. J Agric Food Chem. 2009;57:10573–10578. doi: 10.1021/jf902700h. [DOI] [PubMed] [Google Scholar]
- 28.He BC, Gao JL, Luo X, Luo J, Shen J, Wang L, et al. Ginsenoside Rg3 inhibits colorectal tumor growth through the down-regulation of Wnt/ss-catenin signaling. Int J Oncol. 2011;38:437–445. doi: 10.3892/ijo.2010.858. [DOI] [PubMed] [Google Scholar]
- 29.Lee H, Cha S, Lee MS, Cho GJ, Choi WS, Suk K. Role of antiproliferative B cell translocation gene-1 as an apoptotic sensitizer in activation-induced cell death of brain microglia. J Immunol. 2003;171:5802–5811. doi: 10.4049/jimmunol.171.11.5802. [DOI] [PubMed] [Google Scholar]
- 30.Wolff NC, McKay RM, Brugarolas J. REDD1/DDIT4-Independent mTORC1 Inhibition and Apoptosis by Glucocorticoids in Thymocytes. Molecular cancer research : MCR. 2014;12:867–877. doi: 10.1158/1541-7786.MCR-13-0625. [DOI] [PMC free article] [PubMed] [Google Scholar]
- 31.Wang S, Li W, Xue Z, Lu Y, Narsinh K, Fan W, et al. Molecular imaging of p53 signal pathway in lung cancer cell cycle arrest induced by cisplatin. Mol Carcinog. 2012 doi: 10.1002/mc.21930. [DOI] [PubMed] [Google Scholar]
- 32.Kim DH, Park SE, Kim M, Ji YI, Kang MY, Jung EH, et al. A functional single nucleotide polymorphism at the promoter region of cyclin A2 is associated with increased risk of colon, liver, and lung cancers. Cancer. 2011;117:4080–4091. doi: 10.1002/cncr.25930. [DOI] [PubMed] [Google Scholar]
- 33.Biagioni F, Bossel Ben-Moshe N, Fontemaggi G, Canu V, Mori F, Antoniani B, et al. miR-10b*, a master inhibitor of the cell cycle, is down-regulated in human breast tumours. EMBO Mol Med. 2012;4:1214–1229. doi: 10.1002/emmm.201201483. [DOI] [PMC free article] [PubMed] [Google Scholar]
- 34.Gudas JM, Payton M, Thukral S, Chen E, Bass M, Robinson MO, et al. Cyclin E2, a novel G1 cyclin that binds Cdk2 and is aberrantly expressed in human cancers. Mol Cell Biol. 1999;19:612–622. doi: 10.1128/mcb.19.1.612. [DOI] [PMC free article] [PubMed] [Google Scholar]
- 35.Caldon CE, Sergio CM, Kang J, Muthukaruppan A, Boersma MN, Stone A, et al. Cyclin E2 overexpression is associated with endocrine resistance but not insensitivity to CDK2 inhibition in human breast cancer cells. Molecular Cancer Therapeutics. 2012;11:1488–1499. doi: 10.1158/1535-7163.MCT-11-0963. [DOI] [PubMed] [Google Scholar]
- 36.Jin YH, Choi J, Shin S, Lee KY, Park JH, Lee SK. Panaxadiol selectively inhibits cyclin A-associated Cdk2 activity by elevating p21WAF1/CIP1 protein levels in mammalian cells. Carcinogenesis. 2003;24:1767–1772. doi: 10.1093/carcin/bgg097. [DOI] [PubMed] [Google Scholar]
- 37.Zhang Z, Du GJ, Wang CZ, Wen XD, Calway T, Li Z, et al. Compound K, a Ginsenoside Metabolite, Inhibits Colon Cancer Growth via Multiple Pathways Including p53-p21 Interactions. Int J Mol Sci. 2013;14:2980–2995. doi: 10.3390/ijms14022980. [DOI] [PMC free article] [PubMed] [Google Scholar]
- 38.Harper JW, Elledge SJ, Keyomarsi K, Dynlacht B, Tsai LH, Zhang P, et al. Inhibition of cyclin-dependent kinases by p21. Mol Biol Cell. 1995;6:387–400. doi: 10.1091/mbc.6.4.387. [DOI] [PMC free article] [PubMed] [Google Scholar]
- 39.Chen J, McKay RM, Parada LF. Malignant glioma: lessons from genomics, mouse models, and stem cells. Cell. 2012;149:36–47. doi: 10.1016/j.cell.2012.03.009. [DOI] [PMC free article] [PubMed] [Google Scholar]
- 40.Gannon HS, Jones SN. Using Mouse Models to Explore MDM-p53 Signaling in Development, Cell Growth, and Tumorigenesis. Genes Cancer. 2012;3:209–218. doi: 10.1177/1947601912455324. [DOI] [PMC free article] [PubMed] [Google Scholar]
- 41.Minocha M, Khurana V, Qin B, Pal D, Mitra AK. Co-administration strategy to enhance brain accumulation of vandetanib by modulating P-glycoprotein (P-gp/Abcb1) and breast cancer resistance protein (Bcrp1/Abcg2) mediated efflux with m-TOR inhibitors. Int J Pharm. 2012;434:306–314. doi: 10.1016/j.ijpharm.2012.05.028. [DOI] [PMC free article] [PubMed] [Google Scholar]
- 42.Lee JY, Jung KH, Morgan MJ, Kang YR, Lee HS, Koo GB, et al. Sensitization of TRAIL-induced cell death by 20S-Ginsenoside Rg3 via CHOP-mediated DR5 upregulation in human hepatocellular carcinoma cells. Mol Cancer Ther. 2012 doi: 10.1158/1535-7163.MCT-12-0054. [DOI] [PubMed] [Google Scholar]
- 43.Kischkel FC, Lawrence DA, Chuntharapai A, Schow P, Kim KJ, Ashkenazi A. Apo2L/TRAIL-dependent recruitment of endogenous FADD and caspase-8 to death receptors 4 and 5. Immunity. 2000;12:611–620. doi: 10.1016/s1074-7613(00)80212-5. [DOI] [PubMed] [Google Scholar]
- 44.Sheridan JP, Marsters SA, Pitti RM, Gurney A, Skubatch M, Baldwin D, et al. Control of TRAIL-induced apoptosis by a family of signaling and decoy receptors. Science. 1997;277:818–821. doi: 10.1126/science.277.5327.818. [DOI] [PubMed] [Google Scholar]
- 45.Yamaguchi H, Wang HG. CHOP is involved in endoplasmic reticulum stress-induced apoptosis by enhancing DR5 expression in human carcinoma cells. J Biol Chem. 2004;279:45495–45502. doi: 10.1074/jbc.M406933200. [DOI] [PubMed] [Google Scholar]
- 46.Shetty S, Gladden JB, Henson ES, Hu X, Villanueva J, Haney N, et al. Tumor necrosis factor-related apoptosis inducing ligand (TRAIL) up-regulates death receptor 5 (DR5) mediated by NFkappaB activation in epithelial derived cell lines. Apoptosis. 2002;7:413–420. doi: 10.1023/a:1020031023947. [DOI] [PubMed] [Google Scholar]