

Summary
Fungal effector–host sensitivity gene interactions play a key role in determining the outcome of septoria nodorum blotch disease (SNB) caused by Parastagonospora nodorum on wheat. The pathosystem is complex and mediated by interaction of multiple fungal necrotrophic effector–host sensitivity gene systems. Three effector sensitivity gene systems are well characterized in this pathosystem; SnToxA–Tsn1, SnTox1–Snn1 and SnTox3–Snn3. We tested a wheat mapping population that segregated for Snn1 and Snn3 with SN15, an aggressive P. nodorum isolate that produces SnToxA, SnTox1 and SnTox3, to study the inheritance of sensitivity to SnTox1 and SnTox3 and disease susceptibility. Interval quantitative trait locus (QTL) mapping showed that the SnTox1–Snn1 interaction was paramount in SNB development on both seedlings and adult plants. No effect of the SnTox3–Snn3 interaction was observed under SN15 infection. The SnTox3–Snn3 interaction was however, detected in a strain of SN15 in which SnTox1 had been deleted (tox1–6). Gene expression analysis indicates increased SnTox3 expression in tox1–6 compared with SN15. This indicates that the failure to detect the SnTox3–Snn3 interaction in SN15 is due – at least in part – to suppressed expression of SnTox3 mediated by SnTox1. Furthermore, infection of the mapping population with a strain deleted in SnToxA, SnTox1 and SnTox3 (toxa13) unmasked a significant SNB QTL on 2DS where the SnTox2 effector sensitivity gene, Snn2, is located. This QTL was not observed in SN15 and tox1–6 infections and thus suggesting that SnToxA and/or SnTox3 were epistatic. Additional QTLs responding to SNB and effectors sensitivity were detected on 2AS1 and 3AL.
Keywords: Parastagonospora nodorum, necrotrophic effector, NE, epistasis, SnTox1, SnTox3, Triticum aestivum
Significance Statement
Fungal necrotrophic effectors (NE) interact directly or indirectly with the products of dominant sensitivity/susceptibility genes in the plant. A successful interaction results in host tissue necrosis and/or chlorosis which promote pathogen infection. Epistasis of NEs is poorly understood. Here we use a fungal‐wheat pathosystem to demonstrate that effector epistasis is due to interference with gene expression levels in the pathogen and not due to gene interactions in the host.
Introduction
Parastagonospora (syn. Stagonospora; Phaeosphaeria, Septoria) nodorum (Berk.) Quaedvlieg, Verkley & Crous is the causal agent of septoria nodorum blotch (SNB) on wheat (Solomon et al., 2006; Quaedvlieg et al., 2013). The fungus causes significant damage to leaves and glumes of wheat (Triticum aestivum) and is responsible for substantial yield losses in many wheat growing areas. In Western Australia, losses are estimated to amount to AUD$108 million (~US$97 million) per annum (Eyal et al., 1987; Murray and Brennan, 2009; Oliver et al., 2009).
Resistance to SNB is complex and often reported to be quantitative (Nelson and Gates, 1982; Schnurbusch et al., 2003; Xu et al., 2004; Aguilar et al., 2005; Friesen et al., 2008a). For the past two decades, much effort has been made using genetic markers to breed for SNB resistance but with limited progress due to the complexity of the disease (Ma and Hughes, 1995; Czembor et al., 2003; Schnurbusch et al., 2003). The main difficulty in this process was the lack of understanding of the underlying mechanism of disease resistance/susceptibility and pathogen virulence. Studies since 2006 have shown that the paramount factors controlling the level of SNB are multiple fungal necrotrophic effectors (NEs) (Friesen et al., 2006; Friesen and Faris, 2010; Oliver et al., 2012). These effectors interact either directly or indirectly with the products of dominant sensitivity/susceptibility genes located throughout the wheat genome. When such an interaction is present, host tissue necrosis and/or chlorosis occurs that promotes infection by the pathogen leading to disease (Faris et al., 2010; Tan et al., 2010).
To date, three NE proteins encoded on single copy genes have been identified. SnToxA encodes a 13.2 kDa mature protein that causes necrosis on wheat varieties that carry Tsn1 (Friesen et al., 2006; Faris et al., 2010). A near‐identical PtrToxA is also found in the tan spot fungus and may have been acquired from P. nodorum through horizontal gene transfer (Ciuffetti et al., 1997; Friesen et al., 2006). SnTox1 encodes a 10.3 kDa mature cysteine‐rich protein with a chitin‐like binding motif at the C‐terminus. Sensitivity to SnTox1 is conferred by the Snn1 gene located on wheat chromosome 1BS (Liu et al., 2004, 2012). SnTox3 is an intronless gene that codes for a 17.5 kDa mature protein with six cysteine residues. Sensitivity to SnTox3 is conferred by Snn3‐B1 and Snn3‐D1 located on wheat chromosomes 5BS and 5DS, respectively (Liu et al., 2009; Zhang et al., 2011). In addition, QTL analyses have revealed that the P. nodorum–wheat pathosystem is riddled with further effector–host sensitivity gene interactions such as SnTox2–Snn2, SnTox4–Snn4 and SnTox5–Snn5, SnTox6‐Snn6 and SnTox7‐Snn7 (Friesen et al., 2008a; Gao et al., 2015; Shi et al., 2015). Genes that code for these fungal effectors and host dominant susceptibility genes remained unidentified.
The NE model for SNB predicts that the severity of disease is a function of the number of effector/sensitivity gene interactions that operate in a given pathosystem (Friesen et al., 2007; Tan et al., 2012). However, investigations into the prevalence of SnToxA, SnTox1 and SnTox3 sensitivity in wheat cultivars revealed a poor correlation between the number of interactions, significance effect of each interaction and SNB severity (Oliver et al., 2009; Waters et al., 2011; Tan et al., 2014). In this study, our aim was to model effector–host sensitivity gene interactions in the establishment of SNB. Infection trials were performed using an established mapping population in which the SnTox1–Snn1 and SnTox3–Snn3 interactions are defined and SnToxA sensitivity is absent. Our results have revealed evidence that SnTox1–Snn1 is epistatic to SnTox3–Snn3 during the establishment of SNB as well the presence of more disease QTLs. The mechanism of epistasis was investigated and appears to involve differential SnTox3 expression.
Results
Response to SnTox1 and SnTox3 effectors
SnTox1 and SnTox3 were used to screen 177 lines of the Calingiri × Wyalkatchem (C × W) doubled‐haploid (DH) population for effector sensitivity. To ensure that SnTox1 possessed Snn1‐specific activity, we tested the recombinant protein on known effector‐sensitive (Chinese Spring) and insensitive (BG261) wheat lines (Liu et al., 2012). As expected, Chinese Spring was sensitive to the SnTox1 whereas BG261 was insensitive (Figure S1). To ensure that SnTox3 possessed Snn3‐specific activity, we tested the recombinant protein on known effector‐sensitive (BG220) and effector‐insensitive (BG261) wheat lines (Liu et al., 2009). As expected, BG220 was sensitive to SnTox3 whereas BG261 was insensitive (Figure S1). These effectors were infiltrated into leaves of Calingiri, Wyalkatchem and DH lines of the C × W population. Infiltrated leaves were scored as reported in Tan et al. (2012) for chlorosis and/or necrosis in the infiltrated zones. Calingiri was sensitive to SnTox1 and insensitive to SnTox3 whilst Wyalkatchem was insensitive to SnTox1 and sensitive to SnTox3 according to their genotype groups (Figure 1(a)). The DH lines of the C × W population segregated in a ratio of 90:87 and 102:75 sensitive to insensitive to SnTox1 and SnTox3, respectively. A chi‐squared test indicated that SnTox1 sensitivity fits a 1:1 ratio (P = 0.88) for the segregation of one gene controlling the effector sensitivity while that of SnTox3 was borderline insignificant suggesting there are other genes involved in response to SnTox3 (P = 0.05).
Figure 1.
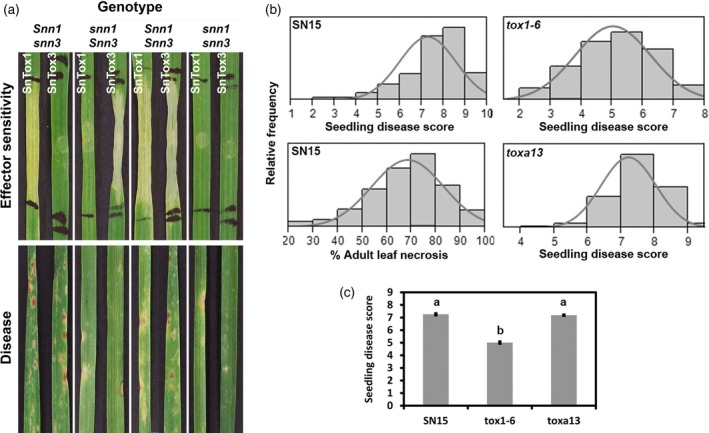
The SnTox1–Snn1 interaction is a major SNB determinant in the C × W population.
(a) Visual assessment of effector sensitivity and disease symptom on C × W DH lines. SnTox1 and SnTox3 infiltrations and disease symptoms from conidial inoculation of P. nodorum SN15 on DH lines of four genotype groups: Snn1/Snn3, Snn1/snn3, snn1/Snn3, snn1/snn3. Representative DH lines for each genotype are shown.
(b) The distribution of SN15, tox1–6 and toxa13 disease severity scores on the C × W population at the seedling stage and SN15 at the adult stage.
(c) Statistical analysis was used to compare the average SNB seedling scores between SN15, tox1–6 and toxa13. An analysis of variance (anova) using the Tukey–Kramer test was used to compare all treatments. a,bLevels not connected by the same letter are significantly different. SN15–tox1–6 P < 0.001; SN15–toxa13 P = 0.7530; toxa13–tox1–6 P < 0.001. Standard error bars are shown.
Segregation of the SnTox1 sensitivity in the population was aligned with diversity array technology (DArT) and simple sequence repeat (SSR) markers confirmed the co‐location with Snn1 on chromosome 1BS (Figure 2). 1BS explained 99% of the variation. Sensitivity to SnTox3 was mapped to 5BS and 4BL QTLs explaining 95 and 8% of the phenotypic variance observed in the experiment, respectively (Table 1). Both SnTox3 sensitivity QTLs are located in alleles that derived from Wyalkatchem. The 1BS and 5BS QTLs observed in this study are linked with markers that were previously demonstrated to be associated with Snn1 (psp3000 and cfp618) and Snn3 (wmc149 and cfd20), respectively (Friesen et al., 2008b; Reddy et al., 2008) (Figure 2). The 4BL QTL was not observed as a SnTox3 sensitivity locus in previous reports (Friesen et al., 2008b; Liu et al., 2009; Zhang et al., 2011) and appears as a unique attribute of the Calingiri × Wyalkatchem population thus far.
Figure 2.
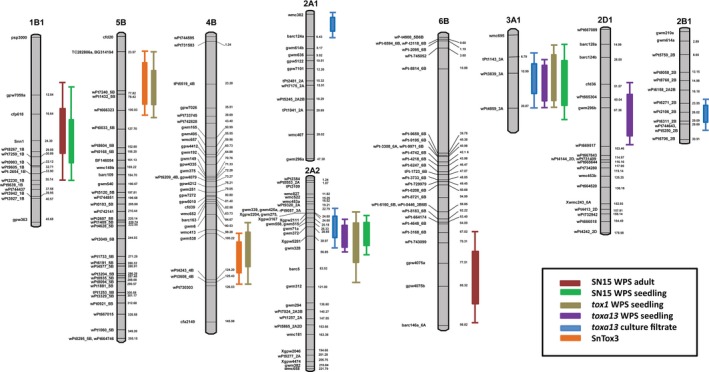
Composite interval mapping of quantitative trait loci (QTL) associated with toxa13 CF sensitivity and SNB caused by SN15, tox1–6 and toxa13.
Genetic maps of the chromosomes with genetic markers on the right and the centimorgan (cM) distances between loci are shown on the left. Snn1 (bold) was mapped as a trait marker in 1B1 in response to the SnTox1 effector.
Table 1.
A summary of SNB and effector sensitivity QTLs identified in this study. Details of the flanking markers, LOD scores, phenotype contribution (R 2) and parental effect of these QTLs are indicated. Positive and negative effects indicate the allele was inherited from Calingiri and Wyalkatchem, respectively
| Treatment | Chromosome arm | QTL | Locus/QTL flanking markers | LOD | R 2 | Effect |
|---|---|---|---|---|---|---|
| SnTox1 | 1BS | QSnb.fcu–1BS | Snn1 | 151 | 99 | 1.96 |
| SnTox3 | 5BS | QSnb.fcu–5BS | Snn3 | 268 | 95 | −3.95 |
| 4BL | Qsnb.cur–4BL | wmc413–wPt‐730303 | 2.5 | 8 | −1.15 | |
| Seedling infection with SN15 | 1BS | QSnb.fcu–1BS | Snn1 | 7 | 18 | 0.92 |
| 2AS1 | Qsnb.cur–2AS1 | gwm515–gwm328 | 3 | 7 | 0.52 | |
| 3AL | Qsnb.cur–3AL | tPt‐1143–wPT‐4859 | 3 | 7 | 0.57 | |
| Adult plant infection with SN15 | 1BS | QSnb.fcu–1BS | Snn1 | 7.3 | 19 | 13 |
| 6BS | Qsnb.cur–6BS | wPt‐3168–Xbarc146a | 3.0 | 10 | 9.11 | |
| Seedling infection with tox1‐6 | 2AS1 | Qsnb.cur–2AS1 | gwm339–gwm312 | 7.4 | 29 | 1.34 |
| 5BS | QSnb.fcu–5BS | Snn3 | 3.5 | 9 | −0.74 | |
| 4BL | Qsnb.cur–4BL | barc163–wPt‐4243 | 2.7 | 10 | −0.76 | |
| 3AL | Qsnb.cur–3AL | tPt‐1143–wPT‐4859 | 2.7 | 8 | 0.67 | |
| Seedling infection with toxa13 | 2AS1 | Qsnb.cur–2AS1 | tPt‐8937–gwm312 | 3.2 | 14 | 0.51 |
| 2DS | Qsnb.cur–2DS | cfd36–wPt‐669517 | 5.2 | 15 | −0.53 | |
| 3AL | Qsnb.cur–3AL | tPt‐1143–wPT‐4859 | 3.2 | 9 | 0.41 | |
| Culture filtrate of toxa13 | 2AS1 | Qsnb.cur–2AS1 | wPt‐9320–gwm328 | 4 | 13 | 0.79 |
| 3AL | Qsnb.cur–3AL | tPt‐1143–wPT‐4859 | 3.9 | 11 | 0.72 | |
| 2AS2 | Qsnb.cur–2AS2 | wmc382a–barc124a | 2.9 | 8 | −0.64 | |
| 2BS | Qsnb.cur–2BS | wPt‐6271–wPt‐6311 | 2.6 | 7 | −0.59 |
Response to P. nodorum SN15 infection on seedlings
Parents and DH lines were evaluated for susceptibility to the wild‐type P. nodorum strain SN15 at the seedling stage using conidial inoculation (Figure 1(b)). The average disease score (DS) of SN15 on C × W lines was 7.3 (Figure 1(c)). Calingiri was significantly more susceptible (DS, 7.7) than Wyalkatchem (DS, 5.0) (Table 2). When analysed based on genotype groupings, DH lines that were sensitive to SnTox1 were significantly more susceptible to SN15 than DH lines that were SnTox1 insensitive (Table 2). However, we did not observe any significant differences in susceptibility to SN15 between SnTox3 sensitive and insensitive DH lines (Table 2).
Table 2.
Least significant difference (LSD) was used to compare the susceptibility of different genotype combination the C × W population to SN15 and tox1–6 infection. SN15 was used to assess seedling and adult plant infection. P. nodorum tox1–6 was used to assess seedling plant infection only
| Genotype | No. of lines | Mean | Symptom range | LSD | P‐value |
|---|---|---|---|---|---|
| SNB adult (SN15) | % necrosis | ||||
| Calingiri | – | 29.2 | 18.82–39.52 | 2.03 | 0.034a |
| Wyalkatchem | – | 12.5 | 2.16–22.85 | ||
| Flag combined–Snn1 | 86 | 35.5 | 32.38–38.61 | 1.98 | 0.005a |
| Flag combined–snn1 | 83 | 29.1 | 25.90–32.24 | ||
| Flag combined–Snn3 | 75 | 33.5 | 30.12–36.93 | −2.43 | 0.358 |
| Flag combined–snn3 | 94 | 31.4 | 28.35–34.43 | ||
| Flag combined–snn1/Snn3 | 40 | 31.3 | 26.42–36.25 | −2.46 | 0.206 |
| Flag combined–snn1/snn3 | 43 | 27.0 | 22.21–31.7 | ||
| SNB seedling (SN15) | 1 (resistant) to 9 (fully necrotised) | ||||
| Calingiri | – | 7.7 | 6.23–9.10 | 0.82 | 0.016a |
| Wyalkatchem | – | 5.0 | 2.52–7.48 | ||
| Seedling–Snn1 | 86 | 7.5 | 7.31–7.74 | 0.21 | 0.001a |
| Seedling–snn1 | 84 | 7.0 | 6.70–7.23 | ||
| Seedling–Snn3 | 75 | 7.4 | 7.09–7.61 | −0.18 | 0.395 |
| Seedling–snn3 | 95 | 7.2 | 7.01–7.41 | ||
| Seedling–snn1/Snn3 | 40 | 7.2 | 6.89–7.55 | −0.06 | 0.088 |
| Seedling–snn1/snn3 | 44 | 6.8 | 6.50–7.15 | ||
| SNB seedling (tox1–6) | 1 (resistant) to 9 (fully necrotised) | ||||
| Calingiri | – | 5.3 | 3.87–6.80 | −0.4 | 0.089 |
| Wyalkatchem | – | 3.7 | 2.20–5.13 | ||
| Seedling–Snn1 | 85 | 4.9 | 4.61–5.13 | −0.11 | 0.161 |
| Seedling–snn1 | 84 | 5.1 | 4.87–5.40 | ||
| Seedling–Snn3 | 74 | 5.4 | 5.10–5.64 | 0.3 | 0.0004a |
| Seedling–snn3 | 95 | 4.7 | 4.48–4.95 | ||
Denote: significant difference (P < 0.05).
QTL analysis was carried out to identify the genomic regions that associated with the reaction to the disease at the seedling stage caused by SN15. Average means for DSs were used for composite interval mapping (CIM). QTLs with logarithm of the odds (LOD) score of greater than 2.5 were identified in the genomic regions of 1BS, 2AS1 and 3AL (Table 1, Figure 2). The 1BS region corresponding to Snn1 based on psp3000 and cfp618 markers had the largest contribution to seedling disease with 18% phenotype explained (Table 1 and Figure 2). Two other SNB QTLs were identified on chromosomes 2AS1 and 3AL, for which the susceptibility allele was derived from Calingiri (Table 1). Both QTLs contributed to 14% to the disease. We did not observe the 5BS and 4BL QTLs that were detected in response to SnTox3 infiltration.
Response to P. nodorum SN15 infection on adult plants
To determine if the involvement of the SnTox3–Snn3 interaction in SNB is age specific, 8‐week‐old wheat was infected with SN15 in an outdoor field trial. Mean reaction types of the DH lines ranged from 4.2 to 75% necrosis with an overall average of 32.34%. Calingiri and Wyalkatchem DSs were significantly different with average necrotic area of 29.2 and 12.5%, respectively (Table 2). SNB susceptibility was highly associated with sensitivity to SnTox1; DH lines that harboured the Snn1 allele were more susceptible to SNB than those that harboured the snn1 allele (Table 2). QTL analysis using CIM revealed a major QTL on chromosome 1BS, which explained 19% of the phenotypic variance. Another QTL on chromosome 6BS was also found to be significantly associated with SNB susceptibility albeit with smaller effect (Table 1 and Figure 2). Again, we did not observe the 5BS and 4BL QTLs that were associated with variation in sensitivity to SnTox3. Thus, SnTox1–Snn1 is epistatic to the SnTox3–Snn3 interaction.
Response to P. nodorum tox1–6 infection on seedlings
To dissect the mechanism of epistasis, we then created a P. nodorum SN15 strain deleted in SnTox1 (tox1–6) and repeated the infection assay on the C × W population at the seedling stage (adult plant assays are not permitted due to genetically‐modified organism biosafety regulations). The P. nodorum tox1–6 isolate was less pathogenic overall than was SN15 (Figure 1C). There were no significant differences in disease susceptibility between the Snn1 and snn1 lines (Table 2). However, lines that were sensitive to SnTox3 (DS, 5.4) were significantly more susceptible to P. nodorum tox1–6 than were SnTox3‐insensitive lines (DS, 4.7; P = 0.0004; Table 2). Using QTL mapping, we were able to detect the Snn3 5BS and 4BL QTLs which contributed to 9 and 10% of the disease, respectively (Table 1). This further demonstrated that SnTox1–Snn1 is epistatic to SnTox3–Snn3 in the establishment of SNB. Thus the removal of the SnTox1 gene exposed the SnTox3–Snn3 interaction that had been suppressed when SN15 was used as the infecting pathogen.
QTL analysis of the mean disease reaction scores conferred by tox1–6 on the genetic linkage map developed in this study revealed four QTLs (2AS1, 5BS, 4BL and 3AL) that are associated with tox1–6 seedling SNB (Figure 2 and; Table 1). The 2AS1 and 3AL QTLs were also associated with variation in the disease to conidial inoculation with SN15 while the 5BS and 4BL QTLs were associated with variation in sensitivity to SnTox3 (Figure 2). 3AL QTL was present contributing 8% to the total disease incidence (Table 1). However, the largest contribution to the disease caused by P. nodorum tox1–6 was from 2AS1 QTL. This contribution was much greater in tox1–6 suggesting that its effect may have been largely masked by the effect of the SnTox1–Snn1 interaction (Table 1).
Response to P. nodorum toxa13 culture filtrate and infection
P. nodorum toxa13 is a SN15 mutant that lacks SnToxA, SnTox1 and SnTox3 but retains pathogenicity and necrosis‐inducing activities in the culture filtrate (CF) (Tan et al., 2015). The strain and its CF were infected onto and infiltrated into the C × W population. A QTL on 2AS (2AS1) was associated with variation in sensitivity to the CF of toxa13 that contributed to 13% of the phenotype observed (Figure 2 and Table 1). The virulence of P. nodorum toxa13 on the C × W population at the seedling stage was comparable with that of SN15 (Figure 1(c)). The 2AS1 and 3AL QTLs were also associated with variation in susceptibility in the seedling disease. The contribution of the 2AS1 QTL in SNB was much greater in the SnTox1 mutants (toxa13 and tox1–6) than SN15 thus indicating that SnTox1–Snn1 was epistatic to the effector–2AS1 interaction. As expected, the 5BS and 4BL QTLs were not detected during P. nodorum toxa13 infection and CF infiltration as SnTox3 was deleted.
A significant seedling disease QTL, which is on an allele derived from Wyalkatchem, was detected on 2DS close to the marker cfd36. This marker is also located close to the genomic location of Snn2 on 2DS (Shi et al., 2015). Intriguingly, the 2DS QTL was not observed with the SN15 and tox1–6 infections. We have also identified two additional QTLs (2AS2 and 2BS) that were associated with variation in sensitivity to toxa13 CF. However, these QTLs were not observed to be associated with variation in the seedling disease.
SnTox3 expression was elevated in the absence of SnTox1
We previously demonstrated that the SnTox1 and SnTox3 genes were highly expressed during the early stage of infection (Liu et al., 2009; Ipcho et al., 2012). Here, we investigated if these effector genes are expressed in the presence and absence of their corresponding effector sensitivity genes and if their expression levels are associated with the SNB susceptibility using quantitative real‐time PCR (qRT‐PCR). Twenty DH lines that encompass all four genotypic combinations (Snn1/Snn3, Snn1/snn3, snn1/Snn3 and snn1/snn3) were used for expression analysis of SnTox1 and SnTox3 with SN15. No significant differences in SnTox1 and SnTox3 expression were observed during infection on all the genotype combinations (Figure 3). This indicates that differences in the wheat genotype do not influence SnTox1 and SnTox3 expression in SN15.
Figure 3.
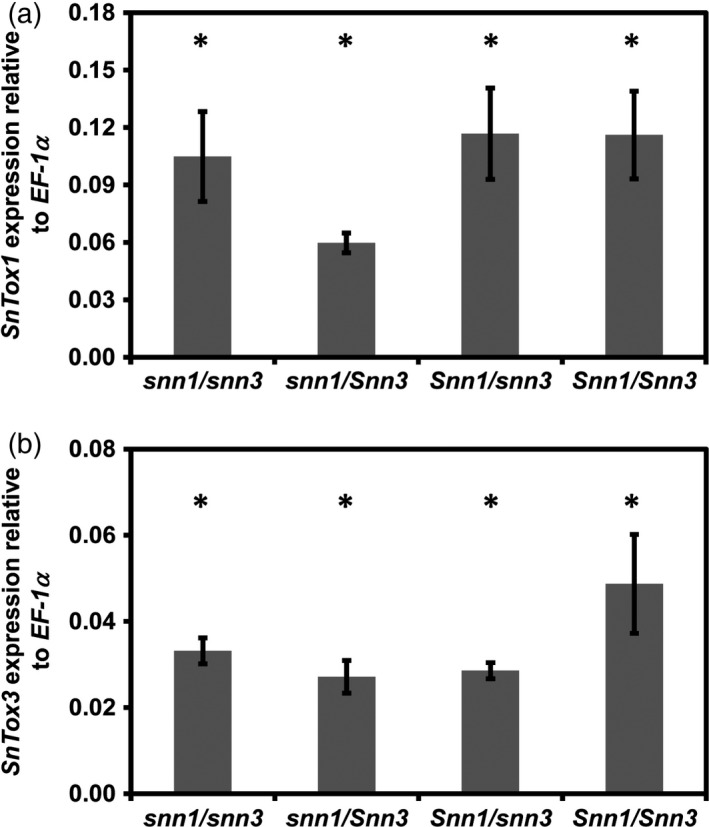
The host genotype does not affect the level of SnTox3 expression in SN15 during infection.
(a) SnTox1 expression was compared among snn1/Snn3, snn1/snn3, Snn1/Snn3 and Snn1/snn3 C × W DH genotype groups. No significant differences in SnTox1 expression was observed (P = 0.371).
(b) No significant differences in SnTox3 expression was observed in all genotype groups (P = 0.396). Average gene expression was calculated from four lines per genotype performed in biological replicates (n = 4). Standard error bars are shown. ‘*’Indicates similar statistical grouping using anova.
We then determined the SnTox3 expression levels in P. nodorum tox1–6 infection on Snn1/Snn3, Snn1/snn3, snn1/Snn3 and snn1/snn3 genotypes to see if SnTox1 deletion resulted in differential SnTox3 expression under this combination of genotypes (Figure 4(a)). No significant differences in SnTox3 expression in P. nodorum tox1–6 against all possible genotype combinations were observed. This confirms that the wheat genotype does not influence SnTox3 expression in P. nodorum tox1–6.
Figure 4.
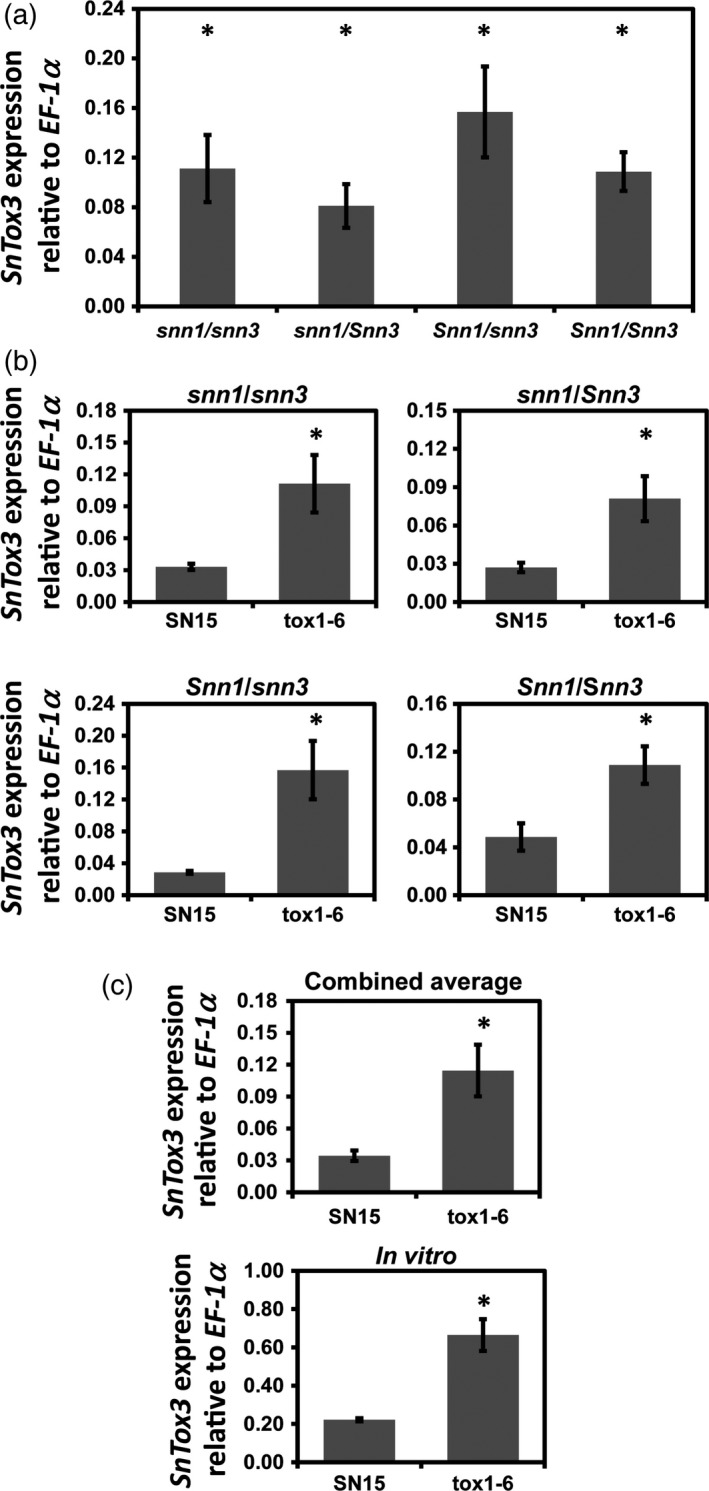
SnTox3 expression is elevated in the SnTox1 deletion background.
(a) Comparison of SnTox3 expression in P. nodorum tox1–6 during infection of snn1/Snn3, snn1/snn3, Snn1/Snn3 and Snn1/snn3 C × W DH groups. ‘*’Indicates similar statistical grouping using anova (P = 0.808). Average gene expression was calculated from four lines per genotype performed in biological replicates (n = 4).
(b) A comparison of SnTox3 expression in SN15 and tox1–6 during infection on different genotype combinations. Average gene expression was calculated from four lines per genotype performed in biological replicates (n = 4).
(c) SnTox3 expression in SN15 and tox1–6 during growth in vitro. ‘*’Denotes significant difference in a t‐test. The SnTox3 expression profile was also tested on two other tox1 isogenic strains in vitro (Figure S4). The experiment was performed in biological triplicates. Standard error bars are shown for all graphs.
The expression of SnTox3 in SN15 and tox1–6 on all four possible wheat combinations was compared. Expression data were collected from lines representing all four possible genotype combinations. SnTox3 expression was consistently greater in tox1–6 than SN15, ranging from 2.2‐ to 5.4‐fold more (Figure 4(b)). When averaged, SnTox3 expression in P. nodorum tox1–6 was 3.3‐fold more than in SN15 (Figure 4(b)). The expression of SnTox3 was also significantly higher in tox1–6 than SN15 when grown in a broth medium conducive to SnTox3 production (Figure 4(c)). This suggests that the regulation of SnTox3 expression is linked to SnTox1 at the pathogen level independent of the host. To ensure that this observation is not a strain‐specific artefact, we then examined SnTox3 expression in two other independent SnTox1‐deleted strains tox1–7 and tox1–8 in vitro. Like tox1–6, SnTox3 expression was significantly higher in tox1–7 and tox1–8 than SN15 (Figure S4).
To determine if an oversupply of SnTox3 increases the virulence of P. nodorum, we pre‐infiltrated Snn3 and snn3 lines with SnTox3 protein and a buffer control. Following this, we infected infiltrated plants with P. nodorum SN15. This approach provides the SN15 wild‐type with a surplus of SnTox3 during the infection process. Fungal biomass was determined using qRT‐PCR analysis of the genomic DNA content. It was observed that there was 3.2‐ to 6.2‐fold more fungal biomass in Snn3 wheat lines infiltrated with SnTox3 than those infiltrated with the buffer control (Figure 5). Conversely, SnTox3 infiltration in wheat cultivars that lacked Snn3 did not result in an increased fungal biomass of SN15 (Figure 5). This suggests that an oversupply of SnTox3 greatly accelerates SN15 growth on Snn3 but not snn3 wheat lines.
Figure 5.
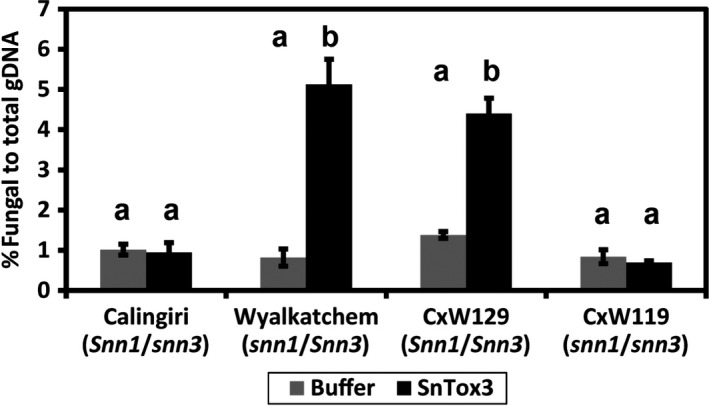
SnTox3 infiltration increases the virulence of P. nodorum SN15 on Snn3 wheat cultivars.
Total fungal DNA was measured from the amplification of Act1 normalised against total DNA. A t‐test was used to compare the amount of fungal DNA between SnTox3‐ and buffer‐infiltrated treatments infected with SN15. a,bLevels not connected by the same letter are significantly different (P < 0.05). Standard error bars are shown. The experiment was performed in biological triplicates.
Discussion
Effector‐assisted breeding has been enthusiastically adopted by Australian plant breeders to combat both SNB and tan (yellow leaf) spot (TS) (Vleeshouwers and Oliver, 2014). In the case of TS, insensitivity to ToxA is a dominating factor and strongly predicts SNB susceptibility at both seedling and adult stages. The use of ToxA to screen germplasm for sensitivity throughout the breeding process has accordingly made a demonstrable impact on disease losses (Vleeshouwers and Oliver, 2014). In the case of SNB, a more complex situation exists and therefore the priorities and strategies for the use of effectors are not obvious. Three SNB effectors have been deployed for effector‐assisted breeding and others remain to be discovered. All recommended wheat cultivars for sowing in 2013 by the Department of Agriculture and Food of Western Australia were sensitive to at least one of the known effectors. Seventy per cent and more than 90% of those cultivars were sensitive to SnTox1 and SnTox3 respectively (Tan et al., 2014). Moreover, SnTox1 and SnTox3 were present in 96% of Australian P. nodorum isolates (McDonald et al., 2013). This current study was designed therefore to investigate how these two defined interactions operate together in causing SNB using a DH population developed from two popular varieties, Calingiri and Wyalkatchem, uniquely sensitive to SnTox1 and SnTox3 respectively.
Effector sensitivity assay predicts adult plant responses
SNB is a complex disease. Numerous QTLs identified in almost every wheat chromosome have been reported, some of them are specifically identified at seedling stage, some are exclusive to adult plants (Czembor et al., 2003; Schnurbusch et al., 2003; Arseniuk et al., 2004; Aguilar et al., 2005; Friesen et al., 2008a, 2012; Shankar et al., 2008; Abeysekara et al., 2009; Oliver et al., 2012). It is therefore crucial that SNB resistance operates both at seedling and adult plant stages. This study shows that Snn1 confers susceptibility to SNB and was a contributor to the disease on seedlings and in adult plants. Similar results were also demonstrated by Friesen et al. (2009) where SnToxA–Tsn1 and SnTox2–Snn2 interactions predicted adult resistance. Thus, SnTox1 sensitivity is a good indicator of the plant response at the seedling and adult growth stages to P. nodorum isolates possessing SnTox1. It was noted that in all infection and CF infiltration assays, only a portion of the phenotypic variation can be explained by genetic factors. For instance, only 29% of the phenotypic variation was explained by QTLs where the LOD score is >2.5 in the adult plant infection assay. This can be partly explained by environmental factors such as natural infections (Schnurbusch et al., 2003), minor QTLs (LOD score <2.5), the not fully covered genetic linkage map used in this study and/or parents of the DH population that may possess a common SNB susceptibility allele.
The role of effector epistasis
Both epistatic and additive interactions have been observed in previous studies with SNB effectors (Friesen et al., 2007, 2008b, 2009) but the mechanism(s) have not been analysed. Three compatible interactions (SnTox3–Snn3, SnTox2–Snn2 and SnToxA–Tsn1) were analysed in both SNB seedling and adult plants. SnTox2–Snn2 and SnToxA–Tsn1 interactions were found to be additive and contributed significantly to the SNB susceptibility in both seedling and adult stages whilst the SnTox3–Snn3 interaction was not detected (Friesen et al., 2009). In addition to SnToxA–Tsn1 and SnTox2–Snn2, the SnTox5–Snn5 interaction is epistatic to SnTox3–Snn3 (Friesen et al., 2012). The frequent observation that the SnTox3–Snn3 interaction can be eliminated by most of the other known NE interactions is intriguing and so far unexplained. We investigated two questions to explain the epistasis of SnTox1–Snn1 over SnTox3–Snn3 in order to further dissect this phenomenon. Firstly, is the epistasis occurring at the host or pathogen level? Lastly, was SnTox3 expression suppressed in the presence of SnTox1?
The mechanism of necrotrophic effector epistasis has remained obscure until now. Friesen et al. (2008b) proposed that possible mechanisms of epistasis might involve effector gene expression, host gene action, and/or interaction among associated pathways. Another explanation is that several pathways may be involved in effector‐mediated disease. Multiple effectors could be using the same pathway and only the most efficient effector will prevail and manifest disease. We examined several possible mechanisms to explain the epistasis of SnTox3–Snn3 by SnTox1–Snn1. Firstly, we evaluated Snn1 and Snn3 for evidence of interactions that could explain the mechanism of epistasis but found no evidence that suggests a QTL × QTL effect. Interaction between QTLs involved in disease resistance has been observed in other pathosystems (Wang et al., 1994; Lefebvre and Palloix, 1996; Kump et al., 2011; Liu et al., 2014). Uphaus et al. (2007) examined SNB QTLs for glume resistance and found no evidence of QTL interactions. This eliminates the role of epistasis dictated at the host level. We then examined for indication of effector gene expression regulation by the recognition loci in wheat. We found no evidence to indicate that expression of SnTox1 and SnTox3 was influenced by the plant genotype differing in the Snn1/snn1–1BS and Snn3/snn3–5BS loci. Faris et al. (2011) observed that the expression of SnToxA was upregulated in the P. nodorum SN5 American wild‐type isolate in response to different wheat genotypes. This phenomenon appears isolate‐specific as the expression of SnToxA from the P. nodorum SN4 American wild‐type isolate did not differ significantly between different wheat genotypes (Faris et al., 2011).
We then hypothesised that epistasis between the SnTox1–Snn1 and SnTox3–Snn3 is occurring at the pathogen level. We observed a significantly higher expression of SnTox3 in the absence of SnTox1 (Figure 4) indicating that the SnTox1–Snn1 epistasis over SnTox3–Snn3 observed in this study occurred at the pathogen level through transcriptional suppression. This finding is consistent with the observation of Faris et al. (2011) of a positive correlation between the expression level of SnToxA and disease contribution of the SnToxA–Tsn1 interaction.
Unmasking other SNB and effector sensitivity QTLs
In addition to Snn3 on 5BS, a homeologous Snn3 was identified from the ‘D’ genome donor Aegilops tauschii, (Zhang et al., 2011). In this study, we did not observe the homeolog but identified another minor SnTox3 sensitivity QTL on 4BL that was detected together with Snn3 from SnTox3 infiltration and reaction to tox1–6 infection. The 4BL QTL was also identified as a glume blotch resistance QTL in the Arina × Forno winter wheat population through a common genetic marker (gwm538) (Schnurbusch et al., 2003).
Other SNB QTLs were identified on chromosomes 2AS1, 3AL, 2DS and 6BS. Not surprisingly, the phenotypic effects of these SNB QTLs was greater in P. nodorum mutant strains that lacked SnTox1 and all three cloned effectors thus further demonstrating evidence of effector epistasis. The 6BS QTL was observed in adult SNB in this study while previously, Aguilar (2004) identified a 6B QTL that was associated with seedling SNB. The 2AS1 SNB QTL detected in this study was also identified as a SNB QTL in the Arina × Forno population infected with P. nodorum through a common genetic marker (gwm372) (Abeysekara et al., 2009). The 2AS1 and 3AL SNB QTLs also co‐located with effector sensitivity QTLs that were detected in P. nodorum toxa13 CF infiltration assays. As such, a biochemical purification approach is currently being used to identify these effectors.
Interestingly, the toxa13 isolate is as virulent as SN15. The presence of SnToxA, SnTox1 and SnTox3 may have an epistatic effect on the activity or expression of undiscovered effectors as in the case of SnTox3 in the tox1–6 isolate. In the TS fungus Pyrenophora tritici‐repentis, ToxA is epistatic to the activity of undiscovered host‐selective toxins and disease (Manning and Ciuffetti, 2015). We detected the 2DS QTL in the seedling disease only when SnToxA, SnTox1 and SnTox3 were deleted in P. nodorum. We hypothesise that the removal of SnToxA, SnTox1 and SnTox3 unmasked the SnTox2–Snn2 interaction which then contributed to the disease using the C × W population. However, the activity of SnTox2 was not detected in the toxa13 CF. This in vitro condition also does not induce significant SnToxA production in our hands (Tan et al., 2014). This suggests that SnTox2 is not expressed in vitro or it is masked by other undiscovered effectors in the CF.
In conclusion, the epistatic effect was not due to interactions of genes within the host but rather through interference in gene expression levels in the pathogen. Furthermore, we have further demonstrated functional redundancy of the P. nodorum effector system with evidence of increased disease contributions in the absence of SnToxA, SnTox1 and SnTox3. More work will certainly be followed to obtain a deeper insight into the mechanism of epistasis and effector gene regulation. As such, we are using several approaches that include RNAseq to identify candidate effector genes in SnToxA, 1 and 3 knockout mutants and exonuclease protection assays of effector gene promoters to identify DNA‐binding regulatory proteins.
Experimental procedures
Biological material
A wheat population consisting of 177 DH lines derived from a cross between Calingiri and Wyalkatchem were used for molecular mapping and genetic analysis of reactions to effectors and SNB caused by an Australian P. nodorum wild‐type isolate.
All P. nodorum strains used in this study were maintained on V8‐PDA agar (150 ml L−1 Campbell's V8 juice, 3 g L−1 CaCO3, 10 g L−1 Difco PDA and 10 g L−1 agar) at 21°C under a 12‐h photoperiod prior to scoring.
Construction of SnTox1 gene deletion P. nodorum mutants
In this study, P. nodorum SN15 strains carrying a SnTox1 deletion were constructed through homologous recombination using the SnTox1 gene knockout method described in Tan et al. (2014). The SnTox1 deletion construct harbouring a phleomycin resistance cassette (Tan et al., 2014) was transformed into SN15. PCR was used to identify the appropriate mutants deleted in SnTox1. PCR was used to validate transformants that carry SnTox1 deletion. Three isolates carrying the desired SnTox1 deletion were identified by PCR. All three strains possessed a single integration of the SnTox1 knockout cassette (Figure S2). From here, tox1 mutants were confirmed to carry only a single copy insertion using primers 5_Tox1qPCR‐F and 5_Tox1qPCR‐R (Figure S2 and Table S1) by a robust quantitative PCR approach (Solomon et al., 2008). P. nodorum tox1–6 possesses single copy vector integration and was retained for phenotypic analysis.
Effector expression and infiltration
Proteins derived from SnTox1 (SNOG_20078; GenBank acc, XP_001797505) and SnTox3 (SNOG_08981; GenBank acc; XP_001799284) were expressed in Pichia pastoris using the pGAPzA expression vector. CFs containing the expressed protein were harvested and desalted with 10 mm sodium phosphate buffer pH 7.0 as previously described (Liu et al., 2009).
CF containing necrosis‐inducing factors from P. nodorum toxa13 (SN15 deleted in SnToxA, SnTox1 and SnTox3) was produced in Fries 3 broth as previously described (Liu et al., 2004; Tan et al., 2015). The CF was filter sterilised prior to plant infiltration.
Effector assays were performed using a simple leaf infiltration technique (Oliver et al., 2009). A 1‐mL plastic syringe was used to infiltrate the expressed proteins into the first leaf of 2‐week‐old wheat seedlings. Plants were kept in a Conviron growth chamber for 5 days at 21°C under a 12‐h photoperiod prior to scoring. Following this, plants were visually evaluated for effector sensitivity on a scale of ‘0’ to ‘4’ as described in Tan et al. (2012). A score of 0 indicates insensitivity (no reaction); 1, slight chlorosis; 2, extensive chlorosis; 3, extensive chlorosis with some necrosis; and 4, complete necrosis. CF derived from P. pastoris transformed with an empty pGAPzA vector was used as a negative infiltration control to ensure that chlorotic/necrotic symptoms from SnTox1 and SnTox3 were caused by the expressed protein (Waters et al., 2011; Tan et al., 2014). All infiltrations were carried out in biological triplicates.
Whole plant infection assay
Seedling infection was performed by whole plant spray as described in Solomon et al. (2003). Pycnidiospore inoculum was prepared to a concentration 1 × 10⁶ spores ml−1 in 0.5% (w/v) of gelatin. The 177 DH lines, together with parental lines were planted in a completely randomised design in three replicates. Six seeds of each line were planted in a 12 cm‐dimension pot and considered as a repeat. Two‐week‐old wheat seedlings were sprayed with the inoculum preparation using a hand‐held air brush sprayer onto 2‐week‐old seedlings until run‐off. Plants were placed in 100% relative humidity at 21°C in the light for 48 h, followed by 5 days at 21°C under a 12‐h photoperiod prior to scoring. An observed score of one indicates no disease symptoms and a score of nine indicates a fully necrotised plant.
For the adult plant assay, the C × W population was evaluated for SNB susceptibility using an outdoor field trial. Here, 177 DH lines and parents were planted in a randomised complete block in hill‐plots seeding method of 8–10 seeds each hill/line. The field trial arranged in 10 hills wide with 30 cm spacing between hills in all directions. The field trial was bordered by two rows Yitpi variety. The SN15 pycnidiospore inoculum consisting of 1 × 10⁶ spores mL−1 in 0.5% w/v gelatin was sprayed on 8‐week‐old plants until run‐off. Disease was allowed to develop for 14 days before scoring. Within each hill plot, three individual plants were chosen randomly for disease scoring. Disease severity was scored on flag leaves‐2 (Flag‐2) and flag leaves‐3 (Flag‐3) as percentages of necrotic leaf‐area (Eyal et al., 1987). The infection assay was conducted in the winter growing season that is conducive to the development of SNB (http://www.herbiguide.com.au/Descriptions/hg_Septoria_Nodorum_Blotch_of_Wheat.htm).
Molecular mapping and QTL analysis
In total, 365 DArT and 117 wheat genomic SSR and EST‐SSR markers were used to construct a genetic map of this C × W population (Figure S3). The DArT marker set was generated from wheat DArT (Diversity Arrays Technology Pty Ltd, Australia; http://www.diversityarrays.com/). The 117 genomic SSR and EST‐SSR markers were added only to chromosomes/chromosome arms of interest including 1BS, 5BS, 4B and 2A. The mapped markers were identified to be polymorphic between Calingiri and Wyalkatchem of the total 345 SSR and 50 EST‐SSR markers screened. The wheat SSR markers were carefully chosen as being either mapped in the international consensus wheat physical/genetics map in those particular wheat chromosomes or linked to our interested traits published in other studies (Somers et al., 2004; Sourdille et al., 2004; Friesen et al., 2008a; Reddy et al., 2008; Zhang et al., 2011).
Genetic linkage mapping was conducted with multipoint v. 3.2 software (MultiQTL Ltd, Institute of Evolution, Haifa University, Israel). The Kosambi mapping function was used to convert the recombination frequencies into genetic distance (cM). Chi‐squared analysis was applied to test the segregation of the mapped markers against the expected Mendelian segregation ratio for co‐dominant inheritance in a DH population. Groups of linked markers that were similarly distorted were accepted for linkage mapping and QTL analysis. Independent markers showing significant segregation distortion and markers with missing data (10%) were rejected for linkage and QTL analysis to avoid bias and false linkages. Association between each linkage group and the putative QTL regions related to effector responses in effector assay, SN15 conidial responses in seedling experiment and percentage of green area in adult field trial were determined by CIM using multiqtl software, version 2.5 (MultiQTL Ltd, Institute of Evolution, Haifa University, Israel). Significance levels for each QTL detected were determined with 1000 permutations and the standard deviation for each QTL determined by 1000 Bootstraps. QTLs with a LOD score 2.5 were retained for analysis.
RNA isolation and gene expression analysis
To investigate the expression of SnTox1 and SnTox3 during infection, 2‐week‐old seedlings of a subset of C × W parents and 20 progeny lines were sprayed with SN15 and tox1–6 spores in two independent experiments with the same conditions as described above. These 20 lines were carefully chosen so that they represented all four genotype groups (Snn1/Snn3, Snn1/snn3, snn1/Snn3 and snn1/snn3; five lines each genotype group). Thereafter, infection was allowed to develop for 48 h prior to sampling. For SnTox3 in vitro expression analysis, SN15 and tox1–6 were grown in Fries 3 broth for 3 days at 22°C. RNA isolation, cDNA synthesis and gene expression analysis were performed as previously described (Tan et al., 2008). Intron‐spanning primers ActinF and ActinR designed to amplify the Act1 (GenBank acc, EAT90788) gene were used to check all cDNA samples via PCR analysis (Tan et al., 2008). All cDNA preparations were shown to be free of genomic DNA. This was repeated with tox1–7 and tox1–8. The expression of SnTox1 and SnTox3 were determined via qRT‐PCR on a CFX96 Real‐Time PCR Detection System (Bio‐Rad, Hercules, CA). Elongation factor 1α (EF‐1α (GenBank acc, XP_001801902) and actin Act1 housekeeping genes were used as a constitutively expressed control for normalisation using the EF‐1alphaF/R and ActinqpcrF/R primer pairs (Tan et al., 2008). All reactions were performed in technical duplicates from three biological triplicates. Primers used for the qRT‐PCRs are described in Table S1.
Fungal biomass analysis
Fungal biomass was determined using qRT‐PCR. SnTox3 and a phosphate buffer control were infiltrated into selected wheat cultivars at the 2‐week‐old seedling stage. Infiltrated leaves were left for 24 h to dry prior to a spray application of SN15 pycnidiospores as described above. Infection was allowed to develop for 4 days prior to sampling and DNA extraction of the infiltrated region using a Biosprint genomic DNA extraction kit (Qiagen, Qiagen, Venlo, Netherlands). Following this, 125 ng of total genomic DNA was used in each qPCR reaction. The amount of P. nodorum SN15 genomic DNA was determined using the ActinqpcrF/R primer pair measured against a SN15 only genomic DNA standard. Fungal biomass was expressed as a percentage of SN15 DNA relative to total DNA.
Statistical analysis
Statistical analysis was performed using jmp 10.0.0 (SAS Institute, CA, USA). Bartlett's test was carried out to determine the homogeneity of variances among different leaves. A t‐test was used to test disease difference caused by different allelic groups of Snn1 or snn1 and Snn3 or snn3 groups. LSDs were calculated using the Student's t‐test. Statistical analysis for LSD was deemed significantly different if the P‐value is ≤0.05. One‐way analysis of variance (anova) and all pairs Tukey honest significant difference (HSD) analysis were used to compare SnToxA, SnTox1 and SnTox3 expression in all four genotype groups (Snn1/snn3, Snn1/Snn3, snn1/Snn3, and snn1/snn3). Statistical analyses for anova and t‐test were deemed significantly different if the P‐value was <0.05. Standard error bars are shown when possible.
Supporting information
Figure S1. SnTox1 and SnTox3 infiltrations on differentially sensitive wheat lines.
Figure S2. Copy number of the SnTox1–phleomycin resistance gene knockout cassette normalised to a single copy of Act1.
Figure S3. Genetic map of the C × W DH population. Linkage groups are indicated.
Figure S4. SnTox3 expression was elevated in two other P. nodorum SnTox1 deletion strains (tox1–7 and tox1–8) compared to SN15.
Table S1. Primers used in this study.
Acknowledgements
This study was supported by the Centre for Crop and Disease Management (CCDM) and the Australian research Council (ARC). The CCDM is a joint initiative of Curtin University and the Grains Research and Development Corporation through research grants CUR00012 and CUR00023 (Programme 3), University of Adelaide Grains Research and Development Corporation project number UA00102, ARC project number DP120103558 and the Future fellowship FT110100698. We thank Dr Diane Mather and Dr Kenneth Chalmers (University of Adelaide) for providing some of the genotype data for mapping. We thank Intergrain (Perth, Australia) for supplying the mapping population. The funders had no role in study design, data collection and analysis, decision to publish, or preparation of the manuscript.
Contributor Information
Richard P. Oliver, Email: Richard.Oliver@curtin.edu.au
Kar‐Chun Tan, Email: Kar-Chun.Tan@curtin.edu.au.
References
- Abeysekara, N.S. , Friesen, T.L. , Keller, B. and Faris, J.D. (2009) Identification and characterization of a novel host‐toxin interaction in the wheat‐Stagonospora nodorum pathosystem. Theor. Appl. Genet. 120, 117–126. [DOI] [PubMed] [Google Scholar]
- Aguilar, V. (2004) Genetic Analysis and Early Testing of Stagonospora nodorum Blotch Resistance in Hexaploid Wheat (ETH No. 1562). Zurich: ETHZ. [Google Scholar]
- Aguilar, V. , Stamp, P. , Winzeler, M. , Winzeler, H. , Schachermayr, G. , Keller, B. , Zanetti, S. and Messmer, M.M. (2005) Inheritance of field resistance to Stagonospora nodorum leaf and glume blotch and correlations with other morphological traits in hexaploid wheat (Triticum aestivum L.). Theor. Appl. Genet. 111, 325–336. [DOI] [PubMed] [Google Scholar]
- Arseniuk, E. , Czembor, P.C. , Czaplicki, A. , Song, Q.J. , Cregan, P.B. , Hoffman, D.L. and Ueng, P.P. (2004) QTL controlling partial resistance to Stagonospora nodorum leaf blotch in winter wheat cultivar Alba. Euphytica, 137, 225–231. [Google Scholar]
- Ciuffetti, L.M. , Tuori, R.P. and Gaventa, J.M. (1997) A single gene encodes a selective toxin causal to the development of tan spot of wheat. Plant Cell, 9, 135–144. [DOI] [PMC free article] [PubMed] [Google Scholar]
- Czembor, P.C. , Arseniuk, E. , Czaplicki, A. , Song, Q. , Cregan, P.B. and Ueng, P.P. (2003) QTL mapping of partial resistance in winter wheat to Stagonospora nodorum blotch. Genome, 46, 546–554. [DOI] [PubMed] [Google Scholar]
- Eyal, Z. , Scharen, A.L. , Prescott, J.M. and van Ginkel, M. (1987) The Septoria Diseases of Wheat: concepts and Methods of Disease Management Texcoco. Mexico: CIMMYT. [Google Scholar]
- Faris, J.D. , Zhang, Z. , Lu, H. et al. (2010) A unique wheat disease resistance‐like gene governs effector‐triggered susceptibility to necrotrophic pathogens. Proc. Natl Acad. Sci. USA 107, 13544–13549. [DOI] [PMC free article] [PubMed] [Google Scholar]
- Faris, J.D. , Zhang, Z. , Rasmussen, J.B. and Friesen, T.L. (2011) Variable expression of the Stagonospora nodorum effector SnToxA among isolates is correlated with levels of disease in wheat. Mol. Plant Microbe Interact. 24, 1419–1426. [DOI] [PubMed] [Google Scholar]
- Friesen, T.L. and Faris, J.D. (2010) Characterization of the wheat–Stagonospora nodorum disease system: what is the molecular basis of this quantitative necrotrophic disease interaction. Can. J. Plant Pathol. 32, 20–28. [Google Scholar]
- Friesen, T.L. , Stukenbrock, E.H. , Liu, Z.H. , Meinhardt, S. , Ling, H. , Faris, J.D. , Rasmussen, J.B. , Solomon, P.S. , McDonald, B.A. and Oliver, R.P. (2006) Emergence of a new disease as a result of interspecific virulence gene transfer. Nat. Genet. 38, 953–956. [DOI] [PubMed] [Google Scholar]
- Friesen, T.L. , Meinhardt, S.W. and Faris, J.D. (2007) The Stagonospora nodorum‐wheat pathosystem involves multiple proteinaceous host‐selective toxins and corresponding host sensitivity genes that interact in an inverse gene‐for‐gene manner. Plant J. 51, 681–692. [DOI] [PubMed] [Google Scholar]
- Friesen, T.L. , Faris, J.D. , Solomon, P.S. and Oliver, R.P. (2008a) Host‐specific toxins: effectors of necrotrophic pathogenicity. Cell. Microbiol. 10, 1421–1428. [DOI] [PubMed] [Google Scholar]
- Friesen, T.L. , Zhang, Z. , Solomon, P.S. , Oliver, R.P. and Faris, J.D. (2008b) Characterization of the interaction of a novel Stagonospora nodorum host‐selective toxin with a wheat susceptibility gene. Plant Physiol. 146, 682–693. [DOI] [PMC free article] [PubMed] [Google Scholar]
- Friesen, T.L. , Chu, C.G. , Liu, Z.H. , Xu, S.S. , Halley, S. and Faris, J.D. (2009) Host‐selective toxins produced by Stagonospora nodorum confer disease susceptibility in adult wheat plants under field conditions. Theor. Appl. Genet. 118, 1489–1497. [DOI] [PubMed] [Google Scholar]
- Friesen, T.L. , Chu, C. , Xu, S.S. and Faris, J.D. (2012) SnTox5–Snn5: A novel Stagonospora nodorum effector‐wheat gene interaction and its relationship with the SnToxA–Tsn1 and SnTox3–Snn3‐B1 interactions. Mol. Plant Pathol. 13, 1101–1109. [DOI] [PMC free article] [PubMed] [Google Scholar]
- Gao, Y. , Faris, J.D. , Liu, Z. , Kim, Y. , Syme, R.A. , Oliver, R.P. , Xu, S.S. and Friesen, T.L. (2015) Identification and characterization of the SnTox6‐Snn6 interaction in the Parastagonospora nodorum–wheat pathosystem. Mol. Plant Microbe Interact. 6, 615–625. [DOI] [PubMed] [Google Scholar]
- Ipcho, S.V. , Hane, J.K. , Antoni, E.A. , Ahren, D. , Henrissat, B. , Friesen, T.L. , Solomon, P.S. and Oliver, R.P. (2012) Transcriptome analysis of Stagonospora nodorum: gene models, effectors, metabolism and pantothenate dispensability. Mol. Plant Pathol. 13, 531–545. [DOI] [PMC free article] [PubMed] [Google Scholar]
- Kump, K.L. , Bradbury, P.J. , Wisser, R.J. et al. (2011) Genome‐wide association study of quantitative resistance to southern leaf blight in the maize nested association mapping population. Nat. Genet. 43, 163–168. [DOI] [PubMed] [Google Scholar]
- Lefebvre, V. and Palloix, A. (1996) Both epistatic and additive effects of QTLs are involved in polygenic induced resistance to disease: a case study, the interaction pepper–Phytophthora capsici Leonian. Theor. Appl. Genet. 93, 503–511. [DOI] [PubMed] [Google Scholar]
- Liu, Z.H. , Faris, J.D. , Meinhardt, S.W. , Ali, S. , Rasmussen, J.B. and Friesen, T.L. (2004) Genetic and physical mapping of a gene conditioning sensitivity in wheat to a partially purified host‐selective toxin produced by Stagonospora nodorum . Phytopathology, 94, 1056–1060. [DOI] [PubMed] [Google Scholar]
- Liu, Z. , Faris, J.D. , Oliver, R.P. et al. (2009) SnTox3 acts in effector triggered susceptibility to induce disease on wheat carrying the Snn3 gene. PLoS Pathog. 5, e1000581. [DOI] [PMC free article] [PubMed] [Google Scholar]
- Liu, Z. , Zhang, Z. , Faris, J.D. et al. (2012) The cysteine rich necrotrophic effector SnTox1 produced by Stagonospora nodorum triggers susceptibility of wheat lines harboring Snn1 . PLoS Pathog., 8, e1002467. [DOI] [PMC free article] [PubMed] [Google Scholar]
- Liu, Y. , Chen, L. , Fu, D. , Lou, Q. , Mei, H. , Xiong, L. , Li, M. , Xu, X. , Mei, X. and Luo, L. (2014) Dissection of additive, epistatic effect and QTL× environment interaction of quantitative trait loci for sheath blight resistance in rice. Hereditas, 151, 28–37. [DOI] [PubMed] [Google Scholar]
- Ma, H. and Hughes, G.R. (1995) Genetic control and chromosomal location of Triticum timopheevii derived resistance to septoria nodorum blotch in durum wheat. Genome, 38, 332–338. [DOI] [PubMed] [Google Scholar]
- Manning, V.A. and Ciuffetti, L.M. (2015) Necrotrophic effector epistasis in the Pyrenophora tritici–repentis–wheat interaction. PLoS ONE, 10, e0123548. [DOI] [PMC free article] [PubMed] [Google Scholar]
- McDonald, M.C. , Oliver, R.P. , Friesen, T.L. , Brunner, P.C. and McDonald, B.A. (2013) Global diversity and distribution of three necrotrophic effectors in Phaeosphaeria nodorum and related species. New Phytol. 199, 241–251. [DOI] [PubMed] [Google Scholar]
- Murray, G.M. and Brennan, J.P. (2009) Estimating disease losses to the Australian wheat industry. Australas. Plant Pathol. 38, 558–570. [Google Scholar]
- Nelson, L.R. and Gates, C.E. (1982) Genetics of host plant resistance of wheat to Septoria nodorum . Crop Sci. 22, 771–773. [Google Scholar]
- Oliver, R.P. , Rybak, K. , Solomon, P.S. and Ferguson‐Hunt, M. (2009) Prevalence of ToxA‐sensitive alleles of the wheat gene Tsn1 in Australian and Chinese wheat cultivars. Crop Pasture Sci. 60, 348–352. [Google Scholar]
- Oliver, R.P. , Friesen, T.L. , Faris, J.D. and Solomon, P.S. (2012) Stagonospora nodorum: from pathology to genomics and host resistance. Annu. Rev. Phytopathol. 50, 23–43. [DOI] [PubMed] [Google Scholar]
- Quaedvlieg, W. , Verkley, G.J. , Shin, H.D. , Barreto, R.W. , Alfenas, A.C. , Swart, W.J. , Groenewald, J.Z. and Crous, P.W. (2013) Sizing up Septoria. Stud. Mycol. 75, 307–390. [DOI] [PMC free article] [PubMed] [Google Scholar]
- Reddy, L. , Friesen, T.L. , Meinhardt, S.W. , Chao, S. and Faris, J.D. (2008) Genomic analysis of the Snn1 locus on wheat chromosome arm 1BS and the identification of candidate genes. Plant Genome, 1, 55–66. [Google Scholar]
- Schnurbusch, T. , Paillard, S. , Fossati, D. , Messmer, M. , Schachermayr, G. , Winzeler, M. and Keller, B. (2003) Detection of QTLs for Stagonospora glume blotch resistance in Swiss winter wheat. Theor. Appl. Genet. 107, 1226–1234. [DOI] [PubMed] [Google Scholar]
- Shankar, M. , Walker, E. , Golzar, H. , Loughman, R. , Wilson, R.E. and Francki, M.G. (2008) Quantitative trait loci for seedling and adult plant resistance to Stagonospora nodorum in wheat. Phytopathology, 98, 886–893. [DOI] [PubMed] [Google Scholar]
- Shi, G. , Friesen, T.L. , Saini, J. , Xu, S.S. , Rasmussen, J.B. and Faris, J.D. (2015) The wheat Snn7 gene confers susceptibility on recognition of the Parastagonospora nodorum necrotrophic effector SnTox7 . Plant Genome, 8, doi:10.3835/plantgenome2015.3802.0007. [DOI] [PubMed] [Google Scholar]
- Solomon, P.S. , Thomas, S.W. , Spanu, P. and Oliver, R.P. (2003) The utilisation of di/tripeptides by Stagonospora nodorum is dispensable for wheat infection. Physiol. Mol. Plant Pathol. 63, 191–199. [Google Scholar]
- Solomon, P.S. , Lowe, R.G.T. , Tan, K.‐C. , Waters, O.D.C. and Oliver, R.P. (2006) Stagonospora nodorum: cause of Stagonospora nodorum blotch of wheat. Mol. Plant Pathol. 7, 147–156. [DOI] [PubMed] [Google Scholar]
- Solomon, P.S. , IpCho, S.V.S. , Hane, J.K. , Tan, K.C. and Oliver, R.P. (2008) A quantitative PCR approach to determine gene copy number. Fungal Genet. Rep. 55, 5–8. [Google Scholar]
- Somers, D.J. , Isaac, P. and Edwards, K. (2004) A high‐density microsatellite consensus map for bread wheat (Triticum aestivum L.). Theor. Appl. Genet. 109, 1105–1114. [DOI] [PubMed] [Google Scholar]
- Sourdille, P. , Singh, S. , Cadalen, T. , Brown‐Guedira, G.L. , Gay, G. , Qi, L. , Gill, B.S. , Dufour, P. , Murigneux, A. and Bernard, M. (2004) Microsatellite‐based deletion bin system for the establishment of genetic‐physical map relationships in wheat (Triticum aestivum L.). Funct. Integr. Genomics, 4, 12–25. [DOI] [PubMed] [Google Scholar]
- Tan, K.C. , Heazlewood, J.L. , Millar, A.H. , Thomson, G. , Oliver, R.P. and Solomon, P.S. (2008) A signaling‐regulated, short‐chain dehydrogenase of Stagonospora nodorum regulates asexual development. Eukaryot. Cell 7, 1916–1929. [DOI] [PMC free article] [PubMed] [Google Scholar]
- Tan, K.C. , Oliver, R.P. , Solomon, P.S. and Moffat, C.S. (2010) Proteinaceous necrotrophic effectors in fungal virulence. Funct. Plant Biol. 37, 907–912. [Google Scholar]
- Tan, K.C. , Ferguson‐Hunt, M. , Rybak, K. et al. (2012) Quantitative variation in effector activity of ToxA isoforms from Stagonospora nodorum and Pyrenophora tritici‐repentis . Mol. Plant Microbe Interact. 25, 515–522. [DOI] [PubMed] [Google Scholar]
- Tan, K.C. , Waters, O.D.C. , Rybak, K. , Antoni, E. , Furuki, E. and Oliver, R.P. (2014) Sensitivity to three Parastagonospora nodorum necrotrophic effectors in current Australian wheat cultivars and the presence of further fungal effectors. Crop Pasture Sci. 65, 150–158. [Google Scholar]
- Tan, K.C. , Phan, H.T.T. , Rybak, K. , John, E. , Chooi, Y.H. , Solomon, P.S. and Oliver, R.P. (2015) Functional redundancy of necrotrophic effectors – consequences for exploitation for breeding. Front. Plant Sci. 6, 501. doi:10.3389/fpls.2015.00501. [DOI] [PMC free article] [PubMed] [Google Scholar]
- Uphaus, J. , Walker, E. , Shankar, M. , Golzar, H. , Loughman, R. , Francki, M. and Ohm, H. (2007) Quantitative trait loci identified for resistance to Stagonospora glume blotch in wheat in the USA and Australia. Crop Sci. 47, 1813–1822. [Google Scholar]
- Vleeshouwers, V.G. and Oliver, R.P. (2014) Effectors as tools in disease resistance breeding against biotrophic, hemibiotrophic, and necrotrophic plant pathogens. Mol. Plant Microbe Interact. 27, 196–206. [DOI] [PubMed] [Google Scholar]
- Wang, G.L. , Mackill, D.J. , Bonman, J.M. , McCouch, S.R. , Champoux, M.C. and Nelson, R.J. (1994) RFLP mapping of genes conferring complete and partial resistance to blast in a durably resistant rice cultivar. Genetics, 136, 1421–1434. [DOI] [PMC free article] [PubMed] [Google Scholar]
- Waters, O.D.C. , Lichtenzveig, J. , Rybak, K. , Friesen, T.L. and Oliver, R.P. (2011) Prevalence and importance of sensitivity to the Stagonospora nodorum necrotrophic effector SnTox3 in current Western Australian wheat cultivars. Crop Pasture Sci. 62, 556–562. [Google Scholar]
- Xu, S.S. , Friesen, T.L. and Cai, X.W. (2004) Sources and genetic control of resistance to Stagonospora nodorum blotch in wheat In Recent Research Developments in Genetics and Breeding (Pandalai S.G. ed). Kerala, India: Research Signpost, pp. 449–469. [Google Scholar]
- Zhang, Z. , Friesen, T.L. , Xu, S.S. , Shi, G. , Liu, Z. , Rasmussen, J.B. and Faris, J.D. (2011) Two putatively homoeologous wheat genes mediate recognition of SnTox3 to confer effector‐triggered susceptibility to Stagonospora nodorum . Plant J. 65, 27–38. [DOI] [PubMed] [Google Scholar]
Associated Data
This section collects any data citations, data availability statements, or supplementary materials included in this article.
Supplementary Materials
Figure S1. SnTox1 and SnTox3 infiltrations on differentially sensitive wheat lines.
Figure S2. Copy number of the SnTox1–phleomycin resistance gene knockout cassette normalised to a single copy of Act1.
Figure S3. Genetic map of the C × W DH population. Linkage groups are indicated.
Figure S4. SnTox3 expression was elevated in two other P. nodorum SnTox1 deletion strains (tox1–7 and tox1–8) compared to SN15.
Table S1. Primers used in this study.