Abstract
T cells from neuromyelitis optica (NMO) patients, which recognize the immunodominant epitope of aquaporin‐4, exhibit Th17 polarization and cross‐react with a homologous sequence of a Clostridium perfringens adenosine triphosphate‐binding cassette transporter. Therefore, this commensal microbe might participate in NMO pathogenesis. We examined the gut microbiome by PhyloChip G3 from 16 NMO patients, 16 healthy controls (HC), and 16 multiple sclerosis patients. A significant difference in the abundance of several microbial communities was observed between NMO and HC (Adonis test, p = 0.001). Strikingly, C. perfringens was overrepresented in NMO (p = 5.24 × 10⁻⁸). These observations support a potential role for C. perfringens in NMO pathogenesis. Ann Neurol 2016;80:443–447
Neuromyelitis optica (NMO) is a central nervous system (CNS) autoimmune disease associated with a T‐cell–dependent humoral response to the water channel, aquaporin‐4 (AQP4).1, 2 Previously, we observed that T cells from NMO patients proliferate more vigorously in response to AQP4 than T cells from healthy controls (HC).3 In NMO, T‐cell recognition of the immunodominant determinant peptide (p) 63–76 was associated with Th17 polarization. We also discovered that AQP4 p63–76 contains a 10‐amino‐acid sequence, 66–75, that shares 90% homology with amino acid sequence 207–216 within an adenosine triphosphate‐binding cassette transporter permease (ABC‐TP) of Clostridium perfringens, a ubiquitous anaerobic gram‐positive bacterium found in human commensal gut flora. T cells from NMO patients proliferated to the C. perfringens ABC‐TP p207–216, and exhibited cross‐reactivity with AQP4. These results suggested a possible link between C. perfringens and NMO pathogenesis.
Dysbiosis in gastrointestinal microbiota influences proinflammatory T‐cell differentiation and can promote organ‐specific autoimmunity.4 Clostridium species in human gut can influence the balance between Th17 and regulatory T cells (Treg).5 These observations, when taken together with our previous studies showing proinflammatory T‐cell polarization and cross‐reactivity between AQP4 and ABC‐TP in NMO, highlighted the need to evaluate the proposed connection between C. perfringens and NMO pathogenesis. To our knowledge, our findings in this report represent the first analysis of the gut microbiota in NMO.
Subjects and Methods
We examined stool samples obtained from 16 NMO patients (all AQP4 seropositive, Mayo Clinic Laboratory) and 16 unaffected controls by DNA hybridization using the PhyloChip G3. The G3 PhyloChip uses > 1.1 million probes to target the entire 16S rRNA and can identify >60,000 taxa. Based upon other microbiome studies using the PhyloChip platform,6, 7, 8, 9 16 individuals/group provided 90% power to detect an ω2 = 0.056,10 an effect size comparable to differences observed with diet.11 Unaffected NMO‐household controls, when available, were used as the reference group to reduce variation related to diet. To further control for diet, subjects were asked to complete a validated food frequency questionnaire.12, 13 Analysis of variance (ANOVA) was used to compare the mean values of dietary factors as well as age, height, weight, and body mass index (BMI) across the 3 groups (HC, NMO, and multiple sclerosis [MS]). Differences were considered significant if the F test yielded a p value of < 0.05. Post hoc tests were used to assess pairwise comparisons for variables that differed among the groups. Most NMO patients were treated with immunotherapy (8 rituximab, 6 mycophenolate mofetil, 1 azathioprine, 1 untreated). Therefore, we included 16 MS subjects (5 treated with rituximab) as additional controls. This study received University of California, San Francisco Institutional Review Board approval.
DNA was extracted using MoBio PowerMag Soil DNA Isolation Kit as per the vendor's protocol. DNA isolates ranged in concentrations of 3 to 80ng/μl. The bacterial 16S rRNA gene was amplified using the degenerate forward primer 27F.1 5′‐AGRGTTTGATCMTGGCTCAG‐3′ and the non‐degenerate reverse primer 1492R.jgi 5′‐GGTTACCTTGTTACGACTT‐3′. Thirty‐five cycles of bacterial 16S rRNA gene polymerase chain reaction (PCR) amplification were performed. Amplicons were concentrated using a solid‐phase reversible immobilization method for the purification of PCR products and quantified by electrophoresis using an Agilent Technologies (Santa Clara, CA) 2100 Bioanalyzer. PhyloChip Control Mix was added to each amplified product. Bacterial 16S rRNA gene amplicons were fragmented, biotin labeled, and hybridized to the PhyloChip Array, version G3. Arrays were then washed, stained, and scanned using a GeneArray scanner (Affymetrix, Santa Clara, CA). Each scan was captured using standard Affymetrix software (GeneChip Microarray Analysis Suite).
The Adonis test (a randomization/Monte Carlo permutation test) was utilized to test for significant relationships between variation in bacterial community composition and discrete categorical or continuous variables measured in this study. ANOVA was used to test for significant taxonomic differences across HC, NMO, and MS.
Results
The clinical features of the patient and control groups are presented in Supplementary Table 1. Study subjects completed a dietary questionnaire (Block Dietary Data Systems, nutritionquest.com) that provided information regarding 73 nutrients as well as age, height, weight, and BMI (Supplementary Table 2). Nutritional intake between the 3 groups was remarkably similar. Only 4 dietary variables differed between the groups: alpha‐carotene, beta‐carotene, lutein‐zeaxanthin, and phylloquinone (vitamin K1). NMO did not differ from HC on any nutritional or physical variable. For alpha‐carotene, beta‐carotene, and lutein‐zeaxanthin, MS differed from both HC and NMO. Phylloquine (vitamin K1) in MS differed from NMO; however, MS did not differ from HC.
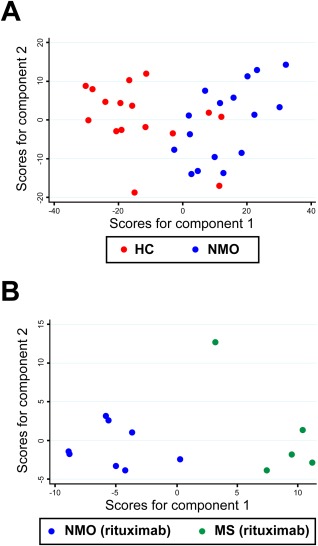
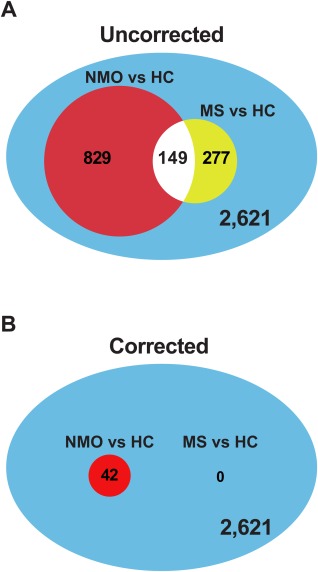
PhyloChip detected 2,621 operational taxonomic units (OTUs) in at least 1 sample. NMO and HC sample classes significantly explained variation in bacterial community composition based on a Weighted UniFrac matrix (Adonis test, p = 0.001).14 Principal component analysis was used to illustrate this finding; Figure 1A illustrates spatial separation of NMO and HC microbiomes indicating compositional differences between these bacterial communities. A total of 829 OTUs differed in relative abundance (uncorrected p < 0.05; Fig 2A). Forty‐two retained statistical significance following Bonferroni correction for multiple comparisons (the cutoff for statistical significance following multiple comparison correction is p < 1.91 × 10−5 = 0.05/2,621; Supplementary Table 3, Fig 2B).
Figure 1.

Principal component analysis (PCA) of gut microbiota in neuromyelitis optica (NMO), multiple sclerosis (MS), and healthy controls (HC). (A) PCA of the microbiome in HC and NMO. NMO and HC samples cluster separately with moderate overlap along axis 1 (which explains 39.4% of the variation; axis 2 explains an additional 9.89% of the variation) based on Weighted UniFrac dissimilarity values from 829 differentiated taxa. (B) A separation of microbiome between samples from MS‐rituximab versus NMO‐rituximab was observed along axis 1, which explains 39.2% of the variance, and axis 2, which explains an additional 14.4% of the variance.
Figure 2.

Differential operational taxonomic unit (OTU) abundance in neuromyelitis optica (NMO) or multiple sclerosis (MS) compared to healthy controls (HC). A total of 2,621 OTUs were detected in at least 1 sample. (A) Of these, 829 OTUs were differentially abundant between NMO and HC, whereas 277 OTUs were differentially abundant between MS and HC (uncorrected, p < 0.05). (B) After correction for multiple comparisons (the threshold for significance is p = 1.91 × 10⁻⁵), 42 OTUs remained differentially abundant for the NMO versus HC comparison, whereas no taxa remained associated with MS.
Fifteen of 16 NMO patients were treated with immune suppressant medications that hypothetically could alter the gut microflora (rituximab [n = 8], mycophenolate mofetil [n = 6], azathioprine [n = 1]).15 Therefore, we examined stool samples from 16 MS patients, 5 of whom were treated with rituximab, as an additional control. A total of 277 OTUs exhibited differential abundance between MS and HC (p < 0.05, unadjusted for multiple comparisons). Figure 2 illustrates the impact of correcting for multiple comparisons. Without correction, many species appear to have differential abundance in both MS and NMO. Following Bonferroni correction, no species were associated with MS compared to HC. Differences in the gut microbiota between rituximab‐treated MS and NMO patients were also identified, implying that these differences could not be attributed entirely to rituximab treatment (see Fig 1B).
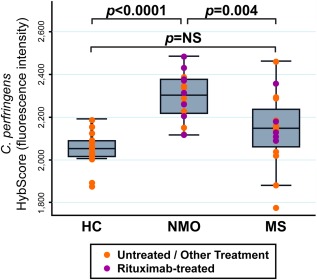
Remarkably, C. perfringens was the second most statistically significantly enriched taxon in NMO patients compared with HC (p = 5.24 × 10⁻⁸; see Supplementary Table 3). C. perfringens also was overrepresented in MS samples, albeit with marginal statistical significance, and did not survive statistical correction for multiple comparisons. In a 3‐way comparison, C. perfringens was overabundant comparing NMO to HC (p < 0.0001) and NMO to MS (p = 0.004) but was not different comparing MS to HC (p = not significant; Fig 3). C. perfringens remained significantly associated with NMO for the comparison of the subgroup of 8 NMO rituximab‐treated and 5 MS rituximab‐treated subjects (p = 0.049). Within MS samples, rituximab treatment did not influence C. perfringens abundance (p = 0.507). Similarly, rituximab treatment did not influence C. perfringens abundance among NMO subjects (p = 0.464).
Figure 3.

Clostridium perfringens abundance in neuromyelitis optica (NMO), multiple sclerosis (MS), and healthy controls (HC). The y‐axis represents the HybScore (integers of fluorescence intensity). Purple dots represent individual values for patients receiving rituximab; orange dots represent patients receiving treatment other than rituximab, or no treatment. The p value for this analysis of variance F test was p < 0.0001. Post hoc tests (Bonferroni) were used to assess pairwise comparisons. C. perfringens abundance was significantly increased in NMO versus HC (p < 0.0001) and in NMO versus MS (p = 0.004). C. perfringens was numerically, but not statistically, increased in abundance in MS samples versus HC. NS = not significant.
Discussion
Our previous investigation discovered striking homology between the immunodominant T‐cell epitope of AQP4 in NMO and a sequence of an ABC‐TP of C. perfringens. AQP4‐specific T cells exhibited Th17 polarization and cross‐reacted with the corresponding ABC‐TP peptide. Both commensal Clostridium species in humans and the phylogenetically related segmented filamentous bacteria (SFB) in mice can influence the balance between Th17 and Treg,4, 5, 16 T‐cell subsets that are reciprocally regulated.17 Specifically, colonization of the terminal ileum of germ‐free mice with a single commensal microbe, SFB, promoted Th17 differentiation and resulted in the induction of experimental autoimmune encephalomyelitis.18 Further, colonization of germ‐free mice with one fraction of human fecal material containing multiple Clostridium strains promoted development of Foxp3+ Treg, whereas colonization with another fraction expanded Th17 cells.5 Thus, we hypothesized that C. perfringens might have a dual role in NMO pathogenesis, serving both as a molecular mimic and its own proinflammatory polarizing adjuvant. In this first study of the microbiome in NMO, we found that several OTUs are differentially represented in NMO compared to HC. Notably, C. perfringens is significantly enriched in relative abundance in the gut microbiota of NMO. This observation provides evidence supporting the potential role of C. perfringens in NMO pathogenesis.
There are several implications from our findings. First, our data provide a potential link between the gut microbiota and NMO, an acquired antigen‐specific neurological disease. Second, overrepresentation of C. perfringens in the gut could be one factor contributing to immune dysregulation and NMO susceptibility. Third, it is possible that C. perfringens might participate in more than one CNS autoimmune disease. In this regard, one year after we identified the potential link between C. perfringens and NMO,3 C. perfringens was implicated in MS pathogenesis.19 Another study found that Clostridium species within clusters XIVa and IV, which do not contain C. perfringens (a member of cluster I), are reduced in relapsing–remitting MS patients.20 In our data set, C. perfringens was also increased in MS samples; however, its association with MS, unlike NMO, did not withstand statistical correction. Although we have drawn attention largely to C. perfringens, other bacterial community members (e.g., Fibrobacteres) appear to be overrepresented in NMO gut microbiota (see Supplementary Table 3). Thus, it is possible that other bacterial species may also influence immune function in these patients.
This initial study is limited by a small sample size, and it was designed primarily to investigate feasibility rather than to provide a definitive answer regarding potential differences in the gut microbiome of NMO patients. Because of the potential impact of immunosuppressive medications on the gut microbiota, future studies will focus on stool samples obtained from untreated NMO patients. Due to the relatively rapid diagnosis based on anti‐AQP4 serology, most NMO patients are started on an immunosuppressive medication shortly following diagnosis, creating logistic challenges for acquisition of treatment‐naive samples. In this data set, we cannot prove that the differences observed in the microbiome between NMO and HC are not influenced by treatment. Nonetheless, restricting the comparison of rituximab‐treated NMO to rituximab‐treated MS patients showed that C. perfringens abundance was significantly elevated in NMO. Therefore, immunosuppressive treatments alone cannot account for the differences between NMO and HC because the microbiota of MS and NMO patients treated in a similar manner were distinct. Furthermore, the case–control study design can identify associations but does not permit determination of causality. Additional evidence of a direct role might be gained from animal experimentation by evaluating immune reactivity to AQP4 following colonization of germ‐free mice with fecal material from NMO patients. Despite these limitations, our observation of a highly significant overrepresentation of C. perfringens within the gut microbiota of NMO subjects warrants further investigation of the potential role of this organism in immune dysregulation in NMO.
Author Contributions
B.A.C.C., C.M.S., M.V‐D., and S.S.Z contributed to study concept and design. B.A.C.C., C.M.S., S.E.B., and S.S.Z. contributed to data acquisition and analysis. B.A.C.C., C.M.S., and S.S.Z. contributed to drafting the manuscript or figures.
Potential Conflicts of Interest
S.S.Z. has received personal compensation for consulting from Roche (rituximab is a product of Genentech, a Roche company).
Supporting information
Additional supporting information can be found in the online version of this article.
Supporting Information
Acknowledgment
This work was supported by grants to S.S.Z. from the Guthy‐Jackson Charitable Foundation and the National Multiple Sclerosis Society (RG 4768). S.E.B. received support from the Valhalla Foundation and S.S.Z. was also supported by the Alexander M. and June L. Maisin Foundation of the Jewish Community Federation and Endowment Fund.
We thank Drs S. V. Lynch, G. R. Cutter, and M. R. Yeaman for helpful discussion and review of the manuscript; and the patients and their families for their contributions to this project.
References
- 1. Lennon VA, Kryzer TJ, Pittock SJ, et al. IgG marker of optic‐spinal multiple sclerosis binds to the aquaporin‐4 water channel. J Exp Med 2005;202:473–477. [DOI] [PMC free article] [PubMed] [Google Scholar]
- 2. Zamvil SS, Slavin AJ. Does MOG Ig‐positive AQP4‐seronegative opticospinal inflammatory disease justify a diagnosis of NMO spectrum disorder? Neurol Neuroimmunol Neuroinflamm 2015;2:e62. [DOI] [PMC free article] [PubMed] [Google Scholar]
- 3. Varrin‐Doyer M, Spencer CM, Schulze‐Topphoff U, et al. Aquaporin 4‐specific T cells in neuromyelitis optica exhibit a Th17 bias and recognize Clostridium ABC transporter. Ann Neurol 2012;72:53–64. [DOI] [PMC free article] [PubMed] [Google Scholar]
- 4. Ivanov II, Atarashi K, Manel N, et al. Induction of intestinal Th17 cells by segmented filamentous bacteria. Cell 2009;139:485–498. [DOI] [PMC free article] [PubMed] [Google Scholar]
- 5. Atarashi K, Tanoue T, Oshima K, et al. Treg induction by a rationally selected mixture of Clostridia strains from the human microbiota. Nature 2013;500:232–236. [DOI] [PubMed] [Google Scholar]
- 6. Mazmanian SK, Round JL, Kasper DL. A microbial symbiosis factor prevents intestinal inflammatory disease. Nature 2008;453:620–625. [DOI] [PubMed] [Google Scholar]
- 7. Cox MJ, Huang YJ, Fujimura KE, et al. Lactobacillus casei abundance is associated with profound shifts in the infant gut microbiome. PLoS One 2010;5:e8745. [DOI] [PMC free article] [PubMed] [Google Scholar]
- 8. Saulnier DM, Riehle K, Mistretta TA, et al. Gastrointestinal microbiome signatures of pediatric patients with irritable bowel syndrome. Gastroenterology 2011;141:1782–1791. [DOI] [PMC free article] [PubMed] [Google Scholar]
- 9. Lemon KP, Klepac‐Ceraj V, Schiffer HK, et al. Comparative analyses of the bacterial microbiota of the human nostril and oropharynx. MBio 2010;1:e00129‐10. [DOI] [PMC free article] [PubMed] [Google Scholar]
- 10. Kelly BJ, Gross R, Bittinger K, et al. Power and sample‐size estimation for microbiome studies using pairwise distances and PERMANOVA. Bioinformatics 2015;31:2461–2468. [DOI] [PMC free article] [PubMed] [Google Scholar]
- 11. Wu GD, Chen J, Hoffmann C, et al. Linking long‐term dietary patterns with gut microbial enterotypes. Science 2011;334:105–108. [DOI] [PMC free article] [PubMed] [Google Scholar]
- 12. Block G, Hartman AM, Dresser CM, et al. A data‐based approach to diet questionnaire design and testing. Am J Epidemiol 1986;124:453–469. [DOI] [PubMed] [Google Scholar]
- 13. Block G, Woods M, Potosky A, et al. Validation of a self‐administered diet history questionnaire using multiple diet records. J Clin Epidemiol 1990;43:1327–1335. [DOI] [PubMed] [Google Scholar]
- 14. Lozupone C, Hamady M, Knight R. UniFrac—an online tool for comparing microbial community diversity in a phylogenetic context. BMC Bioinformatics 2006;7:371. [DOI] [PMC free article] [PubMed] [Google Scholar]
- 15. Diaz PI, Hong BY, Frias‐Lopez J, et al. Transplantation‐associated long‐term immunosuppression promotes oral colonization by potentially opportunistic pathogens without impacting other members of the salivary bacteriome. Clin Vaccine Immunol 2013;20:920–930. [DOI] [PMC free article] [PubMed] [Google Scholar]
- 16. Atarashi K, Tanoue T, Shima T, et al. Induction of colonic regulatory T cells by indigenous Clostridium species. Science 2011;331:337–341. [DOI] [PMC free article] [PubMed] [Google Scholar]
- 17. Bettelli E, Carrier Y, Gao W, et al. Reciprocal developmental pathways for the generation of pathogenic effector TH17 and regulatory T cells. Nature 2006;441:235–238. [DOI] [PubMed] [Google Scholar]
- 18. Lee YK, Menezes JS, Umesaki Y, Mazmanian SK. Proinflammatory T‐cell responses to gut microbiota promote experimental autoimmune encephalomyelitis. Proc Natl Acad Sci U S A 2011;108(suppl 1):4615–4622. [DOI] [PMC free article] [PubMed] [Google Scholar]
- 19. Rumah KR, Linden J, Fischetti VA, et al. Isolation of Clostridium perfringens type B in an individual at first clinical presentation of multiple sclerosis provides clues for environmental triggers of the disease. PLoS One 2013;8:e76359. [DOI] [PMC free article] [PubMed] [Google Scholar]
- 20. Miyake S, Kim S, Suda W, et al. Dysbiosis in the gut microbiota of patients with multiple sclerosis, with a striking depletion of species belonging to Clostridia XIVa and IV clusters. PLoS One 2015;10:e0137429. [DOI] [PMC free article] [PubMed] [Google Scholar]
Associated Data
This section collects any data citations, data availability statements, or supplementary materials included in this article.
Supplementary Materials
Additional supporting information can be found in the online version of this article.
Supporting Information


