

Abstract
The suprachiasmatic nuclei (SCN) contain the major circadian clock responsible for generation of circadian rhythms in mammals. The time measured by the molecular circadian clock must eventually be translated into a neuronal firing rate pattern to transmit a meaningful signal to other tissues and organs in the animal. Previous observations suggest that circadian modulation of ryanodine receptors (RyR) is a key element of the output pathway from the molecular circadian clock. To directly test this hypothesis, we studied the effects of RyR activation and inhibition on real time expression of PERIOD2::LUCIFERASE, intracellular calcium levels and spontaneous firing frequency in mouse SCN neurons. Furthermore, we determined whether the RyR‐2 mRNA is expressed with a daily variation in SCN neurons. We provide evidence that pharmacological manipulation of RyR in mice SCN neurons alters the free [Ca2+]i in the cytoplasm and the spontaneous firing without affecting the molecular clock mechanism. Our data also show a daily variation in RyR‐2 mRNA from single mouse SCN neurons with highest levels during the day. Together, these results confirm the hypothesis that RyR‐2 is a key element of the circadian clock output from SCN neurons.
Keywords: biological clock, C57/Bl6 mice, calcium release, cell signaling, PERIOD 2
Introduction
The suprachiasmatic nuclei (SCN) in the hypothalamus contain a primary circadian clock responsible for driving circadian rhythms in mammals (Klein et al., 1991). Transcriptional‐translational feedback loops (TTFL) generate a molecular circadian rhythm (Reppert & Weaver, 2002; Albrecht, 2012) controlling physiological (Moore & Lenn, 1972) and behavioral rhythmicity (Stephan & Zucker, 1972). Neuronal firing rate in the SCN encodes information used by the clock to control different effector systems (Schwartz et al., 1987). Therefore, the molecular circadian oscillation must eventually be translated into a neuronal firing pattern to transmit a meaningful signal to other tissues and organs in the animal. The circadian SCN firing frequency varies from about 10 Hz during the subjective day to about 1 Hz during the subjective night.
The circadian rhythm in free cytoplasmic calcium (Ca2+) mobilized from intracellular Ca2+ stores has been suggested to be a link between the molecular oscillator and the modulation of the firing rate (Aguilar‐Roblero et al., 2007; Mercado et al., 2009). One important intracellular Ca2+ store is located in the endoplasmic or sarcoplasmic reticulum (ER/SR) and is controlled by ryanodine receptors (RyRs) and inositol trisphosphate receptors (IP3Rs) (Berridge, 1998). We have previously demonstrated that expression and activity of RyR‐2 is under circadian control in SCN neurons (Diaz‐Munoz et al., 1999). It has also been shown that the intracellular calcium concentration [Ca2+]i has a circadian rhythm as measured with the fluorescent Ca2+ indicator dye Fura‐2 (Colwell, 2000) or by a synthetic chameleon reporter (Ikeda et al., 2003). In the latter study, closing the RyR/Ca2+‐release channel with high doses of ryanodine (10 μm) suppressed the rhythm in [Ca2+]i and partially reduced the amplitude of the rhythm in spiking frequency.
The role of RyR in modulating the spontaneous firing rate of SCN neurons has been reported in acute hypothalamic rat slices (Aguilar‐Roblero et al., 2007). Inhibition of RyRs by 80 μm ryanodine decreases firing frequency, whereas activation of RyRs by 100 nm ryanodine increases firing frequency. These effects of ryanodine were not dependent on synaptic transmission, as blockade of AMPA, NMDA and GABAA receptors did not prevent the inhibitory or activating actions of ryanodine. This suggests that RyR activity is an output element of the cellular circadian clock in the SCN. This hypothesis was further supported by work of Mercado et al. (2009), in which activating or inhibiting RyRs only transiently affected the circadian rhythm of drinking and locomotor behaviors in dim red light.
To directly test if RyRs are part of the output pathway from the molecular machinery, we studied the effects of RyR activation and inhibition on real time expression of PERIOD2::LUCIFERASE (PER2::LUC) in SCN tissues from knock‐in mice. We also monitored the effect of RyR manipulation on intracellular calcium levels and spontaneous firing rate (SFR) during day and night in mouse SCN neurons. Finally, we determined whether the RyR‐2 mRNA expression shows daily variation in SCN neurons. If the RyRs are mainly part of the output pathway from the circadian oscillator, RyR manipulation should not affect the rhythm of PER2::LUC expression regardless of intracellular Ca2+ mobilization and changes in the SFR.
Material and methods
Animal housing
The animals were housed at Leiden University Medical Center (The Netherlands); Karolinska Institutet (Sweden) and Universidad Nacional Autónoma de México (México) under similar conditions. Experiments were carried out after approval from the Animal Experiment Committees (Committee on Animal Health and Care of the Dutch Government in Leiden, Norra Djurförsöksetiska Nämnden in Stockholm, Instituto de Fisiología Celular in México). In all cases the animal handling complies with the guidelines for the use of animals from the Society for Neuroscience (National Research Council, 2011). Male PER2::LUC knock‐in mice 2–3 months old (Yoo et al., 2004) or male wt C57Bl/6 mice (Harlan, Laboratories) 21–60 days old were housed in groups of four provided with water and food ad‐libitum in a sound attenuated room with regulated temperature (22 ± 1 °C). They were entrained either to a 12:12 h light‐dark regular cycle (lights on at 6:00 or 10:00 h) for at least 1 week prior to the experiments, or to a reversed light‐dark cycle (lights on at 22:00 h) for at least 3 weeks. Preparations were performed during the day under room light (~ 200 lux) or in the dark phase of the reversed LD‐cycles under dim red light (~ 5 lux) not visible to rodents. Zeitgeber time (ZT) is used to describe the projected time with ZT 0 defined as the time when the lights are turned on.
Long‐term recordings of PER2::LUC expression in organotypic SCN culture
PER2::LUC mice were anesthetized with Isoflurane (Sigma, USA) and decapitated. The brains were dissected and 250‐μm‐thick coronal hypothalamic slices were cut using a vibroslicer (Cambridge Instruments, UK). For this preparation, the following solution was used: HEPES buffered (10 mm) Hank's balanced salt solution (HBSS) supplemented with antibiotics (25 U/mL penicillin, 25 mg/mL streptomycin), pH 7.2–7.3 and osmolality of about 300 mOsm. For organotypic culture, the bilateral SCN was isolated from the slice, separated into two unilateral SCNs and placed on culture membranes (PICMORG50, Millicell‐CM, Millipore Bedford, USA) in 35 mm Petri dishes, allowing the use of one unilateral SCN as a control for the other. Explants were cultured in 1.2 mL of DMEM culture medium (pH 7.2; serum‐free, low‐sodium bicarbonate, no phenol red); supplemented with 10 mm HEPES, B27 (2%), antibiotics (25 U/mL penicillin, 25 mg/mL streptomycin) and 0.1 mm luciferin (beetle luciferin, Promega, Madison, USA). The dishes were sealed with cover glass and vacuum grease and transferred to a light‐tight incubator at 36.5 °C. Bioluminescence was measured with photomultiplier tubes detectors assembled in a 32 channel LumiCycle (Actimetrics, Wilmette, IL, USA). Photon counts were integrated over 10 min intervals. For the analysis of the bioluminescence traces we used excel (Microsoft Office 2003).
Acrophase and trough
The peak (acrophase) and trough for each cycle were determined as the maximum and the minimum values of the number of detected photons in the bioluminescence rhythm. This was established by an iterative procedure by which each value was compared with the 10 surrounding values (5 before and 5 after): when a value was higher than the surrounding values, it was considered the “peak”, and the corresponding time and luminescence value were obtained. Likewise, when the value was lower than the surrounding values, it was considered as the “trough” and the corresponding time and luminescence value were obtained. In the rare occasions when more than one possible peak or trough were found, the comparison was then made with an increasing number of surrounding values in steps of 2 (1 before and 1 after) until only one peak or trough was obtained. If no peak or trough was found, the comparison was made with a decreasing number of surrounding values in steps of 2 (1 before and 1 after) until the peak or trough was identified.
Period
The period of one complete cycle was defined as the time between two consecutive peaks. Minimum three consecutive peaks were used for averaging periods before drug treatment and minimum four peaks after drug treatment. Samples with oscillations that damped too fast and did not allow quantification of three consecutive peaks were excluded from the analysis.
Amplitude
First, the average of five half‐cycles immediately prior to and after the treatment with drug or vehicle was calculated. The amplitude of one half‐cycle is here defined as the difference in luminescence values between peak and subsequent trough or trough and subsequent peak. The differences between the average amplitudes before and after treatment were then analyzed and plotted as percentage amplitude change.
Phase
Phase was defined as the time of the maximum luminescence between 24 and 48 h after start of the PER2::LUC recording (peak time between day 1 and 2). The effect of drugs on phase was assessed by calculating the difference between peak time before the treatment and peak time after the treatment and testing it statistically against the vehicle treated control group.
Drug application
For chronic pharmacological experiments, drugs or vehicle were applied to the cell culture medium after three cycles of baseline recording of PER2::LUC expression and remained present for 3–4 cycles of bioluminescence recording. Each explant received 100 nm ryanodine (opening of RyR), 80 μm ryanodine (closure of RyR) or vehicle.
In another set of experiments we established the acute effect of the drugs. After baseline recording of PER2::LUC expression for at least three cycles, the test compounds or vehicle was applied during 2 h, either at the peak or the trough of the third or fourth cycle in culture, by changing the culture medium to a medium containing the test compound or vehicle. The explants were then returned to drug‐free culture media and the luminescence signals were recorded for at least three additional cycles. As for the chronic applications, each explant received only one of the treatments.
For chronic experiments the period, amplitude and acrophases before and after ryanodine were compared by Student's t‐test for repeated measures. For acute treatments, the periods, amplitudes and acrophases were compared between groups treated with vehicle or ryanodine with Student's t‐test for independent samples (spss v. 15 for Windows).
Measurement of intracellular calcium
To measure intracellular calcium, brains were rapidly dissected and placed in cold oxygenated modified artificial cerebrospinal fluid (ASCF; with low Ca2+ and high Mg2+) containing (in mm): 116.4 NaCl, 5.4 KCl, 1 NaH2PO4, 0.8 MgSO4, 1 CaCl2, 4 MgCl2, 23.8 NaHCO3 and 15.1 glucose; pH 7.2–7.4; 290–310 mOsm; 5 mg/L gentamycin added. Coronal slices (250 μm) containing the SCN were cut using a vibratome (VT 1000S Leica Microsystems, Wetzlar, Germany) and transferred to a holding chamber with regular ACSF containing 0.8 mm MgSO4 1.8 mm CaCl2 and no MgCl2. After incubation for 30 min at 37 °C, brain slices were kept in oxygenized ACSF. The Ca2+ imaging experiments were performed in the presence of regular ACSF at room temperature throughout the experiment.
Slices were transferred to a recording chamber mounted on an upright fixed‐stage microscope (Zeiss Axioskop 2FS) equipped with water immersion lenses (20× and 40×) and differential interference contrast optics. The slices were held down in the chamber by a nylon grid and perfused at 2–4 mL/min with oxygenated ACSF using a gravity‐fed system. Solutions could be switched at a manifold close to the chamber allowing quick exchange of bath volume (1–2 min for complete exchange). For calcium imaging experiments a cooled CCD camera (Imago QE, TILL Photonics, Graefelfing, Germany) was added to the fixed‐stage microscope to measure fluorescence. A monochromator (Poly V, Till Photonics, Graefelfing, Germany) was used to control excitation light, which was coupled into the microscope by means of a light guide.
Cells were loaded with the calcium‐sensitive dye Fura‐2 (50 μm, Teflabs, Austin, TX, USA) by incubation with the cell‐permeable acetoxymethyl form for 10 min at 35 °C. Dye loaded slices were washed twice with ACSF and transferred into the recording chamber. Recordings of Fura‐2 fluorescence were performed at room temperature (20–25 °C) using tillvisiion software (TILL Photonics, Munich, Germany) and the imaging system described above. Image pairs were acquired every 2 s at an emission of 505 nm after exposure (50 ms) to excitation light of 340 and 380 nm. Ca2+ signals were calibrated in vitro using standardized Ca2+‐buffer solutions (Fura‐2 Calibration Kit, Molecular Probes, Leiden, The Netherlands). Concentration of free cytosolic Ca2+ ([Ca2+]i) was calculated from the ratio of fluorescence at 340 and 380 nm (Grynkiewicz et al., 1985). Ca2+ dissociation constant (Kd) was assumed to be 224 nm. The analysis was performed using tillvisiion software, IGOR (Wavemetrics, Portland, OR, USA) and excel. Cells were sampled throughout the entire SCN and classified as ventral or dorsal and medial or lateral by SCN quadrants based on proximity to the optic chiasm, the preoptic area, the third ventricle or the anterior hypothalamic area. Regions of interest were defined manually assuring that measurements were taken solely from cell bodies of neurons within the clearly visible SCN on the basis of shape and intensity of fluorescence to distinguish them from glia. Background fluorescence was subtracted for each measurement. Cells with high basal [Ca2+]i of above 300 nm were considered unhealthy and therefore excluded from analysis.
Drugs were applied to either 100 nm ryanodine (activating RyR) or 10 μm dantrolene (inhibiting RyR) and the effect on [Ca2+]i was recorded after 10 min. Baseline [Ca2+]i levels were determined before drug application. All drugs were purchased from Sigma, USA.
For the evaluation of response type, mean [Ca2+]i before and after treatment was calculated for each neuron. Deviations of at least 2 SD above or below the mean baseline level were considered increases or decreases, respectively. Neurons showing smaller changes in [Ca2+]i were classified as non‐responders. Further comparison of mean values for each type of response before and after the treatment with each dose and time of administration were made with one‐way anova followed by Student's t‐test for repeated measures (spss v. 15).
Spontaneous action potential activity
To measure spontaneous firing rate from SCN neurons, the brains were dissected and placed in cold oxygenated modified ASCF and 250‐μm‐thick coronal hypothalamic slices were obtained as described in the previous section for Ca2+ imaging and transferred to a holding chamber with regular ACSF. After incubation for 30 min at room temperature slices containing the SCN were transferred to a recording chamber and continuously perfused with oxygenated ACSF to which a cocktail was added, aimed to block synaptic transmission, containing the following: to block NMDA glutamate receptors 50 μm of Dl‐2‐amino‐5‐phosphonopentanoic acid (AP‐V, Sigma, USA); to block AMPA glutamate receptors 10 μm 6,7‐dinitroquinoxaline‐2,3(1H,4H)‐dione (DNQX, Sigma, USA) and to block GABAA receptors 10 μm bicuculline (Sigma, USA).
Recordings were made at room temperature (20–25 °C) at ZT 6–8 (midday) or ZT 18–20 (midnight) using the cell‐attached technique. Slices were illuminated with an infrared (IR) light and detected with an IR‐sensitive video camera (DAGE MTI video camera). Images were displayed on a video monitor (DAGE), which allowed contrast enhancement. The SCN was clearly visible in all slices used for recordings and could easily be distinguished from surrounding hypothalamic regions. The electrodes for cell‐attached recordings were filled with a solution containing (in mm): 115 KH2PO4, 2 MgCl2, 10 HEPES, 0.5 EGTA, 2 Na2ATP, 0.2 Na3GTP, pH 7.2, 275 mOsmol/L. Once a good seal (above 2 GΩ) was obtained between the electrode and the neuron, extracellular action potentials were clearly visible. Recordings were made in current clamp configuration with an Axoclamp 200A amplifier (Axon Instruments, Foster City, CA, USA). Online data collection was performed using a PC compatible with a digital acquisition board (DAQ, National Instruments) using a custom‐made program under labview (National Instruments).
After recording of basal activity, each neuron received only one of the following treatments: (1) Ryanodine 100 nm (to activate the ryanodine‐sensitive Ca2+ channels) or (2) or dantrolene 10 μm (to inhibit these channels). All drugs were purchased from Sigma, USA. The recordings continued 15–20 min after the drug administration. Digitized data were stored on disk as ASCII or binary files and were imported for graphing (Microcal Origin) and analysis (Synaptosoft, MiniAnalysis). To determine the neuronal firing frequency, inter‐spike histograms were first created from 2‐min‐long recording sections. As they were all skewed we used the inverse value of the median to obtain the most accurate estimation of the firing rate.
Further analysis, descriptive statistics and mean comparisons (Student's t‐test for repeated measures, spss v. 15) were done before and after 10 min of treatment for each drug and time of administration.
Measurement of RyR‐2 mRNA by qPCR
As the effect of ryanodine or dantrolene on [Ca2+]i suggested that individual neurons may have different levels of RyR expression, we decided to test this hypothesis by quantifying RyR‐2 mRNA from single SCN neurons by qPCR. The brains were dissected at either midday (ZT 6–8) or midnight (ZT 18–23) and placed in cold oxygenated modified ASCF. Coronal slices (250 μm) containing the SCN were cut using a vibratome (1000 plus, Pelco, USA) and transferred to a holding chamber with regular ACSF. After incubation for 30 min at room temperature slices containing the SCN were transferred to a recording chamber and continuously perfused with oxygenated ACSF. To identify neurons, cells were approached with a low resistance pipette (4–5 mΩ) and recorded using the cell‐attached technique (see above for details). Cells with spontaneous action potentials were considered to be neurons and were aspirated into the electrode by gentle suction. The tip of the electrode containing the cell was subsequently placed at the bottom of a sterile 200 PCR tube (Eppendorf) and frozen to −20 °C until further processing. Up to two neurons were obtained from each slice, a total of 24 SCN slices from different subjects were used.
To each cell, 10 μL of cold water treated with Diethyl Pyrocarbonate was added to disrupt the membranes. To eliminate residual DNA, the sample was exposed to DNAase1 (10 U/μg (InVitrogen) at 25 °C during 15 min. The reaction was stopped by adding 1 μL EDTA (2 mm) and incubating at 65 °C for additional 15 min. Reverse transcription of first‐strand cDNA synthesis was carried out using GeneAmp RNA PCR Kit (Applied Biosystems) at 65 °C during 5 min and stopped at 4 °C, according to the manufacturer's recommendations for random hexamers primed cDNA synthesis. A mixture of 4 μL 5× buffer, 1 μL DTT (0.1 m), 1 μL RNAse and 1 μm RT superscript III was added and the sample was preincubated for 5 min at 25 °C. The reaction was initiated by incubation at 50 °C for 60 min and then stopped at 70 °C for 15 min. RyR‐2 primers were designed with the assistance of primer express 2.0 software (forward –5′ggcatcgggctgtcaatc3; reverse – 5′ccggtttcgctaaatcttcg3′) and synthesized by Sigma‐Genosys. Real‐time PCR was performed and analyzed by ABI PRISM 7000 (Applied Biosystems). Reactions were conducted in a 96‐well plate in 20 μL added with 1.5 μm primers, Deoxyribonucleoside triphosphates, Taq‐DNA polymerase and reaction buffer provided by PCR SuperMix UDG (Invitrogen). The HotStarTaq polymerase was activated at 95 °C for 10 min, followed by 40 cycles of 95 °C for 30 s and 60 °C for 60 s. All samples were amplified in duplicates and the mean was obtained for further calculations. The threshold cycle (Ct) for each sample was calculated based on the cycle number at which the peak of the second derivative of the fluorescence vs. cycle number occurred. The amount of RyR‐2 mRNA was calculated by running a standard curve for serial dilutions of sDNA from total cerebral cortex. The relative abundances of RyR‐2 mRNA were calculated by interpolating the number of cycles at the selected threshold into the linear regression of the calibration curve (Kubista et al., 2006).
Descriptive statistics and mean comparisons between day and night RyR‐2 mRNA expression were made with the Mann–Whitney U test (spss v. 15).
Results
Ryanodine does not affect the PER2::LUC rhythm
To determine if RyRs impact the molecular clock or not, we used 34 transgenic mice containing a PERIOD2::LUCIFERASE fusion protein (Yoo et al., 2004) for monitoring PER2 expression as bioluminescence in real time. We studied the effects of acute as well as long‐term exposure of activating and inhibiting concentrations of ryanodine on 56 unilateral SCN slices (28 treated with vehicle and 28 with ryanodine). In comparison to vehicle administration, acute administration (2 h) of ryanodine at peak or trough of the PER2::LUC cycle had no effect on the period, phase or amplitude of the PER2::LUC rhythm (Figs 1 and 2, Tables 1 and 2), except for one slice treated with 100 nm of ryanodine at trough that showed a phase advance of about 6 h. Similarly, long‐term exposure with ryanodine had no effect on the period, phase or amplitude (Fig. 2) of the PER2::LUC rhythm (Table 3).
Figure 1.
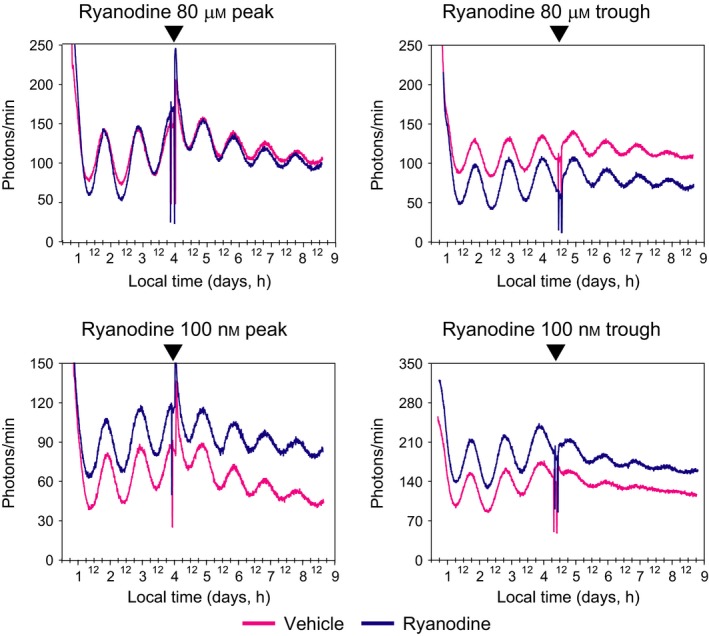
Acute inhibition or activation of RyR has no effect on the SCN PER2::LUC rhythm. Examples of bioluminescence traces corresponding to PER2::LUC protein activity from SCN explants cultured organotypically. Explants were treated 2 h with ryanodine either at peak or trough of expression (arrowheads). Concentrations of ryanodine were chosen to either activate RyRs (100 nm) or inhibit RyRs (80 μm). Each trace represents one individual SCN explant treated with ryanodine (black/blue) or vehicle (gray/pink).
Figure 2.
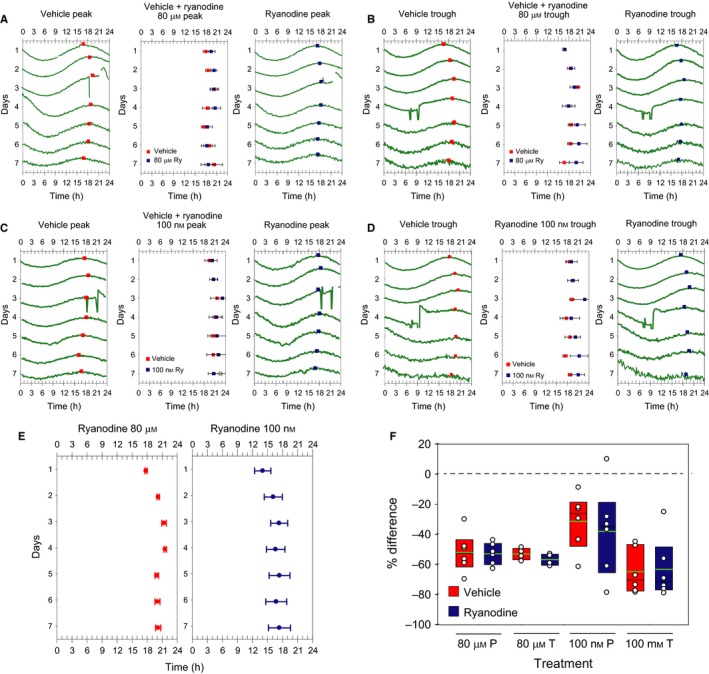
Acrophase and amplitude of PER2::LUC rhythm are not affected by RyR activation or inhibition. In A–E the acrophases (peak times) of PER2::LUC expression in SCN explants (mean ± SEM) are plotted as pseudo‐actograms to demonstrate the effect of ryanodine application on phase of the PER2::LUC rhythm. In A–D, examples of the PER2::LUC traces are shown on the left and right side of each pseudo‐actogram to illustrate the acrophases selected on each cycle (vehicle gray/pink squares; ryanodine black/blue squares). (A) Effect of 2 h acute treatment with 80 μm ryanodine (black/blue squares) or vehicle (gray/pink squares) at peak time of the third cycle of the PER2::LUC rhythm to block RyRs. (B) Acute treatment with 80 μm ryanodine (black/blue squares) or vehicle (gray/pink squares) at trough time of the fourth cycle of the PER2::LUC rhythm to block RyRs. (C) Acute treatment with 100 nm ryanodine (black/blue squares) or vehicle (gray/pink squares) at peak time of the third cycle of the PER2:LUC rhythm to activate RyRs. (D) Acute treatment with 100 nm ryanodine (black/blue squares) or vehicle (gray/pink squares) at trough time of the forth cycle of the PER2::LUC rhythm to activate RyRs. (E) Chronic application of ryanodine either blocking (80 μm) or activating (100 nm) RyR. (F) Percent change in amplitude after acute treatment with different doses of ryanodine or vehicle at time of peak (P) or trough (T) of the PER2::LUC rhythm.
Table 1.
Effect of acute exposure of ryanodine on the acrophase of PER2::LUC expression
| Group | Treatment | n | Mean (h) | SD (min) | Independent t‐test |
|---|---|---|---|---|---|
| 80 μm at peak | Control | 6 | 14.44 | 376 | t = −1.360 |
| Ryanodine | 6 | 18.69 | 264 | P = 0.207 | |
| 80 μm at trough | Control | 4 | 17.37 | 91 | t = −1.615 |
| Ryanodine | 4 | 19.46 | 125 | P = 0.162 | |
| 100 nm at peak | Control | 6 | 20.97 | 227 | t = 0.424 |
| Ryanodine | 6 | 20.1 | 217 | P = 0.681 | |
| 100 nm at trough | Control | 6 | 16.54 | 192 | t = −1.696 |
| Ryanodine | 6 | 20.43 | 278 | P = 0.125 |
Table 2.
Effect of acute exposure of ryanodine on the period of PER2::LUC expression
| Group | Treatment | n | Mean (h) | SD (min) | Independent t‐test |
|---|---|---|---|---|---|
| 80 μm at peak | Control | 6 | 23.93 | 24 | t = 0.728 |
| Ryanodine | 6 | 23.74 | 30 | P = 0.484 | |
| 80 μm at trough | Control | 4 | 23.28 | 20 | t = −0.310 |
| Ryanodine | 4 | 23.32 | 17 | P = 0.768 | |
| 100 nm at peak | Control | 6 | 24.36 | 13 | t = −0.105 |
| Ryanodine | 6 | 24.38 | 32 | P = 0.919 | |
| 100 nm at trough | Control | 6 | 24.84 | 26 | t = 1.039 |
| Ryanodine | 6 | 24.52 | 37 | P = 0.326 |
Table 3.
Effect of long‐term exposure of ryanodine on PER2::LUC expression
| Group | Treatment | n | Mean (h) | SD (min) | Paired t‐test |
|---|---|---|---|---|---|
| Acrophase | |||||
| 80 μm | Control | 6 | 20.21 | 18 | t = 0.388 |
| Ryanodine | 6 | 20.03 | 54 | P = 0.714 | |
| 100 nm | Control | 4 | 16.34 | 179 | t = −2.927 |
| Ryanodine | 4 | 17.47 | 221 | P = 0.061 | |
| Period | |||||
| 80 μm | Control | 6 | 25.28 | 07 | t = 8.233 |
| Ryanodine | 6 | 23.54 | 31 | P = 0.000 | |
| 100 nm | Control | 4 | 24.86 | 20 | t = 2.153 |
| Ryanodine | 4 | 24.25 | 21 | P = 0.120 | |
The data showing that ryanodine treatments do not affect PER2::LUC rhythms support our hypothesis that ryanodine‐mediated Ca2+ signaling functions as an output of the clock. Next we tested whether ryanodine mobilizes intracellular Ca2+ as part of the output pathway from the clock and subsequently leads to changes in firing frequency, as previously found in rats (Aguilar‐Roblero et al., 2007).
Effects of RyR activation and inhibition on intracellular calcium levels
A total of 20 slices from nine mice were used in this experiment. Baseline [Ca2+]i was higher during the day (93.9 ± 4.2 nm, n = 411 cells; Fig. 3A) than during the night (65.8 ± 2.4 nm, n = 240; Fig. 3B), confirming earlier reports (Colwell, 2000).
Figure 3.
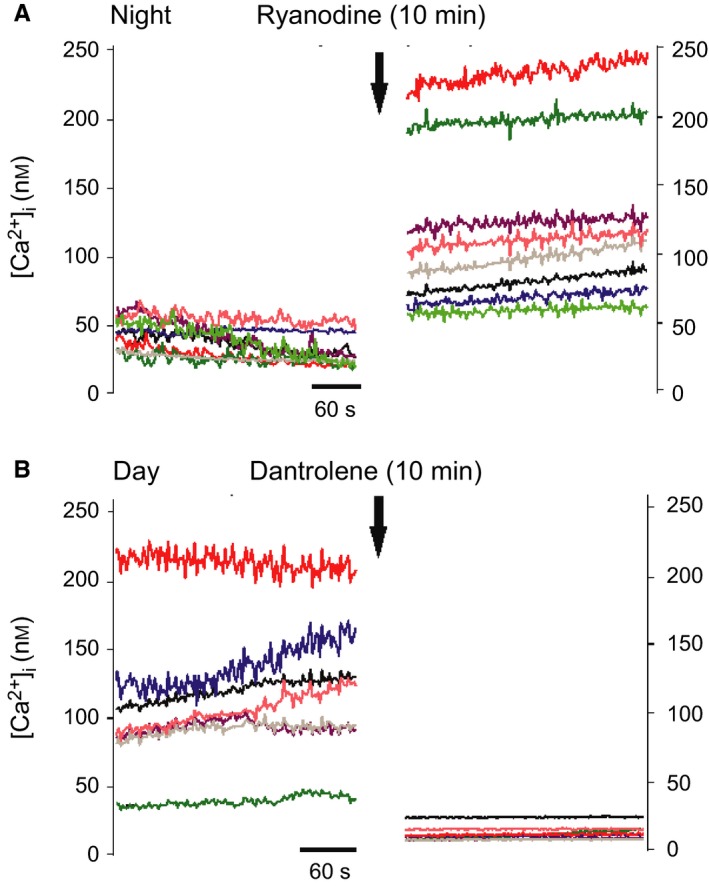
Intracellular Ca2+ responses after RyR modulation. Example traces of individual cell responses before and after 10 min treatment with drugs affecting RyR. (A) Activation with 100 nm ryanodine at midnight increased [Ca2+]i. (B) Blocking RyR with 10 μm dantrolene at midday reduced [Ca2+]i. Colors of traces are matched and represent the same cells before and after treatment.
RyR activation
After application of low dose of ryanodine (100 nm) to activate RyRs (n = 81) during the day (ZT 4–8), 49% of the cells responded with a 50% increase in [Ca2+]i, 27% of the cells showed a 66% decrease and 24% of the cells did not respond (Fig. 4A). When the same activating dose of ryanodine was applied at night (ZT 16–20; n = 201; Fig. 3A), 63% of the cells responded with a 60% increase in [Ca2+]i), 15% of the cells responded with a 70% decrease and 22% of the cells did not respond (Fig. 4B).
Figure 4.
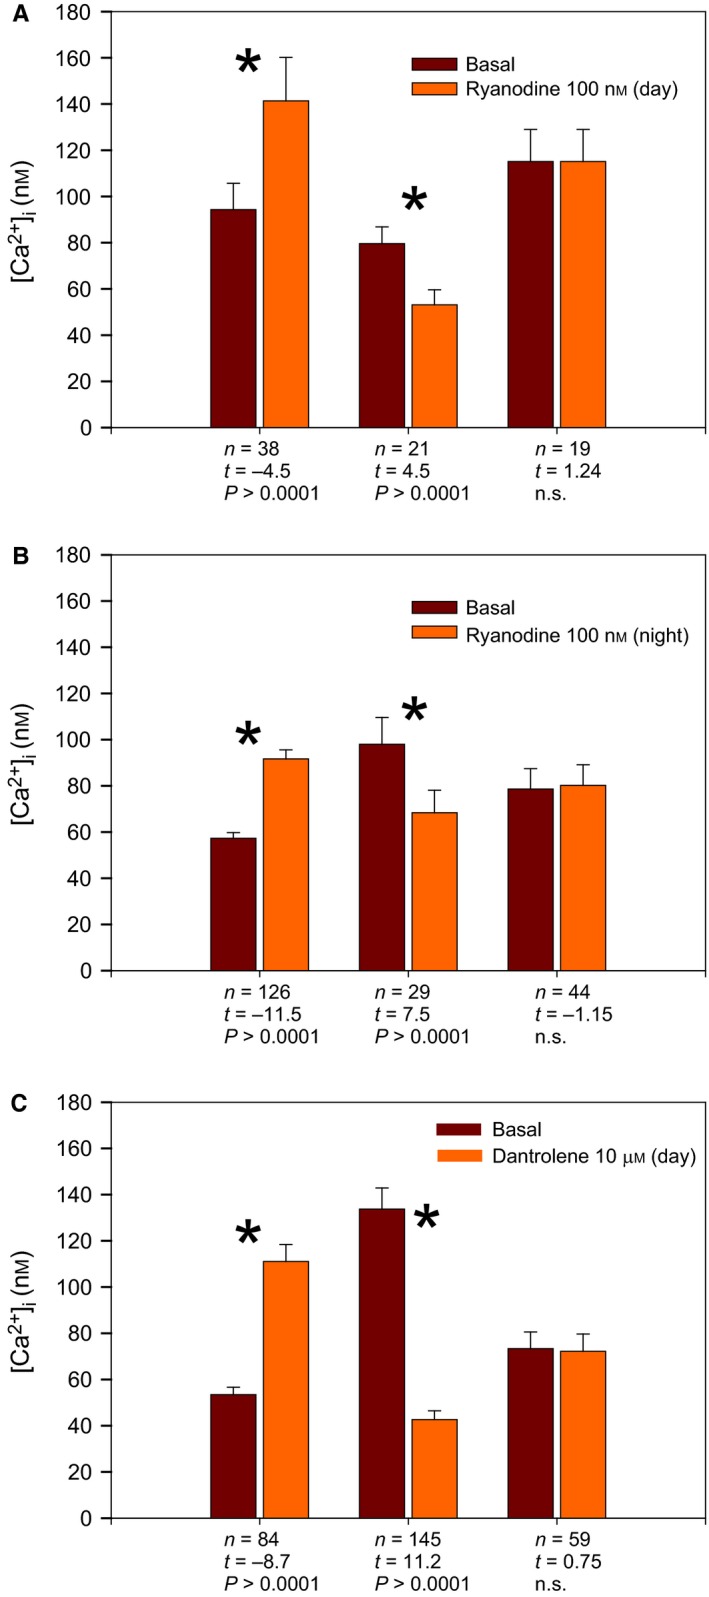
Diversity of intracellular Ca2+ responses to RyR modulation. Effect of activating the RyRs with 100 nm ryanodine during midday (A) or midnight (B) on [Ca2+]i. (C) Effect of inhibiting RyR with 10 μm dantrolene during midday on [Ca2+]i. The data are shown as mean ± SEM. Asterisks indicate significant differences before (basal) and after the treatments as indicated at the bottom of each graph.
The increase in [Ca2+]i induced by RyR activation reached significantly higher absolute values during the day (141.3 ± 10.9 nm) than during night (91.7 ± 3.9 nm; F = 8.57, P < 0.004). In contrast, the RyR activation‐induced decrease in [Ca2+]i was not significantly different between day and night (F = 1.3, P = 0.253).
The cells that responded to 100 nm ryanodine with an increase in [Ca2+]i during the night had a significantly lower baseline [Ca2+]i values (57.8 ± 2.4 nm) compared to the cells responding with a decrease or no response (98 ± 11.6 and 78.6 ± 8.8 nm, respectively; F = 12.3, P < 0.001). In contrast, during the day no difference (F = 1.8, P = 0.174) between basal [Ca2+]i in the different groups could be detected (cells responding with increase 94.3 ± 11.4 nm, decrease 79.6 ± 7.2 nm, no response 115.12 ± 13.9). In summary, RyR activation caused an increase in [Ca2+]i in the majority of the cells with larger response at night, which was correlated with a low baseline [Ca2+]i. These results suggest that responses to RyR activation in SCN neurons depend on the circadian state of the Ca2+ homeostasis.
RyR inhibition
The effect of closing RyR operated Ca2+ channels on [Ca2+]i was investigated by applying dantrolene (10 μm; n = 288), a blocker of RyRs. During the day (ZT 4–8) 50% of the cells showed a 68% decrease in [Ca2+]i (Fig. 3B), 29% of the cells showed an 108% increase and 20% of the cells did not respond (Fig. 4C). Interestingly, there was a strong correlation between baseline [Ca2+]i values and the type of response. Cells showing a decrease in [Ca2+]i after RyR deactivation had high baseline [Ca2+]i values, more typical for daytime (133.8 ± 9.1 nm), whereas the dantrolene‐induced increase in [Ca2+]i was only observed in cells with low baseline [Ca2+]i values (53.5 ± 3.2 nm), which were below the average value for daytime [Ca2+]i. Non‐responding cells had intermediate [Ca2+]i levels (73.4 ± 7.2 nm). These differences in basal [Ca2+]i were significantly different (F = 27.9, P < 0.0001).
Regional differences in Ca2+ response
The activation of RyR during the night led to a significantly larger increase in [Ca2+]i in the ventral SCN neurons (111.5 ± 12.8 nm, n = 81) compared to dorsal SCN cells (38.7 ± 3.7 nm, n = 50; P < 0.0001, t = 4.396, df = 129). There was no regional difference found in the decrease in [Ca2+]i after RyR activation or after any other drug treatment.
The effect of RyR activation and inhibition on spontaneous action potential frequency
Spiking frequency was recorded in cell‐attached mode in a total of 19 SCN neurons in 19 slices obtained from 10 mice. During the day (ZT 4–8) SCN neurons showed an average firing rate of 4.6 ± 0.6 Hz.
RyR activation
The effects of an activating dose (100 nm) of ryanodine were studied in 14 of the 19 neurons. RyR activation induced an increase in spontaneous firing rate in 50% of the neurons from 4.3 ± 1.2 Hz to 6.9 ± 1.5 Hz (t = −8.2, P < 0.001, Student's t‐test; Figs 5A and 6A). Twenty‐nine percent of the neurons responded with a decrease in spontaneous firing rate from 4.9 ± 1.5 Hz to 3.0 ± 1.05 Hz (t = 3.53, P = 0.039; Fig. 6B). Twenty‐one percent of the neurons did not significantly respond (1.7 ± 0.9 Hz to 1.4 ± 0.8 Hz; Fig. 6C).
Figure 5.
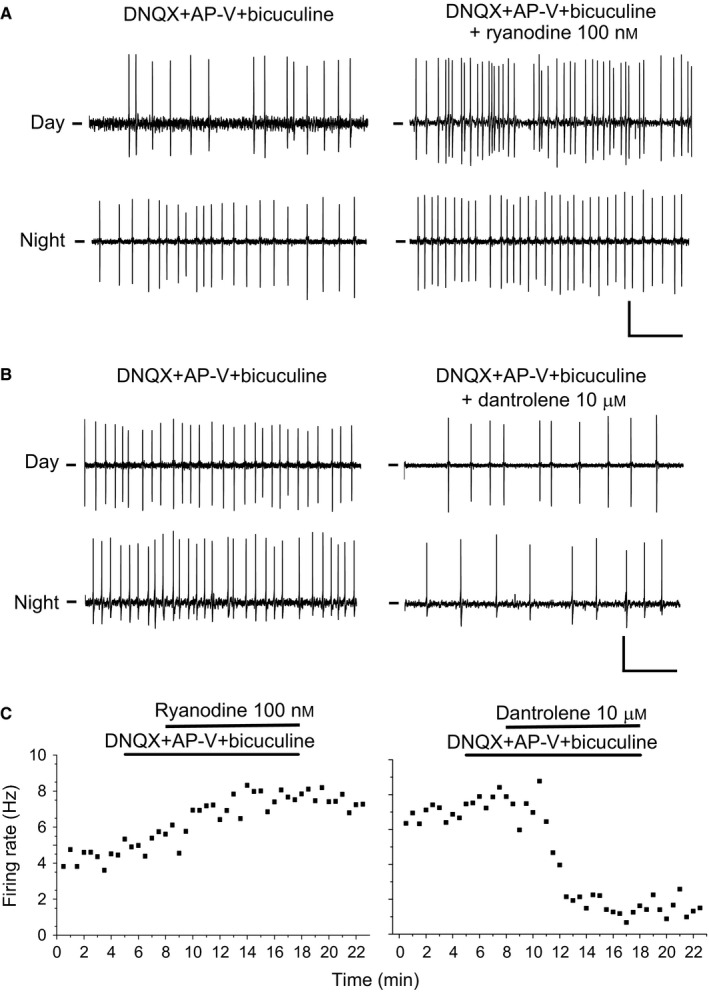
Effects of pharmacological manipulation of RyR on spontaneous SCN neuronal firing frequency. (A) Activation of RyR by application of 100 nm ryanodine (right) during day (ZT6) and night (ZT19) evoked an increase in the firing rate compared to control condition (left). Glutamatergic and GABAAergic transmission was blocked with DNQX (10 μm)/AP‐V (50 μm) and bicuculline (10 μm), respectively. (B) Inactivation of RyR by application of 10 μm dantrolene during day (ZT6) and night (ZT19) led to a decrease in the firing rate. Synaptic transmission was blocked as in A. Calibration bars: horizontal, 1 s; vertical, 10 mV. (C) Time course of the effects of 100 nm ryanodine (left) or 10 μm dantrolene (right) on the spontaneous firing from SCN neurons. Horizontal bars indicate the time of administration of the glutamate and GABA receptor blockers and the RyR manipulations.
Figure 6.
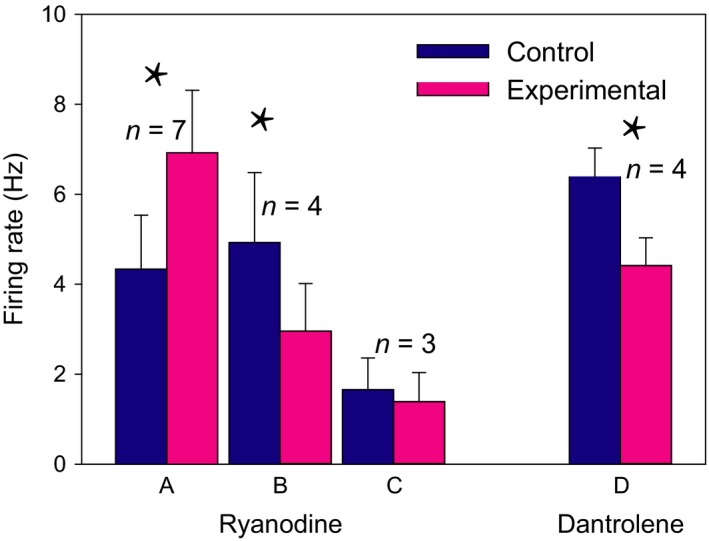
Opening the RyR causes differential responses in groups of neurons. Activation of RyR after 100 nm of ryanodine application at midday caused (A) an increase in spontaneous firing rate in 50% of tested neurons, (B) a decrease in 29% of tested neurons and (C) no effect in 21% of tested neurons. (D) Closing the RyR with 10 μm dantrolene at midday decreased the firing rate in 80% of tested neurons. The data are shown as mean ± SEM. The asterisks indicate P > 0.05 (A, t = −8.2; B, t = 3.53; D, t = 3.4).
RyR inhibition
In 5 of 19 neurons we studied the effect of 10 μm dantrolene. Four neurons responded with a decreased firing rate from 6.4 ± 0.7 to 4.4 ± 0.6 Hz (t = 3.4, P = 0.043; Figs 5B and 6D). The remaining neuron did not significantly change its firing rate (4.7 before and 4.2 Hz after the treatment). Together with the effects of ryanodine and dantrolene on [Ca2+]i, these results clearly indicate that pharmacological manipulation of RyR mobilizes Ca2+ from ER that leads to changes in membrane excitability, which in turn modulate SFR. Examples of the time course of the effects of ryanodine at night and dantrolene at day are shown in Fig. 5C.
RyR‐2 mRNA is increased during the day
To determine the extent of different levels of RyR‐2 expression in individual neurons at different times of the day, we measured RyR‐2 mRNA from SCN single neurons by qPCR. Abundance of RyR‐2 mRNA was determined in spontaneously active SCN neurons from brain slices obtained at either midday (n = 35) or midnight (n = 23). RyR‐2 mRNA expression showed a clear daily variation with a maximum expression during the day (mean ± SEM, 1.49 ± 0.36 pg; median, 0.66 pg) and minimum expression during the night (mean ± SEM, 0.31 ± 0.18 pg; median, 0.02 pg; Mann–Whitney U = 138, P = 0.001). Individual values and quartiles are shown in Fig. 7. It is worth noticing that the lower quartile values (n = 9) from midday overlap with the 25% to 75% values from midnight, whereas the upper quartile values (n = 6) from midnight overlaps with the 50% to 75% values from midday. This result supports the hypothesis that at a given ZT, SCN neurons may have different circadian phases, which could partially explain the range of [Ca2+]i responses to ryanodine found at either midday or midnight.
Figure 7.
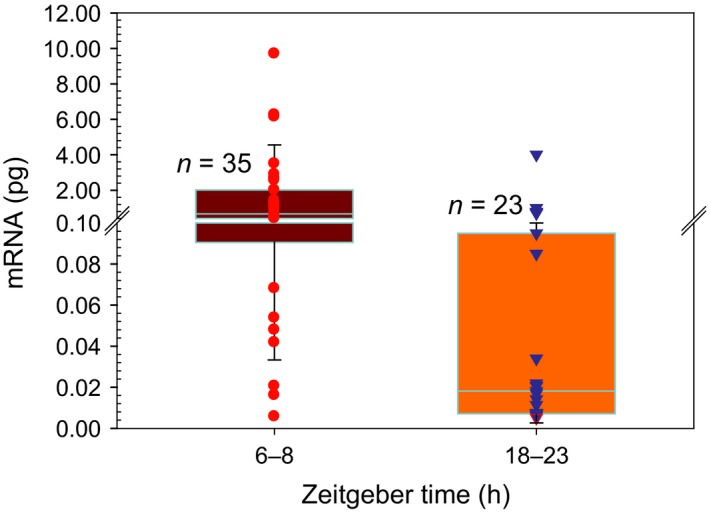
RyR2 mRNA expression in SCN neurons. Box plot showing the amount of RyR2 mRNA during midday (ZT 6–8) or midnight (ZT 18–23) in electrically active SCN neurons. The individual data are plotted as circles (ZT 6–8) or triangles (ZT 18–23). The horizontal line represents the median. The 25 and 75 percentiles (box) and 5 and 95 percentiles (whiskers) are also shown (Mann–Whitney U = 138, P > 0.001).
Discussion
In this work we provide evidence that pharmacological manipulation of RyR in mice SCN neurons modifies the free [Ca2+]i in the cytoplasm and the spontaneous firing without affecting the molecular clock mechanism. Our data also show a daily variation in RyR‐2 mRNA from mouse SCN neurons with highest levels during the day, as previously shown for rats (Diaz‐Munoz et al., 1999) and mice (Pfeffer et al., 2009).
RyR are part of the clock output pathway
Activating RyRs with 100 nm ryanodine during the midday caused a release of Ca2+ from the ER to the cytoplasm and increased spontaneous firing frequency in SCN neurons in about the same proportion (50% of tested neurons). On the other hand, closing of RyRs during midday by administration of dantrolene decreased free cytoplasmic Ca2+ in 50% of recorded neurons while reducing the spontaneous firing rate in 80% of recorded SCN neurons. In spite of these effects on intracellular Ca2+ and firing rate, neither activation nor closing the RyR had major effects on the period, phase or amplitude of PER2::LUC expression. This suggests that the RyR‐mediated change in firing rate in SCN neurons does not involve molecular clock mechanisms, but rather is a direct effect on membrane excitability via modulation of [Ca2+]i. This is consistent with our earlier reports in rat SCN neurons concluding that RyR action acts downstream from the molecular clock and is part of the output pathway of the clock (Aguilar‐Roblero et al., 2007; Mercado et al., 2009).
Neuronal response to RyR activation and inhibition is dependent on basal levels of [Ca2+]i
During the night, the response to 100 nm ryanodine in SCN neurons was related to the basal [Ca2+]i in the cytoplasm. Thus, neurons with low basal [Ca2+]i responded with Ca2+ release from the ER after treatment, whereas those neurons with high basal [Ca2+]i showed the opposite response. These differential effects may be explained by a chemical transmembrane Ca2+ gradient at the endoplasmic reticulum (ER), which determines whether [Ca2+]i is increased or decreased after opening the RyR channel with 100 nm ryanodine. In contrast, during the day no statistical differences in basal [Ca2+]i were found between neurons with different responses to ryanodine. In most SCN neurons RyR induced an increase in [Ca2+]i, although cytoplasmic Ca2+ was already high, which indicates that Ca2+ in the endoplasmic reticulum ([Ca2+]ER) is even higher than cytoplasmic Ca2+. This suggests that in these neurons the activity of sarco/endoplasmic reticulum Ca2+‐ATPase (SERCA), which transports Ca2+ from the cytoplasm to the ER (Baez‐Ruiz & Diaz‐Munoz, 2011), would be very high during the day and thereby increase [Ca2+]ER. Still, some neurons responded to ryanodine by decreasing [Ca2+]i. One explanation may be that these neurons are in a different circadian phase, in which [Ca2+]ER is lower compared to the neurons that responded with an increase. This differential phase relationship between individual SCN neurons has previously been shown in electrophysiologal (Schaap et al., 2003) and Per‐driven bioluminescence experiments (Nakamura et al., 2001). Finally, SCN neurons that showed the highest basal [Ca2+]i did not respond at all to ryanodine, suggesting that in the non‐responders an equilibrium between [Ca2+]i and [Ca2+]ER exists.
Surprisingly, differential effects (increase vs. decrease in [Ca2+]i) were also observed after blocking the RyR with dantrolene. Although dantrolene is an inhibitor of RyR2 (Dulhunty et al., 2011), a portion of the neurons, which had very low levels of basal [Ca2+]i, responded with an increase in cytoplasmic [Ca2+]i after adding 10 μm dantrolene. We hypothesize that this discrepancy could be attributed to Ca2+ release via IP3R Ca2+ channels, which may be activated when the [Ca2+]i is very low and RyR are blocked, as part of a homeostatic calcium control mechanism (Parys & De Smedt, 2012; Ansari et al., 2014).
Interaction among intracellular calcium, RyR and spontaneous rhythmic excitability
Present data demonstrate that SCN neuronal firing rate can be regulated by intracellular Ca2+ mobilized through RyRs, which are expressed with a circadian variation with the highest expression during the subjective day (Diaz‐Munoz et al., 1999). It remains to be established whether the circadian variation in the number of RyRs present in SCN neurons is the only process under regulation of the clock, or if other elements involved in the intracellular calcium dynamics are also driven by the clock, such as metabolic signals, regulatory proteins and Ca2+‐sensitive plasmatic membrane channels (Fill & Copello, 2002; Meissner, 2002; Butanda‐Ochoa et al., 2003). Any of these elements is likely to be under the control of clock genes, and therefore a part of the output pathway from the clock. Coordination between IP3Rs and RyRs has been demonstrated in other systems (Morales‐Tlalpan et al., 2005), although we did not find circadian modulation on [3H]‐IP3 binding in the rat SCN (Diaz‐Munoz et al., 1999). Future studies are necessary to evaluate the contribution from IP3Rs to the regulation of cytoplasmic Ca2+ in SCN neurons. Finally, intracellular Ca2+ is able to control neuronal excitability at many levels (Berridge, 1998; Morikawa et al., 2003), and as pointed out by Honma and Honma (2003), it is not possible to rule out a priori the contribution of these processes on the clock output.
Other roles of intracellular calcium in SCN clock function
Ca2+ signaling has previously been suggested to be involved in the entrainment pathway. It has been shown that light and glutamate during early subjective night induce Ca2+ influx via NMDA receptors and voltage‐sensitive Ca2+ channels, which leads to Ca2+‐induced Ca2+ release from ER deposits via RyRs channels and in turn results in a phase delay of the SCN rhythm in neuronal activity (Ding et al., 1998). These effects are consistent with the increased Ca2+ response to ryanodine we found during the night in a subset of neurons and are further supported by the significantly larger response in the ventral part of the SCN, which receives most of the photic input.
Several studies strongly suggest the role of intracellular calcium in circadian rhythm generation. In rats it has been shown that a transmembrane Ca2+ influx has a relevant role in rhythm generation by sustaining the molecular circadian oscillation in SCN neurons, and molecular rhythms were stopped by buffering intracellular Ca2+ with BAPTA‐AM (Lundkvist et al., 2005). In Drosophila, buffering of intracellular Ca2+ in pacemaker neurons results in slower free‐running behavioral rhythms (Harrisingh et al., 2007). It has been suggested that reducing the intracellular free Ca2+ may inhibit protein synthesis by disruption of the transcription‐translation feedback loop of the molecular clock (Khalsa et al., 1992) and thereby impact the molecular circadian rhythm. In support, continuous administration of the protein inhibitor anysomicin (5 μg/μL) during 14 days disrupted the expression of behavioral circadian rhythmicity (Mercado et al., 2009) and the protein inhibitor cyclohexamide damped rhythms in SCN slices (Yamaguchi et al., 2003). Recent studies confirm the role of Ca2+ in rhythm generation via G‐coupled pathways and Ca2+/calmodulin‐dependent protein kinase II (Brancaccio et al., 2013; Kon et al., 2014), although electrical activity within a functional neuronal network seems to be a key requirement for proper resetting of behavioral rhythms (Jones et al., 2015).
In our study the selective activation or inhibition of RyR showed diverse response of intracellular Ca2+ and did not affect the PER2 rhythm, suggesting that manipulation of intracellular Ca2+ via RyR alone may modulate the SCN firing rate, but is not sufficient to regulate phase, period or amplitude of the molecular clock. Extracellular activation of calcium release, or membrane receptor activated calcium release, which impact the molecular clock, obviously activate all types of intracellular Ca2+‐induced Ca2+ release such as IP3, and not only RyR. The role of RyR specifically in the output pathway, as shown here, may be due to the fact that certain calcium compartments are activated under specific conditions or at certain time windows. Intracellular Ca2+ activation may also differ between the core and shell regions, and even between glia and neurons. Although the role of Ca2+ in both the entrainment pathway and the oscillatory mechanism is by now well documented, more studies are needed to continue determining the exact relationship among differential intracellular Ca2+ resources, rhythm generation, resetting and output pathways.
Conclusions
We propose a model in which the RyRs are a key element for the transmission of the circadian oscillation from the transcription‐translation loop of clock genes to the membrane excitability in the SCN neurons, resulting in a circadian firing pattern transmitted to other brain areas involved in behavioral rhythm expression. Intracellular Ca2+ mobilization through RyRs may affect neuronal excitability directly through Ca2+‐modulated plasma membrane channels, and indirectly as a second messenger that activates protein kinases, which in turn regulate a variety of cellular processes converging at the cell membrane.
Conflict of interests
All the authors declare they have no conflict of interests.
Acknowledgements
We thank Ana María Escalante and Francisco Pérez for skillful technical assistance. This work was partially supported by grants from PAPIIT IN204811, CONACyT 128528 and FONCICYT 91984 to RAR and from the Swedish Research Foundation and the Swedish Brain Foundation to ACB.
References
- Aguilar‐Roblero, R. , Mercado, C. , Alamilla, J. , Laville, A. & Diaz‐Munoz, M. (2007) Ryanodine receptor Ca2+‐release channels are an output pathway for the circadian clock in the rat suprachiasmatic nuclei. Eur. J. Neurosci., 26, 575–582. [DOI] [PubMed] [Google Scholar]
- Albrecht, U. (2012) Timing to perfection: the biology of central and peripheral circadian clocks. Neuron, 74, 246–260. [DOI] [PubMed] [Google Scholar]
- Ansari, N. , Hadi‐Alijanvand, H. , Sabbaghian, M. , Kiaei, M. & Khodagholi, F. (2014) Interaction of 2‐APB, dantrolene, and TDMT with IP3R and RyR modulates ER stress‐induced programmed cell death I and II in neuron‐like PC12 cells: an experimental and computational investigation. J. Biomol. Struct. Dyn., 32, 1211–1230. [DOI] [PubMed] [Google Scholar]
- Baez‐Ruiz, A. & Diaz‐Munoz, M. (2011) Chronic inhibition of endoplasmic reticulum calcium‐release channels and calcium‐ATPase lengthens the period of hepatic clock gene Per1. J. Circadian Rhythms, 9, 6. [DOI] [PMC free article] [PubMed] [Google Scholar]
- Berridge, M.J. (1998) Neuronal calcium signaling. Neuron, 21, 13–26. [DOI] [PubMed] [Google Scholar]
- Brancaccio, M. , Maywood, E.S. , Chesham, J.E. , Loudon, A.S.I. & Hastings, M.H. (2013) A Gq‐Ca2+ axis controls circuit‐level encoding of circadian time in the suprachiasmatic nucleus. Neuron, 78, 714–728. [DOI] [PMC free article] [PubMed] [Google Scholar]
- Butanda‐Ochoa, A. , Hojer, G. & Diaz‐Munoz, M. (2003) Modulation of the skeletal muscle Ca2+ release channel/ryanodine receptor by adenosine and its metabolites: a structure‐activity approach. Bioorgan. Med. Chem., 11, 3029–3037. [DOI] [PubMed] [Google Scholar]
- Colwell, C.S. (2000) Circadian modulation of calcium levels in cells in the suprachiasmatic nucleus. Eur. J. Neurosci., 12, 571–576. [DOI] [PMC free article] [PubMed] [Google Scholar]
- Diaz‐Munoz, M. , Dent, M.A. , Granados‐Fuentes, D. , Hall, A.C. , Hernandez‐Cruz, A. , Harrington, M.E. & Aguilar‐Roblero, R. (1999) Circadian modulation of the ryanodine receptor type 2 in the SCN of rodents. NeuroReport, 10, 481–486. [DOI] [PubMed] [Google Scholar]
- Ding, J.M. , Buchanan, G.F. , Tischkau, S.A. , Chen, D. , Kuriashkina, L. , Faiman, L.E. , Alster, J.M. , McPherson, P.S. et al (1998) A neuronal ryanodine receptor mediates light‐induced phase delays of the circadian clock. Nature, 394, 381–384. [DOI] [PubMed] [Google Scholar]
- Dulhunty, A.F. , Casarotto, M.G. & Beard, N.A. (2011) The ryanodine receptor: a pivotal Ca2+ regulatory protein and potential therapeutic drug target. Curr. Drug Targets, 12, 709–723. [DOI] [PubMed] [Google Scholar]
- Fill, M. & Copello, J.A. (2002) Ryanodine receptor calcium release channels. Physiol. Rev., 82, 893–922. [DOI] [PubMed] [Google Scholar]
- Grynkiewicz, G. , Poenie, M. & Tsien, R.Y. (1985) A new generation of Ca2+ Indicators with greatly improved fluorescence properties. J. Biol. Chem., 260, 11. [PubMed] [Google Scholar]
- Harrisingh, M.C. , Wu, Y. , Lnenicka, G.A. & Nitabach, M.N. (2007) Intracellular Ca2+ regulates free‐running circadian clock oscillation in vivo . J. Neurosci., 27, 12489–12499. [DOI] [PMC free article] [PubMed] [Google Scholar]
- Honma, S. & Honma, K.‐i. (2003) The biological clock: Ca2+ links the pendulum to the hands. Trends Neurosci, 26, 650–653. [DOI] [PubMed] [Google Scholar]
- Ikeda, M. , Sugiyama, T. , Wallace, C.S. , Gompf, H.S. , Yoshioka, T. , Miyawaki, A. & Allen, C.N. (2003) Circadian dynamics of cytosolic and nuclear Ca2+ in single suprachiasmatic nucleus neurons. Neuron, 38, 253–263. [DOI] [PubMed] [Google Scholar]
- Jones, J.R. , Tackenberg, M.C. & McMahon, D.G. (2015) Manipulating circadian clock neuron firing rate resets molecular circadian rhythms and behavior. Nat. Neurosci., 18, 373–375. [DOI] [PMC free article] [PubMed] [Google Scholar]
- Khalsa, S.B. , Whitmore, D. & Block, G.D. (1992) Stopping the circadian pacemaker with inhibitors of protein synthesis. Proc. Natl. Acad. Sci. USA, 89, 10862–10866. [DOI] [PMC free article] [PubMed] [Google Scholar]
- Klein, D.C. , Moore, R.Y. & Reppert, S.M. (1991) Suprachiasmatic Nucleus: The Mind's Clock. Oxford University Press, New York, p. 467. [Google Scholar]
- Kon, N. , Yoshikawa, T. , Honma, S. , Yamagata, Y. , Yoshitane, H. , Shimizu, K. , Sugiyama, Y. , Hara, C. et al (2014) CaMKII is essential for the cellular clock and coupling between morning and evening behavioral rhythms. Gene. Dev., 28, 1101–1110. [DOI] [PMC free article] [PubMed] [Google Scholar]
- Kubista, M. , Andrade, J.M. , Bengtsson, M. , Forootan, A. , Jonak, J. , Lind, K. , Sindelka, R. , Sjoback, R. et al (2006) The real‐time polymerase chain reaction. Mol. Aspects Med., 27, 95–125. [DOI] [PubMed] [Google Scholar]
- Lundkvist, G.B. , Kwak, Y. , Davis, E.K. , Tei, H. & Block, G.D. (2005) A calcium flux is required for circadian rhythm generation in mammalian pacemaker neurons. J. Neurosci., 25, 7682–7686. [DOI] [PMC free article] [PubMed] [Google Scholar]
- Meissner, G. (2002) Regulation of mammalian ryanodine receptors. Front Biosci., 7, d2072–d2080. [DOI] [PubMed] [Google Scholar]
- Mercado, C. , Diaz‐Munoz, M. , Alamilla, J. , Valderrama, K. , Morales‐Tlalpan, V. & Aguilar‐Roblero, R. (2009) Ryanodine‐sensitive intracellular Ca2+ channels in rat suprachiasmatic nuclei are required for circadian clock control of behavior. J. Biol. Rhythm., 24, 203–210. [DOI] [PubMed] [Google Scholar]
- Moore, R.Y. & Lenn, N.J. (1972) A retinohypothalamic projection in the rat. J Comp Neurol, 146, 1–14. [DOI] [PubMed] [Google Scholar]
- Morales‐Tlalpan, V. , Arellano, R.O. & Diaz‐Munoz, M. (2005) Interplay between ryanodine and IP3 receptors in ATP‐stimulated mouse luteinized‐granulosa cells. Cell Calcium, 37, 203–213. [DOI] [PubMed] [Google Scholar]
- Morikawa, H. , Khodakhah, K. & Williams, J.T. (2003) Two intracellular pathways mediate metabotropic glutamate receptor‐induced Ca2+ mobilization in dopamine neurons. J. Neurosci., 23, 149–157. [DOI] [PMC free article] [PubMed] [Google Scholar]
- Nakamura, W. , Honma, S. , Shirakawa, T. & Honma, K. (2001) Regional pacemakers composed of multiple oscillator neurons in the rat suprachiasmatic nucleus. Eur. J. Neurosci., 14, 666–674. [DOI] [PubMed] [Google Scholar]
- National Research Council (2011) Guide to Care and Use of Animals in Experimentation, 8th edn The National Academies Press, Washington, DC, USA. [Google Scholar]
- Parys, J.B. & De Smedt, H. (2012) Inositol 1,4,5‐trisphosphate and its receptors. Adv. Exp. Med. Biol., 740, 255–279. [DOI] [PubMed] [Google Scholar]
- Pfeffer, M. , Muller, C.M. , Mordel, J. , Meissl, H. , Ansari, N. , Deller, T. , Korf, H.W. & von Gall, C. (2009) The mammalian molecular clockwork controls rhythmic expression of its own input pathway components. J. Neurosci., 29, 6114–6123. [DOI] [PMC free article] [PubMed] [Google Scholar]
- Reppert, S.M. & Weaver, D.R. (2002) Coordination of circadian timing in mammals. Nature, 418, 935–941. [DOI] [PubMed] [Google Scholar]
- Schaap, J. , Albus, H. , VanderLeest, H.T. , Eilers, P.H. , Detari, L. & Meijer, J.H. (2003) Heterogeneity of rhythmic suprachiasmatic nucleus neurons: implications for circadian waveform and photoperiodic encoding. Proc. Natl. Acad. Sci. USA, 100, 15994–15999. [DOI] [PMC free article] [PubMed] [Google Scholar]
- Schwartz, W.J. , Gross, R.A. & Morton, M.T. (1987) The suprachiasmatic nuclei contain a tetrodotoxin‐resistant circadian pacemaker. Proc. Natl. Acad. Sci. USA, 84, 1694–1698. [DOI] [PMC free article] [PubMed] [Google Scholar]
- Stephan, F.K. & Zucker, I. (1972) Circadian rhythms in drinking behavior and locomotor activity of rats are eliminated by hypothalamic lesions. Proc. Natl. Acad. Sci. USA, 69, 1583–1586. [DOI] [PMC free article] [PubMed] [Google Scholar]
- Yamaguchi, S. , Isejima, H. , Matsuo, T. , Okura, R. , Yagita, K. , Kobayashi, M. & Okamura, H. (2003) Synchronization of cellular clocks in the suprachiasmatic nucleus. Science, 302, 1408–1412. [DOI] [PubMed] [Google Scholar]
- Yoo, S.H. , Yamazaki, S. , Lowrey, P.L. , Shimomura, K. , Ko, C.H. , Buhr, E.D. , Siepka, S.M. , Hong, H.K. et al (2004) PERIOD2::LUCIFERASE real‐time reporting of circadian dynamics reveals persistent circadian oscillations in mouse peripheral tissues. Proc. Natl. Acad. Sci. USA, 101, 5339–5346. [DOI] [PMC free article] [PubMed] [Google Scholar]