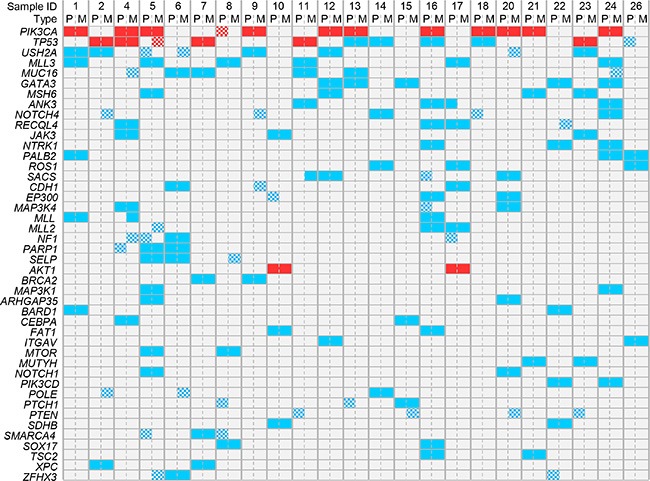
Figure 3. Distribution of mutations in all samples.

The mutations present in at least 4 out of 46 samples are shown. Genes are ordered from top to bottom by decreasing frequency of mutations. Samples are ordered by patient number. Recurrent mutations are in red and non-recurrent mutations are in blue. The checkerboard pattern indicates the discordant mutations between primary tumors (P) and paired metastases (M).
