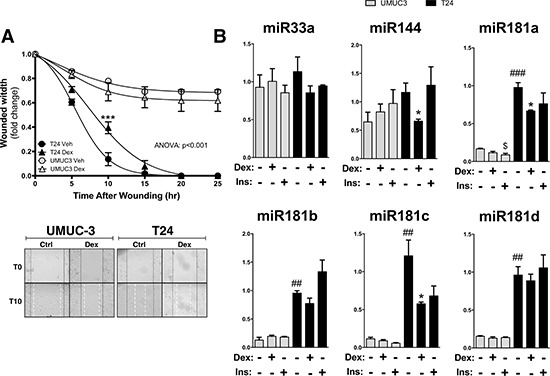
Figure 6. The effect of dexamethasone treatment on cell migration and miRNA expression in UMUC-3 and T24 bladder cancer cells.

Migration was measured in the UMUC-3 and T24 cells that were treated with either vehicle or 100 nM dexamethasone for 30 minutes prior to wounding, and is presented as the fold-change in the wound width remaining (A). Images of the migration assay at 0 and 10 hours post wounding are shown, with wound edges marked at T0 (black solid line) and T15 (white dashed line). ANOVA p < 0.001; Bonferoni comparisons ***p < 0.0001 (versus Vehicle) (±S.E.; n = 6). Total RNA was extracted from the UMUC3 and T24 cells after treating with either vehicle, 100 nM dexamethasone, or 100 nM Insulin in dialyzed media for 2 hours before harvesting, and miRNA expression was measured by Real-time PCR (B). *p < 0.05; (Dex versus Veh); $p < 0.05; (Ins versus Veh); ##p < 0.01; ##p < 0.001; (T24 versus UMUC3) (±S.E.; n = 6).
