Abstract
Fluorine-19 magnetic resonance imaging (19F MRI) probes enable quantitative in vivo detection of cell therapies and inflammatory cells. Here, we describe the formulation of perfluorocarbon-based nanoemulsions with improved sensitivity for cellular MRI. Reduction of the 19F spin-lattice relaxation time (T1) enables rapid imaging and an improved signal-to-noise ratio, thereby improving cell detection sensitivity. We synthesized metal-binding β-diketones conjugated to linear perfluoropolyether (PFPE), formulated these fluorinated ligands as aqueous nanoemulsions, and then metalated them with various transition and lanthanide ions in the fluorous phase. Iron(III) tris-β-diketonate ('FETRIS') nanoemulsions with PFPE have low cytotoxicity (<20%) and superior MRI properties. Moreover, the 19F T1 can readily be reduced by an order of magnitude and tuned by stoichiometric modulation of the iron concentration. The resulting 19F MRI detection sensitivity is enhanced by 3-to-5 fold over previously used tracers at 11.7 T, and is predicted to increase by at least 8-fold at clinical field strength of 3 T.
Magnetic resonance imaging (MRI) is becoming a clinical tool for visualizing specific cell populations in the body1. MRI cell detection using exogenous agents can be used to visualize the in vivo trafficking and behaviour of immune or stem cells used to treat a host of diseases. Fluorine-19 (19F) ‘tracer’ agents are an emerging approach to intracellularly label cells of interest, either ex vivo or in situ, to enable cell detection via 19F MRI1, 2. The 19F label yields positive-signal ‘hot-spot’ images, with no background signal due to negligible fluorine concentration in tissues. Images can be quantified to measure apparent cell numbers at sites of accumulation2, 3, thereby enabling ‘in vivo cytometry’4. Tracer agent compositions have mostly focused on nontoxic perfluorocarbons (PFC). Clinical translation of 19F cell detection has recently been realized in patients5 using PFC nanoemulsion to label a dendritic cell cancer vaccine; in these experiments, the cell detection limit was conservatively estimated to be of order 105 cells per voxel5.
Improving the sensitivity of 19F cell detection could lower the barriers for using this technology in a wider range of biomedical applications. One approach for boosting sensitivity is by decreasing the intrinsically-high 19F spin-lattice relaxation time (T1) of PFC molecules6–8. The T1 ultimately limits the rate of 19F MRI data acquisitions. Often, 19F images require summation of multiple acquisitions (i.e., signal averaging) to generate a sufficient signal-to-noise ratio (SNR) for confident interpretation. High 19F T1 values require a long repetition time (TR) to allow for longitudinal signal recovery, thus limiting the number of signal acquisitions attainable during a fixed total imaging time (ti). As ti is constrained when scanning patients, the key parameter to maximize is SNR/ti. Shortening T1 can increase SNR/ti, sensitivity, and decrease the minimum number of detectable cells per voxel. In practice, reducing T1 by molecular design can also lead to a reduction in the spin-spin relaxation time (T2) and line broadening of the resonance; this effect may degrade the SNR if T2 becomes comparable to the data acquisition sampling time along the frequency encoding direction9. The creation of stable and cytocompatible 19F agents with ‘ultra-fast’ T1 is an open challenge that can greatly impact the MRI field, enabling accelerated MRI acquisitions and the detection of sparser cell populations in vivo.
The relaxation times T1 and T2 can be profoundly altered by high-spin paramagnetic metal ions (e.g., Mn2+, Fe3+, Gd3+). Prior studies6 have attached Gd3+ to the outer surface of the PFC nanoemulsion droplet resulting in modest reductions in T1. With increasing distance (r), the steep fall-off (~r−6) of paramagnetic relaxation rate enhancement from paramagnetic centers limit the efficacy of relaxation agents bound to the surface of PFC nanoparticles.8, 10 Thus, effective relaxation enhancement necessitates introduction of metal ions into the fluorous phase, i.e., within the nanoemulsion droplets, to achieve a short T1 using a minimum amount of a paramagnetic additive.
We describe the scalable synthesis and properties of a family of paramagnetic PFC nanoemulsions with excellent 19F MRI and biological properties. We show that fluorinated materials incorporating suitable ligands can tightly bind and retain sufficient amounts of metal ions in the fluorous phase of the nanoemulsion to yield 19F agents with greatly enhanced sensitivity. These new nanoemulsion materials contain metal-binding β-diketones conjugated to linear perfluoropolyether (PFPE). Using these agents, we describe preliminary assessments of the biocompatibility, cell labeling stability, and in vivo MRI studies in mice. Sensitivity enhancement of these materials will potentially accelerate the use of 19F cell detection in a host of clinical cell therapy trials and for diagnostic inflammation imaging.
Modeling of paramagnetic relaxation enhancement
In the initial design of 19F probes, we conducted magnetic resonance relaxation time modeling of the impact of dissolving metals ions into PFC. Solomon–Bloembergen–Morgan (SBM) theory11, 12 describes paramagnetic relaxation enhancement (PRE) of R1=1/T1 and R2=1/T2 of surrounding media at a given magnetic field strength, molecular mobility, and metal concentration (See Supporting Information). Using SBM theory, we found optimal parameters for enhancement of R1 while minimizing linewidth broadening, i.e., R2. The modeling results (Fig. S1) show that Fe3+ uniformly dispersed in PFC will provide the most robust enhancement of 19F R1. Mn2+ and Gd3+ are likely to cause severe line broadening due to a large increase in R2, especially at high magnetic field strengths. This line broadening originates from very slow electronic relaxation in Mn2+ and Gd3+ (Fig. S1).
Design and preparation of metal-binding perfluorocarbons
Design of a cytocompatible fluorous-soluble metal chelate requires careful consideration. The steep fall-off of PRE with increasing distance (~r−6) necessitates solubilisation of individual metal ions, as opposed to incorporating metal-bearing oligomeric clusters or nanoparticles. The metal must not efflux from the fluorous phase during cell labelling and after in vivo administration. The high electronegativity of fluorine imparts very low cohesive energy density13 and Lewis basicity14 to heavily fluorinated compounds, making them extremely poor solvents and ligands. The choice of ligands compatible with fluorous phase is therefore limited to the most hydrophobic scaffolds, with as few intermolecular interactions as possible. To maximize solubility in the fluorous phase, the resulting metal complex should be uncharged and coordinatively saturated. These criteria can be satisfied by using bidentate, monoionic ligands (L) that form high-spin, charge-neutral tris-complexes with trivalent metals (FeL3, GdL3) and bis-complexes with divalent metals (MnL2). Of these, only FeL3 are coordinatively saturated, due to the small size of the parent Fe3+ ion. Coordinatively unsaturated complexes of larger Mn2+ and Gd3+ tend to be unstable with respect to the formation of oligomeric15, charged, or ternary complexes16 (e.g., [GdL3]n, [GdL4]−, [GdL3•(H2O)x]). Although gadolinium chelates are widely used contrast agents in clinical 1H MRI because Gd3+ has the highest magnetic moment, we predict that Fe3+ is better suited for 19F applications.
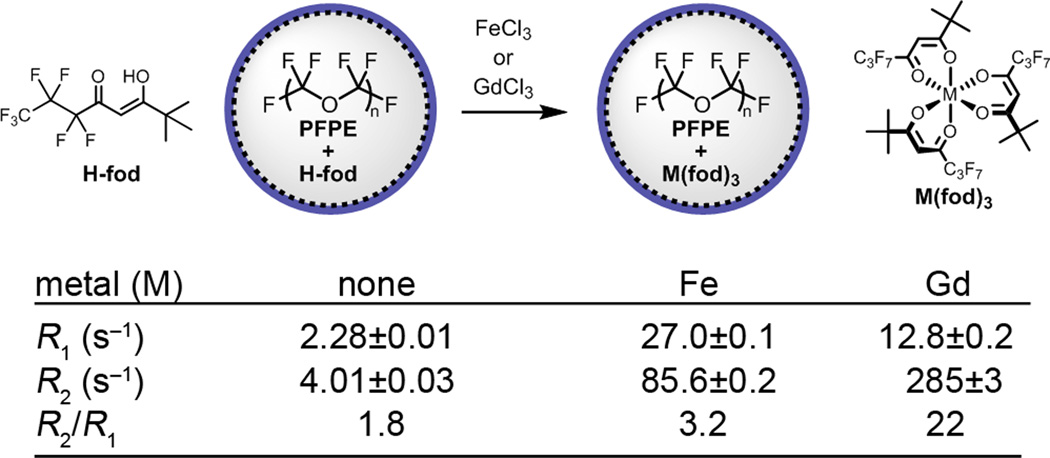
Initially, we tested the results of the PRE modeling [see Supplementary Information (SI) Fig. S1] using small molecules. Fluorinated β-diketone H-fod (Fig. 1) was chosen as starting point. Addition of 2.8 mM H-fod to the aqueous phase of a premade PFPE nanoemulsion displays apparent dissolution of the diketone and appearance of heptafluoropropyl groups in 19F NMR spectra featuring three broad singlets. Addition of 0.7 mM FeCl3 led to the slow formation of orange-colored Fe(fod)3 and a commensurate increase in R1 from 2.3 to 27.0 s−1 and in R2 from 4.0 to 85.6 s−1 (at 9.4 T) of the major PFPE resonance (−91.4 ppm) by 24 hours (Fig. S3). With GdCl3, lower R1 (12.8 s−1) and higher R2 (285 s−1) values were obtained. The corresponding gadolinium complex displayed modest R1 values accompanied by strong line broadening, a likely consequence of both high electronic relaxation time (T1e) of Gd3+ and high rotational correlation time (τF) of the oligomeric gadolinium chelate (see Eqs. S1–S4 and Fig. S1 and S2 in SI). However, broad NMR signals of the ligand in the absence of metals and slow metalation kinetics suggested insufficient solubility of H-fod in PFPE.
Figure 1. Comparison of iron and gadolinium diketonates (H-fod) as 19F relaxation agents for PFPE.
The relaxometry results (9.4 T) are displayed for PFPE emulsions (120 g/L PFPE) containing H-fod (2.8 mM) 24 hours after the addition of 0.7 mM metal ions. R1 and R2 values are reported for the main PFPE peak at −91.4 ppm. The results show that Fe3+ is a more effective R1 agent than Gd3+.
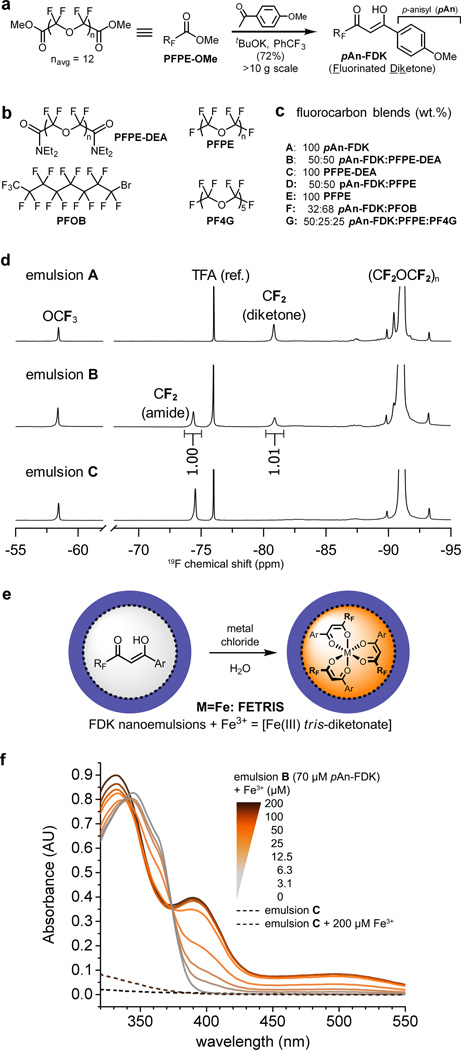
To improve solubility, we investigated fluorinated β-diketones (FDK) that have a greater fluorine content. We prepared the PFPE-based ligand pAn-FDK using Claisen condensation17 between PFPE-OMe and excess p-methoxyacetophenone, yielding highly pure pAn-FDK product at >10 g scale upon simple extractive workup (Fig. 2a). 1H NMR analysis revealed new peaks at 6.46 and 15.35 ppm, characteristic of a diketone in enol form (Fig. S4). This ligand was used for subsequent studies.
Figure 2. Preparation and characterization of metal-binding nanoemulsions for 19F MRI.
a, Synthesis of metal-binding fluorinated diketones (FDK) from PFPE-OMe (denoted as RFCO2Me). b, Structures of fluorocarbons used for 19F MRI. c, Composition and preparation of various metal-binding (A, B, D, F, G) and control (C, E) fluorocarbon nanoemulsions. d, 19F NMR spectra (11.7 T) of emulsions A–C (4.5 g/L 19F, 90% D2O). Signals from terminal CF2 of diketone ligands are well separated from other peaks and are used to determine ligand concentration. The peak at −76 ppm is the reference (CF3CO2Na, TFA). e, Addition of aqueous metal chlorides to FDK emulsions yields metalated emulsions; Ar = pAn. f, Absorption spectra of metal-binding emulsion B (70 µM diketone, 0.09 g/L 19F) (color) and control emulsion C (0.09 g/L) (---) in the presence of Fe3+. Increasing [Fe3+] causes the appearance of ferric tris-diketonate charge transfer bands at 395 and 500 nm that grow linearly in intensity until the ca. 3:1 ligand:Fe ratio is reached at 25 µM Fe3+.
To evaluate 19F MRI properties, we blended pAn-FDK with a variety of perfluorocarbon derivatives and formulated these blended oils into aqueous nanoemulsions using microfluidization. Nanoemulsions (Fig. 2c) included pAn-FDK alone (emulsion A), or as a blend with PFPE diethylamide (DEA) (B), PFPE (D), perfluorooctyl bromide (PFOB) (F), or a short PFPE oligomer perfluorotetraglyme (PF4G) (G). Emulsions C (pure PFPE-DEA) and E (pure PFPE) are controls that cannot bind metals (Fig. 2c). We note that PFOB was tested because of its rapid clearance from the body and prior use clinically, but is not preferred for MRI cell detection due to its multiple 19F resonances that diminish image quality18. In all formulations A–G, stable nanoemulsions were formed, with similar physical characteristics. Dynamic light scattering (DLS) measurements in A–G displayed monodisperse nanoemulsions with a polydispersity index (PDI) of <0.2 and average droplet diameters ranging from 140–200 nm and negative ζ-potentials of −27 to −56 mV (Fig. S5). No change in DLS measurements were noted for up to 8 months of storage at 4 °C. Nanoemulsion composition was confirmed by 19F NMR (Fig. 2d). Terminal CF2 atoms of PFPE derivatives have resonances between −70 and −85 ppm. Presence of only one major peak in this spectral range in single-component emulsions A and C confirmed high purities of the starting oils; emulsion B shows peaks from both components in the expected 1:1 ratio. Core CF2CF2O units resonating at −91 ppm comprise ~90% of the total 19F spectral weight and is typically the only signal detectable by 19F MRI, which generally has a much lower SNR compared to conventional 1H images.
Properties of metalated nanoemulsions
The Pluronic surfactant used in the nanoemulsion formulation is permeable to ions enabling direct metalation of FDK nanoemulsions by the addition of metal chloride into the aqueous phase (Fig. 2e). Optical changes due to the formation of metal complexes were readily observed (Fig. 2f and S6). Among these, europium chelates are notable for their bright photoluminescence which may be useful for studying intracellular localization and trafficking of the PFC droplets (Fig. S11e). Importantly, addition of FeCl3 caused rapid (kobs = 0.69±0.10 min−1) appearance (Fig. S7) of characteristic charge transfer bands of ferric diketonates19 (ε390 =23, ε500=4.9 mM−1cm−1) that linearly increased in intensity with increasing [Fe3+] until the Fe:FDK ratio of ca. 1:3 was reached, consistent with ferric tris-diketonate (Fig. 2f). Henceforth, the term ‘FETRIS’ (FErric TRIS-diketonate) refers to pAn-FDK blended with PFPE and metalated with Fe3+.
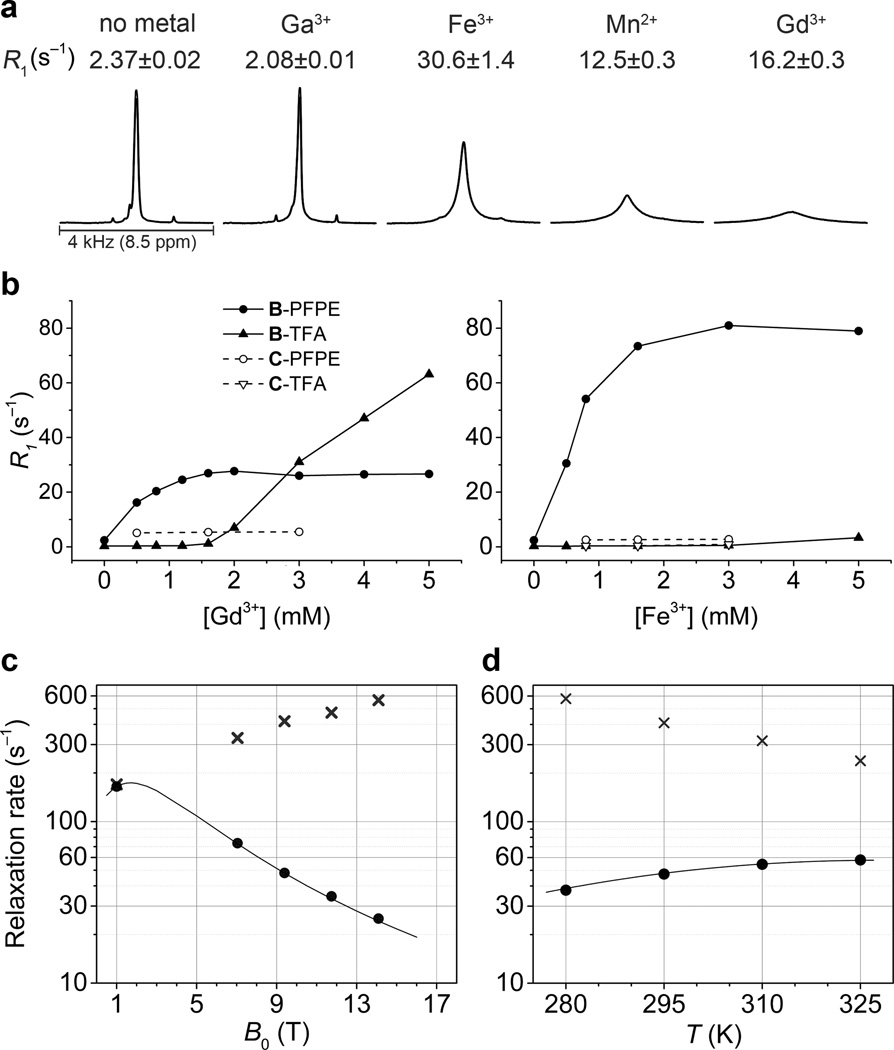
Relaxometric evaluation of nanoemulsions in the presence of different metals (Fig. 3a) revealed that binding of Fe3+ resulted in modest line broadening of all 19F NMR resonances, including the main PFPE peak at −91 ppm. The highest R1 observed (158.2±2.5 s−1 at 11.7 T), with a linewidth of 4 kHz, was with FETRIS saturated with Fe3+. Despite the largest number of unpaired electrons, Gd3+ showed a two-fold lower R1 compared to Fe3+, with severe line broadening. Mn2+ gave moderately broad signals with the lowest R1 of the triad. To confirm that the linewidth of metalated nanoemulsions is dominated by paramagnetism and not by metal binding per se, diamagnetic Ga3+, with a similar ionic radius to Fe3+, was included in the analysis and was found to have R1 and R2 equal to 2.08±0.01 s−1 and 20.9 ± 0.3 s−1, respectively. Also, the small change in relaxation rates relative to the unmetalated emulsion, with R1 = 2.37±0.01 s−1, and R2 = 15.1±0.2 s−1 (9.4 T), is attributable to an increase in the effective molecular weight upon formation of the metal complex.
Figure 3. Fluorine-19 relaxometry of metalated PFPE emulsions.
a, R1 and 19F NMR spectra of FETRIS nanoemulsion (4.5 g/L 19F, 3.5 mM diketone) in the presence of 0.5 mM metal ions, 15 mM HEPES, and at pH 7.4. The peaks from different 19F spectra are scaled to the same absolute intensity. b, Relaxometric analysis of Fe3+ and Gd3+ binding capacity. Shown are measurements of R1 for both PFPE (fluorous phase) and trifluoroacetate reference (TFA) added to the aqueous phase. c, Magnetic field dependence at T = 295 K and d, temperature (B0 = 9.4 T) dependence of observed relaxation rates R1 (●) and R2 (x) in FETRIS nanoemulsion (22.5 g/L 19F, 17.5 mM diketone, 2.8 mM Fe3+) and predicted R1 (—) values using Eqs. S1–S4. Predicted R1 values represent best fit to SBM equations, with r = 1.19 nm, τF (295 K) = 0.80 ns, τv (295 K) = 3.59 ps, the Arrhenius temperature dependence with activation energies of 3.6 kcal/mol for τF and 4.5 kcal/mol for τv. The diamagnetic contributions to R1 are presumed to be negligible and Δ fixed at 0.2 cm−1. R1 values increase, while R2 values decrease, at lower magnetic field strengths, suggesting that there will be no degradation of SNR at clinical fields due to line broadening.
We determined the phase distribution of the paramagnetic ions and the metal binding capacity of FDK nanoemulsions (Fig. 3b). Measurement of R1 at 11.7 T for both PFPE (fluorous phase) and trifluoroacetate reference (TFA) added to the aqueous phase revealed that nanoemulsions efficiently extracted Gd3+ and Fe3+ from water into the fluorous phase. R1 of PFPE reached a plateau at ligand-to-metal ratio of ca. 2.5; increasing metal concentration further affected the R1 of TFA. Notably, an increase in R1 of TFA was observed even at the lowest Gd3+ concentration in pure PFPE nanoemulsion, confirming that the paramagnetic ion stays in the aqueous phase. We speculate that the modest (~2-fold) increase in R1 of PFPE in this case was likely due to binding of Gd3+ ions to the nanoemulsion surface8, 10. We observed a divergent field and temperature dependence of R1 and R2 in FETRIS nanoemulsions (Fig 3c,d, Fig. S8). Further control over relaxation parameters was achieved by tuning molecular weight and viscosity of the emulsion components (Fig. S9). Other rare earths had only a minor effect on R1, consistent with fast electronic relaxation in these metal ions20 (Fig. S10).
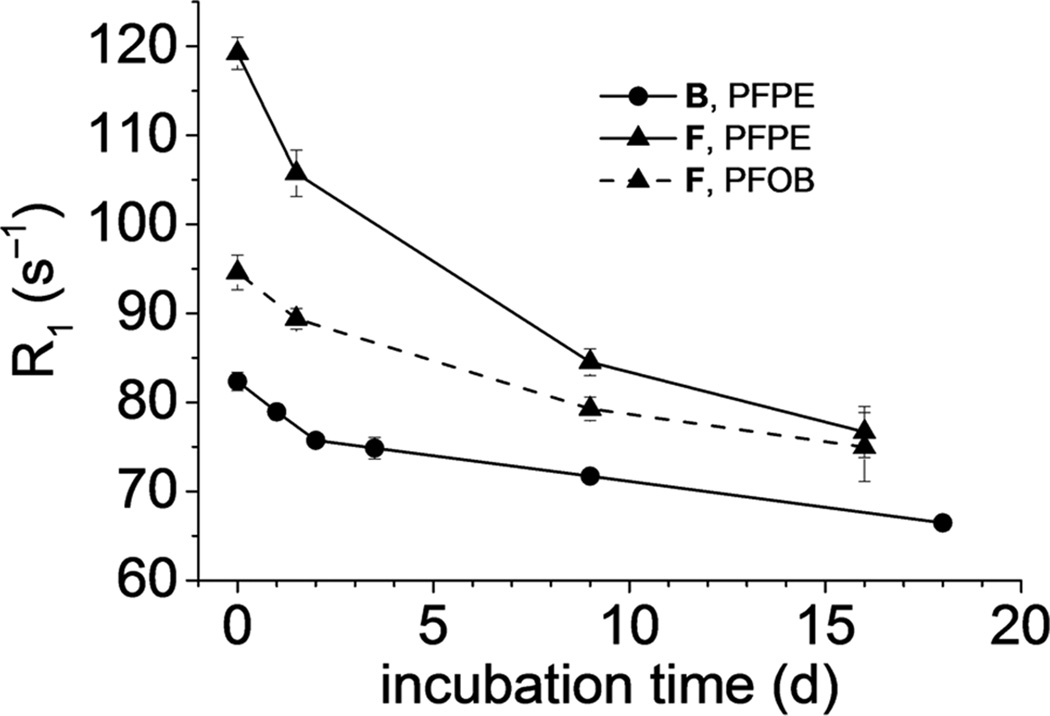
We also evaluated the stability of metal–FDK complexes. Using metal-loaded nanoemulsion, we monitored changes in photoluminescence (Eu3+) and absorbance (Fe3+) in the presence of excess competing ligands to study potential leakage of metal from the fluorous phase. Ethylenediaminetetraacetate (EDTA), a strong metal chelator21, rapidly (<5 min) abolished the photoluminescence of europium-loaded emulsion due to complete sequestration of Eu3+ to the aqueous phase to form a non-photoluminescent EDTA complex. In contrast, FETRIS nanoemulsion showed no decrease in characteristic absorbance of the Fe3+ chelate, even with prolonged exposure to EDTA. To estimate long-term stability of FETRIS nanoemulsions, relaxation rates were measured in the presence of EDTA (Fig. 4). PFPE-based nanoemulsion showed <20% decrease in R1 over 2 weeks of incubation at 37 °C with EDTA.
Figure 4. Relaxometry stability of FETRIS nanoemulsions in the presence of competing aqueous ligand.
Nanoemulsion B and F, both metalated with 0.7 mM Fe3+, were treated at 37 °C with 75 mM EDTA dissolved in aqueous phase. Shown are R1 values of PFPE ( ) in nanoemulsion B, and values for blend nanoemulsion F, including PFPE components (
 ) and the CF3 signal of PFOB (
 ). A slight decrease over time is observed, as slow Fe3+ efflux occurs from the fluorous phase and irreversibly binds to EDTA. Error bars are standard deviations from three independent replicates.
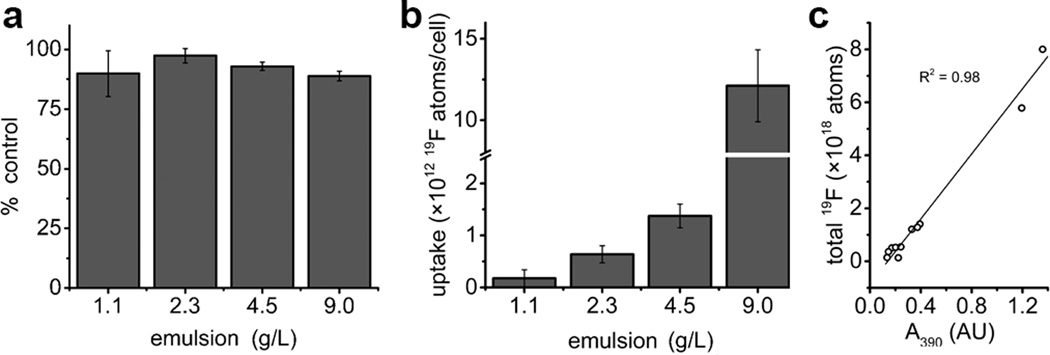
Next, we examined FETRIS nanoemulsion properties in labeled cells. Ex vivo labeling of a rodent glioma cell line (GL261) with FETRIS showed good viability post-labeling (Fig. 5a), with loadings on the order of ~1012 19F atoms/cell (Fig. 5b). Uptake of FETRIS was evident by the orange color of cell pellets, and optical absorbance in the lysate correlated with the 19F content determined by NMR (Fig. 5c). Fluorine-19 relaxometry of labeled cells (Fig. S11) showed that FETRIS nanoemulsion did not appear to lose Fe3+ to the intracellular milieu over time; moreover, in the same nanoemulsion formulated without added Fe3+, it did not appear to sequester endogenous Fe3+ from the cell’s labile iron pool (Fig. S11c). However, Gd3+ substituted for Fe3+ in the nanoemulsion displayed evidence of some metal leakage upon cell labeling; we observed ca. 25% reduction of 19F R1 values after labeling (Fig. S11d).
Figure 5. Cell labeling with FETRIS nanoemulsion.
Cells (GL261) were labeled in culture using FETRIS nanoemulsion. a, Cell viability. b, Cell uptake of FETRIS as measured by 19F NMR. c, Correlation of uptake determined by 19F NMR with optical absorbance of cell lysate at 390 nm due to FETRIS. Error bars are standard deviations from three independent replicates.
Magnetic resonance imaging with FETRIS
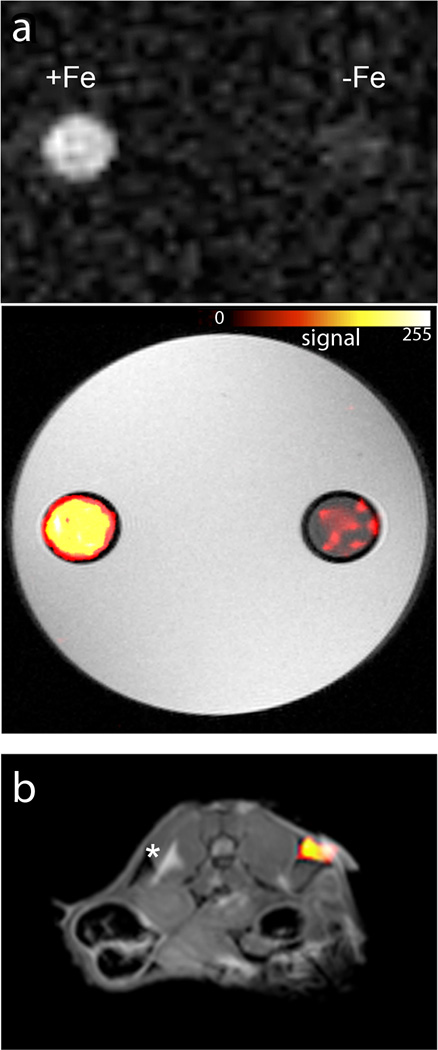
Phantom 19F MRI studies demonstrated the feasibility of imaging FETRIS using conventional MRI methods. A phantom sample was prepared consisting of two NMR tubes containing FETRIS prepared with parameters R1/R2=32.5/170 s−1 and the same emulsion without metal (R1/R2=2.2/3.7 s−1); tubes were embedded in agarose. Images were acquired at 11.7 T using a spin-density weighted gradient echo (GRE) sequence, with scanning parameters set at the Ernst angle condition9 for optimal imaging of the FETRIS specimen, and a ~4 min image acquisition time. Figure 6a displays phantom MRI results, where the FETRIS sample appears hyperintense; the measured 19F image SNR for FETRIS and Fe-negative specimens were 8.6 and 1.7, respectively, yielding a SNR improvement of ~5 for the FETRIS sample, without Rician correction for low SNR regime3. If each capillary was imaged using its appropriate Ernst angle, the SNR improvement would be ~3.3 (see modeling results Fig. S12). To further minimize potential T2 signal loss when imaging FETRIS agents, one could potentially use so called Ultrashort TE (UTE) or Zero TE (ZTE) pulse sequences7. Pulse sequences like GRE are commonplace on clinical scanners, whereas ZTE is not yet readily provided by MRI vendors.
Figure 6. MRI of FETRIS nanoemulsion.
a. Phantom comprised of two agarose-embedded NMR tubes containing FETRIS nanoemulsion (4.5 g/L 19F) with 0.5 mM Fe3+ (R1/R2 = 32.5/170 s−1) and nanoemulsion without metal (R1/R2 2.2/3.7 s−1), denoted +Fe and −Fe, respectively. The top panel shows unthresholded 19F images, and below, the 19F image is thresholded, rendered in hot-iron pseudo-color (scale bar), and overlaid onto the grayscale 1H image. The 19F/1H MRI data were acquired using a GRE sequence. b, Displays mouse GL261 glioma cells (5×10⁶) labeled with FETRIS nanoemulsion ex vivo and injected subcutaneously into mouse flank. The 19F data is rendered in pseudo-color and placed on a grayscale slice from the 1H data. After 24 hours, mice were imaged, and a cell ‘hot-spot’ is seen on the right flank in the axial view. Cells labeled with metal-free nanoemulsion and injected on the contralateral side could not be detected. Asterisk is adjacent chemical shift displacement artifact from hyperintense subcutaneous fat at 11.7T. The 19F and 1H images were acquired using ZTE and GRE pulse sequences, respectively. For display, a co-registered 2D GRE slice was embedded into a 3D rendering of the 19F data.
Preliminary in vivo imaging of FETRIS-labeled cells was performed. Glioma cells were labeled with FETRIS nanoemulsion (50 wt.% pAn-FDK, 50 wt.% PFPE) ex vivo to a level of ~1012 19F/cell. A second batch of glioma cells was labeled at comparable levels with PFPE emulsion without metal. Cells (5×10⁶ per side) were injected subcutaneously into left (no metal) and right (FETRIS) flanks in syngeneic C57BL/6 mice (N=3). After 24 hours, mice were imaged with 1H/19F MRI at 11.7T (Fig. 6b). The 19F images were acquired using a three-dimensional ZTE sequence (Fig. 6b). Cells were readily visible (SNR~7) in the right injected flank (Fig. 6b), but not on the left side (no metal). Future in vivo studies will utilize FETRIS to image stem cells and immune cell populations in preclinical models.
Outlook
Here we present a unique approach for formulating nanoemulsions using PFPE-based β-diketones (FDK) as metal chelators. These ligands have previously been studied in the context of material science16, NMR spectroscopy22, and catalysis23. We show that FDK is well-suited for incorporating large amounts of paramagnetic metal ions into the fluorous liquids. Formulated as stable PFPE-in-water nanoemulsions, FDK efficiently and irreversibly extract Fe3+ ions from aqueous solution into the fluorous phase, giving rise to cytocompatible FETRIS agent. These paramagnetic materials are useful for 19F MRI with enhanced sensitivity due to a dramatic reduction in T1, a fundamental parameter limiting the speed of MRI data acquisitions. The 19F T1 value reduction is magnetic field-strength dependent, but can potentially be accelerated to values approaching 80× at clinical field strengths, yielding a >8-fold sensitivity increase in 19F detection (Fig. S12). These sensitivity increases diminish at higher magnetic field strengths (Fig. S12). We show that FETRIS is effective for 19F MRI using conventional MRI pulse sequences.
Gd3+ and Fe3+ are at the heart of T1- and T2-based 1H contrast agents, respectively, but for 19F MRI, the roles of these metal ions are reversed. Fe3+ was the optimal T1 enhancer for perfluorocarbons, while analogous gadolinium (and manganese) chelates caused severe line broadening, essentially becoming 19F T2 agents. Paramagnetic relaxation enhancement has been previously applied to 19F nuclei7, 20, 24, 25. 19F MR probes based on macrocyclic lanthanide complexes with fluorinated substituents has been described7, 20. However, these paramagnetic 19F tracers are not ideal for cell detection purposes. The relatively low 19F content of osmotically active macrocyclic chelates makes it difficult to reach MR-detectable cell loadings compared to highly-fluorinated PFC oils. In other approaches, Gd macrocyclic chelates bound to nanoemulsion surface can be used to provide a modest enhancement of 19F T1, but these are unstable in the intracellular milieu, especially if they traffic to low pH compartments28, which tends to separate the chelate from nanoemulsion droplet, thereby limiting long-term enhancement. In contrast, FETRIS complexes are characterized by very small rates of metal leakage even in the presence of EDTA in vitro and after cell labelling. The toxicity testing of FETRIS as reported here is viewed as preliminary; more rigorous in vitro cell studies, as well as animal testing, are needed to determine potential suitability for clinical trials. We note that emerging 1H MRI techniques like PARACEST26 and highly shifted proton MRI27 have shown promise to detect multiple cell populations on standard MRI instrumentation with high specificity.
Overall, 19F MRI cell detection using PFC tracer agents is a rapidly emerging alternative to 1H-based approaches using metal-ion-based contrast agents. The technical barriers associated with implementation of 19F MRI on a clinical scanner are surmountable, and clinical 19F cell detection has recently been demonstrated5. Future improvements in sensitivity of the probes will only accelerate adoption of this technology and open up new uses for this technology; towards this goal, the excellent stability and unique magnetic properties of FETRIS should advance this field.
Methods
Emulsion preparation
The fluorocarbon oil blends were prepared from PFPE, PFPE-DEA (Exfluor, Round Rock, TX), PFOB (Acros, Pittsburgh, PA), and pAn-FDK (see SI, Supplementary Methods for synthetic procedures) agents. Proportions (Fig. 2) were prepared gravimetrically in a 15 or 50 mL conical Falcon tube (Corning). Per 1 gram of PFC blend, 0.5 mL aqueous solution of Pluronic F68 (100 g/L) was added, and the mixture was vortexed at the highest speed. Water (8.5 mL) was added, followed by brief vortexing and ultrasonication (Omni Ruptor 250W, 30% power, 2 minutes, Omni International, Kennesaw, GA). The crude emulsion thus obtained was passed 4–6 times through LV1 microfluidizer (Microfluidics, Westwood, MA) operating at 20,000 psi and filtered through a 0.2 µm Supor membrane (Pall Corp. #4187, Port Washington, NY) into sterile glass vials.
NMR measurements
NMR spectra were obtained on Magritek Spinsolve (1.0 T), Bruker Avance 300 (7.0 T), Bruker Ascend 400 (9.4 T), Jeol ACA 500 (11.7 T), and Bruker DRX-600 (14.1 T) instruments. 19F NMR spectra of aqueous nanoemulsions were referenced to an internal standard (0.1 wt.% CF3CO2Na/D2O, −76.00 ppm), which served as integration reference for quantitative NMR (see SI). Relaxation measurements were performed using a standard inversion recovery (with TI from 3−2 to 39 ms) pulse sequence and a Carr-Purcell-Meiboom-Gill sequence with TE values in 12 linear increments. R1 and R2 were obtained by non-linear fitting in MNova 6.0.2 software (Mestrelab, Escondido, CA). Fit errors were less than 5% for R1 and 10% for R2.
Cell labeling
Rat 9L or mouse GL261 glioma cells (3–5×10⁶, ATCC, Manassas, VA) were plated in 10 cm dishes and allowed to attach overnight. Immediately before cell labeling, FDK (B or D) or control (C or E) emulsion (0.5 mL) was mixed with freshly prepared FeCl3 (50 mM in H2O, 0.12 mL), protamine sulfate (1% in H2O, 0.02 mL), and Tris base (1 M in H2O, 0.25 mL). The dark-orange liquid was diluted to the desired PFPE content with DMEM (9L) or RPMI-1640 (GL261) media supplemented with 10% (v/v) fetal bovine serum (FBS). Labeling medium was added to cells at 5 mL/dish. After 16 h incubation at 37 °C, the cell labeling medium was removed, and cells were washed three times with phosphate buffered saline (PBS), detached by trypsinization, washed again in PBS, and resuspended in 1 mL of PBS. A portion of the cell suspension (~1/10) was used for cell number estimates by Cell Titer Glo (Promega, Madison, WI) or using a Countess II FL Cell Counter (Life Technologies, Carlsbad, CA). To assay nanoemulsion uptake, cells were pelleted and resuspended in 0.1 mL of lysis solution (0.5% Triton X, 100 mM NaCl, 20 mM Tris). A portion of this solution (6 µL) was used for absorbance measurements on NanoDrop 2000 spectrophotometer (Thermo Scientific, Pittsburgh, PA). The remainder was transferred to a 5 mm NMR tube, mixed with 0.15 mL of 0.1 wt.% CF3CO2Na/D2O reference compound and 19F NMR spectra were obtained to measure 19F uptake, as previously described29.
MRI
A phantom sample was prepared using 5 mm NMR tubes containing FETRIS (4.5 g/L 19F, 0.5 mM Fe3+, R1/R2 = 32.5/170 s−1) and nanoemulsion without metal (R1/R2 = 2.2/3.7 s−1); tubes were embedded in agarose. All images were acquired using a Bruker 11.7T BioSpec using a 19F/1H double tuned volume coil. For 19F, a gradient echo (GRE) pulse sequence was used with parameters: TR/TE=15/0.83 ms (TR=recovery time), NA=256 (NA=number of averages), FOV=4×4 cm (FOV=field of view), 64×64 matrix, 8 mm thick slices, and a ~4 min data acquisition time. In this image, the echo time (TE) parameter was minimized to 0.83 ms, but at this value there is a residual amount of signal attenuation from T2-effects in the FETRIS material (estimated ~12%). We used the Ernst angle condition9 for optimal 19F imaging of the FETRIS phantom. For 1H, the GRE parameters were TR/TE=150/2 ms, NA=8, FOV=4×4 cm, 256×256 matrix, and 2 mm slices. The 19F image data was rendered in hot-iron pseudo-color using ImageJ software (NIH) and overlaid onto the grayscale 1H image. For in vivo mouse studies, mouse GL261 glioma cells were labeled with FETRIS nanoemulsion (50 wt.% pAn-FDK, 50 wt.% PFPE) ex vivo to a level of ~1012 19F/cell. A second batch of cells was similarly labeled but with unmetalated nanoemulsion. Cells (5×10⁶ per side) were injected subcutaneously into flanks in female syngeneic C57BL/6 mice (8–10 weeks old, N=3) using a vehicle of 0.2 ml Matrigel (BD Biosciences, Franklin Lakes, NJ) in PBS. The FETRIS labeled cells, and cells labeled with unmetalated nanoemulsion, were injected into the right and left sides, respectively. After 24 hours, mice were imaged using a three-dimensional ZTE sequence with parameters TR= 4 ms, receiver bandwidth 40 kHz, acquisition window 0.8 ms, number of projections 13030, NA=26, acquisition time 23 min, FOV=6×6×6 cm, and matrix size 64×64×64. Proton data were acquired using a two-dimensional spin-echo sequence with TR/TE=1500/14 ms, FOV=6×6 cm, and 256×256 matrix. 19F data were imported into Amira software (FEI, Hillsboro, OR) and rendered in color and a grayscale slice from the 1H data was embedded for anatomical display purposes.
Supplementary Material
Acknowledgments
This work was funded by the National Institutes of Health grants T32-CA121938 (UCSD Cancer Therapeutics Training Program, A.A.K.), R01-CA158448 (R.Y.T.), R01-EB017271 (E.T.A.), Radiological Society of North America grant RR1452 (K.H.N), and the California Institute for Regenerative Medicine grant LA1-C12-06919 (E.T.A.). We thank Mr. Toan C. Nguyen, Dr. Michael J. Patrick, Prof. Alan Waggoner, Dr. Anthony Mrse, Dr. Tatiana Didenko, Dr. Patrick McConville and Prof. Kurt Wuthrich for technical assistance, and Ms. Veronica Kislukhin for helpful discussions.
Footnotes
- A.A.K. designed synthesis schemes, performed chemical synthesis of the molecules and emulsions, characterized synthesis products, and wrote first draft of manuscript.
- H.X. performed tissue culture experiments.
- S.R.A. helped designed experiments, performed chemical synthesis, and helped edit manuscript.
- K.N. assisted with the in vivo animal experiments and MRI renderings and helped edit manuscript.
- R.Y.T. helped design experiments and edit manuscript.
- E.T.A. helped design experiments, acquired MRI data in phantoms and in mice, edited final version of manuscript.
Competing Financial Interests
None
References
- 1.Ahrens ET, Bulte JWM. Tracking immune cells in vivo using magnetic resonance imaging. Nat Rev Immunol. 2013;13:755–763. doi: 10.1038/nri3531. [DOI] [PMC free article] [PubMed] [Google Scholar]
- 2.Ahrens ET, Flores R, Xu HY, Morel PA. In vivo imaging platform for tracking immunotherapeutic cells. Nat Biotechnol. 2005;23:983–987. doi: 10.1038/nbt1121. [DOI] [PubMed] [Google Scholar]
- 3.Srinivas M, Morel PA, Ernst LA, Laidlaw DH, Ahrens ET. Fluorine-19 MRI for visualization and quantification of cell migration in a diabetes model. Magn Reson Med. 2007;58:725–734. doi: 10.1002/mrm.21352. [DOI] [PubMed] [Google Scholar]
- 4.Srinivas M, et al. In vivo cytometry of antigen-specific T cells using 19F MRI. Magn Reson Med. 2009;62:747–753. doi: 10.1002/mrm.22063. [DOI] [PMC free article] [PubMed] [Google Scholar]
- 5.Ahrens ET, Helfer BM, O'Hanlon CF, Schirda C. Clinical cell therapy imaging using a perfluorocarbon tracer and fluorine-19 MRI. Magn Reson Med. 2014;72:1696–1701. doi: 10.1002/mrm.25454. [DOI] [PMC free article] [PubMed] [Google Scholar]
- 6.Neubauer AM, et al. Gadolinium-modulated F-19 signals from perfluorocarbon nanoparticles as a new strategy for molecular imaging. Magn Reson Med. 2008;60:1066–1072. doi: 10.1002/mrm.21750. [DOI] [PMC free article] [PubMed] [Google Scholar]
- 7.Schmid F, Höltke C, Parker D, Faber C. Boosting 19F MRI—SNR efficient detection of paramagnetic contrast agents using ultrafast sequences. Magn Reson Med. 2013;69:1056–1062. doi: 10.1002/mrm.24341. [DOI] [PubMed] [Google Scholar]
- 8.de Vries A, et al. Relaxometric studies of gadolinium-functionalized perfluorocarbon nanoparticles for MR imaging. Contrast Media Mol I. 2014;9:83–91. doi: 10.1002/cmmi.1541. [DOI] [PubMed] [Google Scholar]
- 9.Brown RW, Cheng YCN, Haacke EM, Thompson MR, Venkatesan R. Magnetic Resonance Imaging: Physical Prinicples and Sequence Design. 2nd. Hoboken, NJ: John Wiley & Sons; 2014. Edn. [Google Scholar]
- 10.Hu L, Zhang L, Chen J, Lanza GM, Wickline SA. Diffusional mechanisms augment the fluorine MR relaxation in paramagnetic perfluorocarbon nanoparticles that provides a "relaxation switch” for detecting cellular endosomal activation. J Magn Reson Imaging. 2011;34:653–661. doi: 10.1002/jmri.22656. [DOI] [PMC free article] [PubMed] [Google Scholar]
- 11.Solomon I. Relaxation processes in a system of two spins. Phys Rev. 1955;99:559–565. [Google Scholar]
- 12.Bloembergen N, Morgan LO. Proton relaxation times in paramagnetic solutions. Effects of electron spin relaxation. J Chem Phys. 1961;34:842–850. [Google Scholar]
- 13.Marchionni G, Ajroldi G, Righetti MC, Pezzin G. Molecular interactions in perfluorinated and hydrogenated compounds: Linear paraffins and ethers. Macromolecules. 1993;26:1751–1757. [Google Scholar]
- 14.Lai C-Z, Reardon ME, Boswell PG, Bühlmann P. Cation-coordinating properties of perfluoro-15-crown-5. J Fluor Chem. 2010;131:42–46. doi: 10.1016/j.jfluchem.2009.09.019. [DOI] [PMC free article] [PubMed] [Google Scholar]
- 15.Shibata S, Onuma S, Inoue H. Crystal and molecular structure of trimeric bis(acetylacetonato)manganese(II) Inorg Chem. 1985;24:1723–1725. [Google Scholar]
- 16.Binnemans K. In: Handbook on the Physics and Chemistry of Rare Earths. Karl J-CGB, Gschneidner A, Vitalij KP, editors. Vol. 35. Elsevier; 2005. pp. 107–272. [Google Scholar]
- 17.Barkley LB, Levine R. The synthesis of certain ketones and α-substituted β-diketones containing perfluoroalkyl groups. J Am Chem Soc. 1953;75:2059–2063. [Google Scholar]
- 18.Janjic JM, Ahrens ET. Fluorine-containing nanoemulsions for MRI cell tracking. Wiley Interdisciplinary Reviews. Nanomedicine and Nanobiotechnology. 2009;1:492–501. doi: 10.1002/wnan.35. [DOI] [PMC free article] [PubMed] [Google Scholar]
- 19.Lintvedt RL, Kernitsky LK. Ligand field information from charge-transfer spectra of substituted tris(1,3-diketonato)iron(III) chelates. Spectrochemical series for 1,3-diketones. Inorg Chem. 1970;9:491–494. [Google Scholar]
- 20.Funk AM, Fries PH, Harvey P, Kenwright AM, Parker D. Experimental measurement and theoretical assessment of fast lanthanide electronic relaxation in solution with four series of isostructural complexes. J Phys Chem A. 2013;117:905–917. doi: 10.1021/jp311273x. [DOI] [PubMed] [Google Scholar]
- 21.Nash KL, Brigham D, Shehee TC, Martin A. The kinetics of lanthanide complexation by EDTA and DTPA in lactate media. Dalton T. 2012;41:14547–14556. doi: 10.1039/c2dt31851b. [DOI] [PubMed] [Google Scholar]
- 22.Sanders JKM, Hanson SW, Williams DH. Paramagnetic shift reagents. Nature of the interactions. J Am Chem Soc. 1972;94:5325–5335. [Google Scholar]
- 23.Lo JC, Gui J, Yabe Y, Pan C-M, Baran PS. Functionalized olefin cross-coupling to construct carbon–carbon bonds. Nature. 2014;516:343–348. doi: 10.1038/nature14006. [DOI] [PMC free article] [PubMed] [Google Scholar]
- 24.Harvey P, Kuprov I, Parker D. Lanthanide complexes as paramagnetic probes for 19F magnetic resonance. Eur J Inorg Chem. 2012:2015–2022. [Google Scholar]
- 25.De Luca E, et al. Characterisation and evaluation of paramagnetic fluorine labelled glycol chitosan conjugates for F-19 and H-1 magnetic resonance imaging. J Biol Inorg Chem. 2014;19:215–227. doi: 10.1007/s00775-013-1028-y. [DOI] [PubMed] [Google Scholar]
- 26.Ferrauto G, Castelli DD, Terreno E, Aime S. In vivo MRI visualization of different cell populations labeled with PARACEST agents. Magn Reson Med. 2013;69:1703–1711. doi: 10.1002/mrm.24411. [DOI] [PubMed] [Google Scholar]
- 27.Schmidt R, et al. Highly shifted proton MR imaging: Cell tracking by using direct detection of paramagnetic compounds. Radiology. 2014;272:785–795. doi: 10.1148/radiol.14132056. [DOI] [PubMed] [Google Scholar]
- 28.Kok MB, et al. Quantitative H-1 MRI, F-19 MRI, and F-19 MRS of cell-internalized perfluorocarbon paramagnetic nanoparticles. Contrast Media Mol Imaging. 2011;6:19–27. doi: 10.1002/cmmi.398. [DOI] [PubMed] [Google Scholar]
References
- 29.Janjic JM, Srinivas M, Kadayakkara DKK, Ahrens ET. Self-delivering nanoemulsions for dual fluorine-19 MRI and fluorescence detection. J Am Chem Soc. 2008;130:2832–2841. doi: 10.1021/ja077388j. [DOI] [PubMed] [Google Scholar]
Associated Data
This section collects any data citations, data availability statements, or supplementary materials included in this article.


