

Abstract
Social impairments in autism spectrum disorder (ASD), a hallmark feature of its diagnosis, may underlie specific neural signatures that can aid in differentiating between those with and without ASD. To assess common and consistent patterns of differences in brain responses underlying social cognition in ASD, this study applied an activation likelihood estimation (ALE) meta‐analysis to results from 50 neuroimaging studies of social cognition in children and adults with ASD. In addition, the group ALE clusters of activation obtained from this was used as a social brain mask to perform surface‐based cortical morphometry (SBM) in an empirical structural MRI dataset collected from 55 ASD and 60 typically developing (TD) control participants. Overall, the ALE meta‐analysis revealed consistent differences in activation in the posterior superior temporal sulcus at the temporoparietal junction, middle frontal gyrus, fusiform face area (FFA), inferior frontal gyrus (IFG), amygdala, insula, and cingulate cortex between ASD and TD individuals. SBM analysis showed alterations in the thickness, volume, and surface area in individuals with ASD in STS, insula, and FFA. Increased cortical thickness was found in individuals with ASD, the IFG. The results of this study provide functional and anatomical bases of social cognition abnormalities in ASD by identifying common signatures from a large pool of neuroimaging studies. These findings provide new insights into the quest for a neuroimaging‐based marker for ASD. Hum Brain Mapp 37:3957–3978, 2016. © 2016 Wiley Periodicals, Inc.
Keywords: activation likelihood estimation, social cognition, social brain, meta‐analysis, autism, neuroimaging, brain
Abbreviations
- ACC
anterior cingulate cortex
- FFA
fusiform face area
- IPL
inferior parietal lobule
- ITG
inferior temporal gyrus
- IFG
inferior frontal gyrus
- MPFC
medial prefrontal cortex
- MFG
middle frontal gyrus
- MTG
middle temporal gyrus
- MNS
mirror neuron system
- OFC
orbitofrontal cortex
- PCC
posterior cingulate cortex
- pSTS
posterior superior temporal sulcus
- STG/STS
superior temporal gyrus/sulcus
- TPJ
temporoparietal junction
- vmPFC
ventromedial prefrontal cortex
INTRODUCTION
Social cognition has been defined as the way in which people make sense of other people and themselves [Fiske and Taylor, 1991] and the ability to construct representations of the relation between oneself and others and to use those representations flexibly to guide social behavior [Adolphs, 2001]. Limited ability in social cognition in individuals with autism spectrum disorder (ASD) often result in poor social interaction. Recent neurobiological investigations involving human neuroimaging techniques have suggested several potential neural markers for ASD, primarily involving brain areas underlying social cognition. For example, atypical functional activation of the fusiform face area (FFA) [Spencer et al., 2011], superior temporal sulcus (STS) [Kaiser et al., 2010], amygdala [Baron‐Cohen et al., 2000], and disrupted connectivity of the theory‐of‐mind (ToM) network [Deshpande et al., 2013; Kana et al., 2014] have been implicated as markers of ASD. These areas are considered part of the social brain, which comprises a network of regions that include the medial prefrontal cortex (MPFC), orbitofrontal cortex (OFC), anterior cingulate cortex (ACC), amygdala (AMY), temporoparietal junction (TPJ), inferior frontal gyrus (IFG), Extrastriate Body Area (EBA), STS, and FFA [Blakemore et al., 2007; Brothers, 1990; Easton and Emery, 2004; Frith and Frith, 2008; Kennedy and Adolphs, 2012; Pelphrey and Carter, 2008]. The social brain areas mediate different social functions, such as joint attention, reading intentions, detecting agency, perceiving emotions, and processing faces which are all critical in navigating the social world. There is emerging evidence that the anatomy, functional activation, and connectivity of the social brain areas are altered in individuals with autism [Gotts et al., 2012; Kennedy and Adolphs, 2012; Pelphrey et al., 2011].
Among the relatively large number of functional neuroimaging studies of autism, many have focused primarily on individual social processes (e.g., face processing, biological motion, or theory‐of‐mind). Prior literature has suggested brain areas underlying social cognition to be potential candidates for a neuroendophenotype of ASD [Chiu et al., 2008; Kaiser et al., 2010; Spencer et al., 2011]. Chiu et al. [2008] found that cingulate response during a neuroeconomic social exchange task was related to ASD symptom severity. Kaiser et al. [2010] proposed the STS as a potential neuroendophenotype of autism based on their findings of differential state‐ and trait‐related activation in STS during biological motion perception across children with ASD, their unaffected siblings, and TD children. In a similar study, Spencer et al. [2011] found that unaffected siblings and individuals with ASD demonstrated similar activity in FFA during a facial expression task, suggesting it to be a neuroendophenotype that captures both autism and the broader autism phenotype. In a recent study from our group, Deshpande et al. [2013] found that effective connectivity of the ToM network was able to successfully classify the participants into ASD and TD groups with about 95% accuracy. Further, studies using voxel‐based morphology (VBM) and diffusion tensor imaging (DTI) have provided support for alterations in cortical anatomy in social brain areas [Cauda et al., 2011a, 2014]. Thus, emerging evidence from diverse neuroimaging studies point to several social brain areas as potential candidates for neural markers of ASD. Nevertheless, within the social brain, there has not been an overwhelming consensus on a specific region or network that may serve as the “best” candidate. Identifying neural signatures is critical to understanding the biological differences between individuals with and without ASD. Such markers can lead to better, more accurate, and early diagnosis of ASD, and can help design targeted intervention for individuals with ASD. As difficulties with social cognition and social behavior are pervasive throughout the autism spectrum, integrating inferences from numerous studies of social cognition in ASD gives the ideal vantage point to probe valid, common, and consistent neural signatures.
While there are several meta‐analyses of social cognition in healthy individuals [Schilbach et al., 2012], there have been fewer attempts to consolidate the widespread and growing body of neuroimaging literature on social brain in autism. Using ALE meta‐analysis on 24 studies of social cognition, DiMartino et al. [2009] found that the ASD participants demonstrated a greater likelihood of hypoactivation in the ACC and anterior insula. A more recent meta‐analysis conducted by Sugranyes et al. [2011] analyzed 12 papers that compared ASD and control groups on standardized facial emotion recognition (n = 5) or ToM (n = 7) paradigms. For these two paradigms, the meta‐analysis indicated hypoactivation of MPFC, amygdala and STS in ASD group primarily during ToM tasks. Developmental approaches to ALE have also been effectively utilized to identify social and nonsocial functional difference (i.e., fronto‐temporal structures in particular) in children with ASD, relative to adults [Dickstein et al., 2013]. Notably, the number of papers, subjects, and foci used for the meta‐analysis were significantly less in these studies by only including two social cognition paradigms. However, despite these limitations, similar findings have emerged across these studies both in terms of hypoactivation of ASD in ACC, anterior insula [Dimartino et al., 2009], MPFC, amygdala, and STS [Sugranyes et al., 2011]. The consistent presence of some of these regions highlight dysfunction within regions of the social brain in individuals with ASD [Cauda et al., 2011b, 2014; DeRamus and Kana, 2014; Libero et al., 2014]. It is important to consider, however, that there have been a large number of studies suggesting that individuals with ASD differentially process, or at the very least have different BOLD activity in response to human faces in tasks involving face processing [Dalton et al., 2005b; Kleinhans et al., 2008; Pierce et al., 2001]. The number of face‐processing studies of autism outweighs that of other topics of social cognition, perhaps underscoring the importance of this construct. The goal of this study is to comprehensively characterize the social brain abnormalities in autism at functional and anatomical levels by examining the emerging patterns across a large number of neuroimaging studies of social cognition in ASD. As such, this study of activation likelihood estimation (ALE) meta‐analysis includes 50 peer‐reviewed publications consisting of 675 participants with ASD, 695 TD individuals, and used a total of 1,843 foci of brain activity.
While dysfunction of the social brain in ASD has been demonstrated by many fMRI studies, a few studies have also examined the anatomical bases of such abnormalities. VBM data have suggested that structural alterations are within social brain areas in individuals with ASD, including the prefrontal cortex, amygdala, insula, and cingulate [Cauda et al., 2011a, 2014; DeRamus and Kana, 2014]. Meta‐analyses of VBM studies reported smaller grey matter (GM) volumes in ASD in the temporal lobe, MPFC, amygdala/hippocampus, and precuneus [Duerden et al., 2012; Nickl‐Jockschat et al., 2012; Stanfield et al., 2008]. Same studies have also found larger GM volumes in the lateral prefrontal cortex and temporo‐occipital regions. A recent study reported smaller local GM volumes in ASD compared to TD participants in the bilateral amygdala, left anterior insula and MPFC [Radeloff et al., 2014]. Considering these anatomical abnormalities in autism, the present study applied the social brain regions (found from meta‐analysis) to test anatomical integrity (cortical thickness, volume, and surface area) in an empirical dataset of 115 participants (55 ASD and 60 TD). This provides a valuable and novel dimension, of relating function to structure, to the present ALE‐based meta‐analysis. Thus, the findings of this study will provide important insights into the function and anatomy of the social brain in autism.
METHODS
Meta‐Analysis
This meta‐analysis adhered to the Preferred Reporting Items for Systematic Reviews and Meta‐Analyses (PRISMA) Statement guidelines (http://www.prisma-statement.org/). The search method for published studies and inclusion criteria were specified in advance. Studies included in this meta‐analysis investigated social cognition in participants with ASD and in TD control participants. Paradigms related to social cognition in this study are any neuroimaging experiments involving tasks that focus on processing information about the faces, bodies, feelings, thoughts, motions, and emotions of other humans (e.g., viewing stimuli made up of human faces or bodies, asking to make a judgment about another person's thoughts; see Fig. 1 for examples). Peer‐reviewed and published scientific papers were identified through a computerized literature search using Google Scholar ( http://scholar.google.com /), Sleuth ( http://brainmap.org/sleuth/readme.html ), PubMed ( http://www.ncbi.nlm.nih.gov/pubmed ), and ScienceDirect ( http://www.sciencedirect.com /). We reviewed all functional neuroimaging papers published in English through the year 2014. The publications ranged from year 1992 to 2014. The following key words were used for search: “autism,” “social,” “cognition,” “fMRI,” “brain,” “face,” “emotion,” “theory of mind,” “empathy,” “biological motion,” “agency,” “close other,” “self‐reference,” their combinations and differing terminations. The data included in the meta‐analysis was conducted on prior published studies from other research groups, and necessary data (i.e., foci of brain activation) were publicly available, IRB approval from our institution was not obtained. Instead, it is assumed that each individual study abided by high ethical standards and obtained IRB approval prior to conducting data collection at their institutions.
Figure 1.
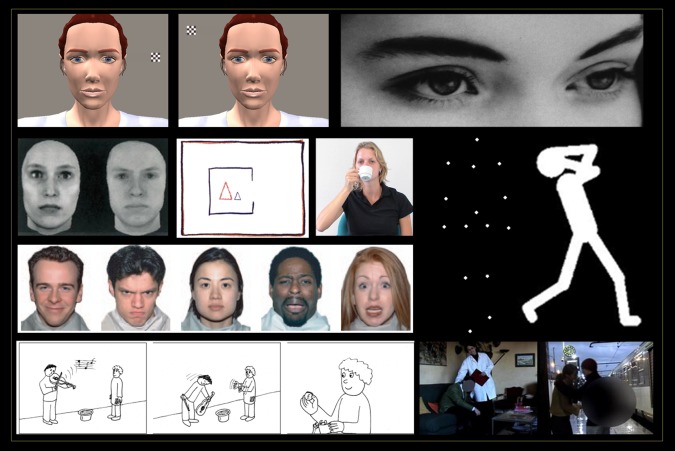
Examples of social cognition tasks used in studies included in the meta‐analysis. [Color figure can be viewed at http://wileyonlinelibrary.com.]
To meet our inclusion criteria, studies were required to (1) have both ASD and TD participants, (2) utilize fMRI or PET imaging, (3) use whole‐brain image subtraction to identify clusters of significant task‐related brain activations across groups and conditions, and (4) report results in standard stereotactic coordinates. Studies that did not meet these criteria were excluded from the analysis. Seventy‐five functional imaging articles on autism were retrieved initially, 50 of which met our inclusion criteria. Notably, authors who did not report stereotactic coordinates in their paper were contacted by email, and coordinates were included when provided by the author. We also acknowledge that there may be coordinates that were not included due to publication bias. See Table 1 for an exclusive list of studies. The number of participants totaled 675 (53 female) ASD subjects and 695 (56 female) TD subjects. Papers included child, adolescent, and adult participants with ASD (overall mean age: 21.7 years) and their TD peers (overall mean age: 21.3 years).
Table 1.
Characteristics of the studies included in the meta‐analysis
| Article | Imaging | ASD | TD | Type of Task | Contrast(s)/task(s) | ||||
|---|---|---|---|---|---|---|---|---|---|
| Modality | n | n M/F | Mean age | n | n M/F | Mean age | |||
| Ashwin et al. [2007] | fMRI | 13 | 13/0 | 31.2 | 13 | 13/0 | 25.6 | Face processing | Faces > scrambled |
| Baron‐Cohen et al. [1999] | fMRI | 6 | 4/2 | 26.3 | 12 | 6/6 | 25.5 | Theory‐of‐mind | ToM |
| Bastiaansen et al. [2011] | fMRI | 21 | 21/0 | 30.6 | 21 | 21/0 | 30.5 | Face processing | Emotional faces |
| Bird et al. [2006] | fMRI | 16 | 14/2 | 33.3 | 16 | 14/2 | 35.3 | Face processing | Faces > houses; attended faces > unattended faces |
| Bookheimer et al. [2008] | fMRI | 12 | 12/0 | 11.3 | 12 | 12/0 | 11.9 | Face processing | Upright faces > forms |
| Brandenburg‐Goddard et al. [2014] | fMRI | 17 | 17/0 | 12.4 | 19 | 19/0 | 12.0 | Face processing | Face matching > object matching; face labeling > face matching |
| Carter et al. [2012] | fMRI | 12 | 9/3 | 13.8 | 13 | 11/2 | 11.46 | Social judgment | Social > fixation; social > physical |
| Castelli et al. [2002] | PET | 10 | 10/0 | 33 | 10 | 10/0 | 25 | Theory‐of‐mind | ToM animations > Rd animations |
| Chiu et al. [2008] | fMRI | 12 | 12/0 | 16.5 | 18 | 18/0 | 14.9 | Self‐response | Self‐response in exchange game |
| Colich et al. [2012] | fMRI | 16 | 14/2 | 14.27 | 16 | 14/2 | 13.15 | Social orienting | Sincere > rest; ironic > rest |
| Corbett et al. [2009] | fMRI | 12 | 12/0 | 9.01 | 15 | 13/2 | 9.17 | Emotion processing | Emotion > control; person > control |
| Critchley et al. [2000] | fMRI | 9 | 9/0 | 37 | 9 | 9/0 | 27 | Face processing | Faces |
| Dalton et al. [2007] | fMRI | 12 | 8/4 | 14.4 | 12 | 10/2 | 14.16 | Face processing | Faces |
| Dalton et al. [2005] | fMRI | 14 | 14/0 | 15.9 | 12 | 12/0 | 17.1 | Emotion processing | Emotional faces |
| Dapretto et al. [2006] | fMRI | 10 | 9/1 | 12.05 | 10 | 9/1 | 12.38 | Imitation | Imitation of emotional expressions; observation of emotional expressions |
| Davies et al. [2011] | fMRI | 14 | 12/2 | 11.69 | 14 | 12/2 | 12.3 | Gaze processing | Direct gaze > null; averted gaze > null |
| Deeley et al. [2007] | fMRI | 9 | 9/0 | 34 | 9 | 9/0 | 27 | Emotion processing | Intense sadness > fixation; neutral faces > fixation; intense fear > fixation; intense disgust > fixation; intense happiness > fixation |
| Dichter et al. [2007] | fMRI | 17 | 16/1 | 22.9 | 15 | 14/1 | 24.6 | Gaze processing | Gaze |
| Freitag et al. [2008] | fMRI | 15 | 13/2 | 17.5 | 15 | 13/2 | 18.6 | Biological motion | Biological motion > scrambled motion; |
| Gebauer et al. [2014] | fMRI | 19 | 17/2 | 26.2 | 20 | 18/2 | 24.5 | Emotional music | Happy music > sad music |
| Gervais et al. [2004] | fMRI | 5 | 5/0 | 25.8 | 8 | 8/0 | 27.1 | Voice processing | Voice > nonvoice; voice > silence |
| Greimel et al. [2010] | fMRI | 15 | 15/0 | 14.9 | 15 | 15/0 | 15 | Self/other | Other > baseline; self > baseline |
| Hadjikhani et al. [2009] | fMRI | 12 | 9/3 | 30 | 7 | 4/3 | 34 | Emotion processing | Fear > neutral |
| Hall et al. [2003] | PET | 8 | 8/0 | 20‐33 | 8 | 8/0 | 20‐33 | Emotion processing | Emotions; emotion processing |
| Happe et al. [1996] | PET | 5 | 5/0 | 24 | 6 | 6/0 | 38 | Theory‐of‐mind | ToM |
| Hubl et al. [2003] | fMRI | 10 | 10/0 | 27.7 | 10 | 10/0 | 25.3 | Face processing | Face processing |
| Kana et al. [2012] | fMRI | 15 | 15/0 | 21.14 | 15 | 15/0 | 22.28 | Theory‐of‐mind | Intention causality > physical |
| Kana et al. [2009] | fMRI | 12 | 10/2 | 24.6 | 12 | 12/0 | 24.4 | Theory‐of‐mind | ToM > random |
| Kennedy et al. [2008] | fMRI | 13 | 13/0 | 26.9 | 12 | 12/0 | 27.5 | Theory‐of‐mind | ToM; internal > external; external > internal; mental > math; other > self |
| Kleinhans [2009] | fMRI | 19 | 18/1 | 21.9 | 20 | 20/0 | 24.7 | Face processing | Faces > fixation 1; faces > fixation 2; faces > fixation time 1 > 2 |
| Knaus et al. [2008] | fMRI | 12 | 12/0 | 15.46 | 12 | 12/0 | 14.94 | Response naming | Response naming vs visual processing |
| Koshino et al. [2008] | fMRI | 11 | 11/0 | 24.5 | 11 | 10/1 | 28.7 | Face processing | Faces memory; working memory vs baseline |
| Lombardo et al. [2010] | fMRI | 29 | 29/0 | 26.59 | 33 | 33/0 | 27.97 | Self/other | Self vs other; self‐mentalizing vs self‐physical > other‐mentalizing vs other‐physical |
| Martineau et al. [2010] | fMRI | 7 | 7/0 | 23 | 8 | 8/0 | 23.25 | Imitation | Execution > rest; observation > rest |
| Morita et al. [2012] | fMRI | 15 | 14/1 | 23.7 | 14 | 12/2 | 23.3 | Self/other | Self vs other |
| Pelphrey et al. [2005] | fMRI | 10 | 9/1 | 23.2 | 9 | 8/1 | 23.4 | Gaze processing | Incongruent > congruent; |
| Pelphrey et al. [2007] | fMRI | 8 | 6/2 | 24.5 | 8 | 6/2 | 24.1 | Emotion processing | Emotion faces; dynamic emotions |
| Pfeifer et al. [2012] | fMRI | 18 | 17/1 | 14.9 | 18 | 17/1 | 13.3 | Self/other | Self > other |
| Pierce et al. [2004] | fMRI | 8 | 8/0 | 27.1 | 10 | 10/0 | 16‐40 | Face processing | Familiar faces; familiar face > stranger face; stranger face |
| Pinkham et al. [2008] | fMRI | 12 | 12/0 | 24.08 | 12 | 12/0 | 27.08 | Face/social judgment | Trustworthiness; trust judgment of faces; age judgment of faces |
| Pitskel et al. [2011] | fMRI | 15 | 15/0 | 23.4 | 14 | 13/1 | 24.2 | Gaze processing | Direct > averted gaze; averted > direct gaze |
| Redcay et al. [2012] | fMRI | 16 | 13/3 | 28.3 | 16 | 13/3 | 22.1 | Joint attention | Joint attention; response to joint attention > solo attention |
| Schneider et al. [2012] | fMRI | 28 | 16/12 | 31.39 | 28 | 16/12 | 31.29 | Morality | Moral vs baseline; social‐ethical dilemma vs baseline; individual gain moral dilemma; individual gain vs social‐ethical dilemma |
| Silani et al. [2008] | fMRI | 15 | 13/2 | 36.6 | 15 | 13/2 | 33.7 | Emotion processing | Emotional vs neutral; internally vs externally oriented; emotional (unpleasant) > neutral stimuli; internal > external |
| Uddin et al. [2008] | fMRI | 12 | 12/0 | 13.19 | 12 | 12/0 | 12.23 | Self/other | Self > rest; other > rest |
| Vaidya et al. [2011] | fMRI | 15 | 11/4 | 10.78 | 18 | 14/4 | 10.96 | Gaze processing | Incongruent > congruent; congruent > neutral |
| Wang et al. [2004] | fMRI | 12 | 12/0 | 12.2 | 12 | 12/0 | 11.8 | Emotion processing | Matched emotions vs control; label emotions vs control |
| Wang et al. [2006] | fMRI | 18 | 18/0 | 11.9 | 18 | 18/0 | 11.9 | Irony | Irony vs no irony; event knowledge only + prosodic cue vs rest; event knowledge only; prosody only |
| Wang et al. [2007] | fMRI | 18 | 18/0 | 12.4 | 18 | 18/0 | 11.8 | Irony | Irony vs no irony |
| Williams et al. [2006] | fMRI | 16 | 16/0 | 15.4 | 15 | 15/0 | 15.5 | Imitation | Imitation vs rest; imitation vs cue execution; imitation vs observation; imitation vs rest; imitation vs cue execution |
Note. ToM = theory of mind; Rd animations = animations of randomly moving shapes.
In addition to the number of participants and task descriptions, the local maxima of task‐related neural activity from each study were extracted and catalogued for the analysis. Task‐related neural activity from each study encompasses any statistically significant clusters of brain activation derived from social cognitive tasks reported in each of the included manuscripts. Foci resulting from the meta‐analysis were organized into tables for the various comparisons conducted. These comparisons were: (1) ASD + TD (within group), (2) TD (within‐group), (3) ASD (within‐group), (4) ASD > TD (between‐group), (5) TD > ASD (between‐group), (6) ASD‐TD (between‐group), and (7) TD‐ASD (between‐group). Foci included the ASD + TD, TD, and ASD analyses came from within‐group cluster tables for the social cognition task conditions reported in each included study. The foci included for the ASD > TD and TD > ASD between‐group comparisons came from between‐group cluster tables for the social cognition task conditions reported in each included study. Thus, the findings reported here emerged from within‐group foci as well as between‐group foci from 50 studies. In addition, since there is a relatively large number of face‐processing studies in autism, subanalyses were conducted on social tasks involving face processing and those that do not. Analyses of activation peaks were performed using activation likelihood estimation via GingerALE software developed by the Human Brain Mapping Project (ALE) [Eickhoff et al., 2012, 2011, 2009; Turkeltaub et al., 2012]. Social cognition task contrasts from individual studies were comprised of contrasts between social (e.g., faces, direct gaze) and nonsocial (e.g., fixation, neutral) conditions and within social conditions (e.g., ToM, emotional faces).
All coordinates were entered into GingerALE in Montreal Neurological Institute (MNI) space. Coordinates of activation foci from studies that were not originally in MNI format were transformed to MNI from Talairach space using the Lancaster transform (tal2icbm tool) in GingerALE [Laird et al., 2010]. ALE values were computed for every voxel in the brain, testing the null distribution (calculated from 1000 repetitions using a permutation analysis) of the ALE statistic for each voxel. For each study, peaks were selected based on subject grouping. For each group, the centroid of the significant cluster uses the foci with the shortest Euclidian distance from the center of the distribution in each group. ALE scores from the convergent MA maps were then calculated on a voxel‐by‐voxel basis to test for convergent (random‐effects) rather than study specific foci (fixed‐effects). Subject information (n subjects per study group) was used to calculate Full‐width Half‐maximum of the Gaussian function. We conducted meta‐analyses within‐group (using separate within ASD group and within TD group coordinates) and between‐group (using TD > ASD and ASD > TD cluster coordinates reported in each study). The Cluster‐level Inference Thresholding value for the ASD, TD, ASD > TD, and TD > ASD were .05 with a False Discovery Rate (FDR) pN‐based (no assumptions of correlations between data) cluster‐forming threshold of p < 0.05. The total number of permutations for each analysis was 1000. No other information (e.g., effect size, autism diagnosis, age, MRI field strength) was used in the calculation of the ALE statistic, and none of this information can be used in the algorithm.
Cortical Surface‐Based Morphology
Structural MRI data collected from 115 participants with ASD (n = 55; 49males/6 females; mean age = 18.2) and without ASD (n = 60; 55 males/5 females; mean age = 18.5years) were entered into a general linear model (GLM) assessing surface‐based cortical morphometry. Participants were aged 8–40 years (M = 18.43, SD = 6.80) and had IQs > 70. Anatomical scans were collected on a 3 T Siemens Allegra head‐only scanner (Siemens Medical Inc., Erlangen, Germany) using high‐resolution T1‐weighted images using a 160 slice 3D MPRAGE volume scan with a repetition time (TR) = 200 ms, echo time (TE) = 3.34 ms, flip angle = 12°, field of view (FOV) = 25.6, 256 × 256 matrix size, and 1 mm slice thickness. The included 3D volumes were the remaining images following visual examination by three researchers independently to confirm data quality, and exclude images with significant distortion due to head motion or scanner artifact [Libero et al., 2014]. Scans were segmented using the standard Freesurfer™ [Fischl, 2012] pipeline, using a combination of Casual Markov‐Field modeling and probabilistic calculations based on image intensity to a hand‐labeled training set described in detail in Fischl [2004]. Statistically significant clusters (excluding the amygdala) from the modeled‐activation map of the ASD + TD condition from all of the included studies (Fig. 3) were mapped from volumetric space to the cortical surface of the fsaverage brain template in Freesurfer™ using the bbregister function to form a social brain mask. The masks were then mapped to each subject's native space, and a Monte‐Carlo null‐z distribution was computed for the mask on the fsaverage brain template. Each participant's cortical surface maps for thickness, surface area, and volume for each hemisphere were then normalized to the fsaverage template and smoothed to a full‐width half‐maximum (FWHM) of 10 mm for group comparisons.
Figure 3.
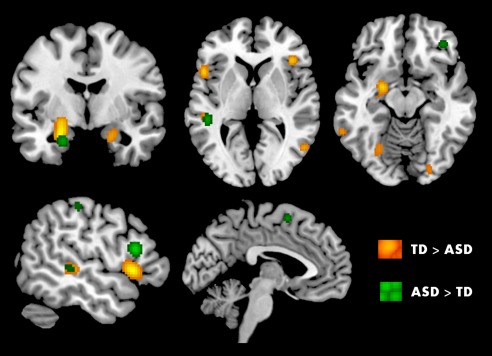
ALE analysis for TD > ASD (orange) and ASD > TD (green) group differences across studies: (p < 0.05, FDR cluster‐forming threshold). [Color figure can be viewed at http://wileyonlinelibrary.com.]
GLMs assessing TD versus ASD structural differences across the ALE mask included age, diagnosis, total‐brain measures (estimated total intracranial volume for volume, cubed‐root squared transform of total intracranial volume for surface area, and mean thickness of the left and right hemispheres for thickness), and the interaction terms for age and diagnosis, diagnosis and total‐brain measure, age and total‐brain measure, and the three‐way interaction between age, diagnosis, and total‐brain measure of interest. Each continuous variable (age, total‐brain‐measure) was centered along the group mean for the participant sample to reduce multicolinearity and increase power [Dalal and Zickar, 2012; Enders and Tofighi, 2007; Robinson and Schumacker, 2009]. GLMs for each metric of interest were performed individually on the left and right hemisphere, with the appropriate statistical correction for multiple hemispheres. Results were vertex‐level corrected across the mask using a “cluster” threshold of 0.01 based on the null‐z distribution computed across the mask for the group template.
RESULTS
The main results of this multilayered meta‐analysis study are (1) combined fMRI meta‐analysis of all participant groups (ASD + TD) revealed increased activity in several regions considered part of the social brain; (2) within‐group activation maps (within‐ASD, within‐TD) showed overlapping activation in many social brain areas across ASD and TD groups; (3) meta‐analysis of fMRI group differences as well as direct subtraction of within‐group activation indicated reduced activity in ASD in fusiform gyrus and cingulate cortex; (4) A sub analysis of studies involving only face processing tasks revealed reduced activity in ASD in fusiform, insula, cingulate, and amygdala; and (5) a social brain mask created based on fMRI results to examine cortical morphology, in an empirical structural MRI dataset, revealed significantly decreased cortical matter in the STS, insula, FFA, and left IFG for the ASD group.
Brain Areas Associated With Social Cognition
To characterize the functional profile of the social brain, we investigated the entire sample (ASD + TD) as one group. This combined group meta‐analysis (N ASD + TD = 89, N foci = 1,109] revealed significantly increased activation in the right insula, bilateral FFA, IFG, STG, MTG, precuneus, and amygdala, STG, left medial prefrontal cortex, left postcentral gyrus, left lingual gyrus during social cognition. Most of these regions have been considered to be part of the social brain. The results of this analysis provided a profile of the regions that are active in participants during social cognitive tasks. The corresponding anatomical regions and peak ALE maxima are shown in Table 2 and Figure 3.
Table 2.
ALE cluster values for combined ASD and TD analysis depicting regions recruited for social cognition tasks
| Brain | Site of maximum ALE | Volumea | Maximum | |||||||
|---|---|---|---|---|---|---|---|---|---|---|
| Region | Gyrus | BA | Laterality | x | y | z | (mm3) | ALE value | Contributing studies | |
| TD+ASD | ||||||||||
| Occipital | Fusiform | 19 | Right | 42 | −72 | −10 | 17480 | 0.05412651 | Kleinhans, 2009; Lombardo, 2010; Martineau, 2010; Morita, 2012; Pelphrey, 2005; Redcay, 2012; Schneider, 2012; Silani, 2007; Ashwin, 2007; Bastiaansen, 2011; Bird, 2006; Kana, 2009; Gervais, 2004; Hall, 2003; Deeley, 2007; Baron‐Cohen, 1999; Uddin, 2008; Carter, 2012; Wang, 2006; Wang, 2007; Corbett, 2009; Dapretto, 2006; Davies, 2011 | |
| Temporal | Fusiform | 37 | Right | 42 | −50 | −20 | 17480 | 0.053792123 | ||
| Temporal | Fusiform | 37 | Right | 48 | −56 | −‐8 | 17480 | 0.03487473 | ||
| Cerebellum | Declive | Right | 32 | −84 | −14 | 17480 | 0.032379657 | |||
| Occipital | Lingual | 18 | Right | 20 | −86 | −10 | 17480 | 0.03123553 | ||
| Occipital | Lingual | 18 | Right | 14 | −88 | −8 | 17480 | 0.029813562 | ||
| Cerebellum | Pyramis | Right | 28 | −82 | −28 | 17480 | 0.025772704 | |||
| Frontal | IFG | 9 | Right | 50 | 6 | 26 | 16760 | 0.045581292 | Martineau, 2010; Morita, 2012; Pelphrey, 2005; Redcay, 2012 In; Schneider, 2012; Silani, 2007; Bastiaansen, 2011; Kana, 2009; Pinkham, 2008; Baron‐Cohen, 1999; Hall, 2003; Deeley, 2007; Carter, 2012; Colich, 2012; Wang, 2006; Davies, 2011; Dapretto, 2006 | |
| Frontal | IFG | 13 | Right | 44 | 32 | 8 | 16760 | 0.039703425 | ||
| Frontal | IFG | 13 | Right | 50 | 28 | 2 | 16760 | 0.037399296 | ||
| Insula | Right | 32 | 22 | 0 | 16760 | 0.035746727 | ||||
| Temporal | STG | 38 | Right | 46 | 12 | −20 | 16760 | 0.031449612 | ||
| Frontal | IFG | 44 | Right | 54 | 8 | 16 | 16760 | 0.030147722 | ||
| Temporal | Insula | 38 | Right | 48 | 12 | −10 | 16760 | 0.029856449 | ||
| Frontal | MTG | 6 | Right | 48 | 4 | 40 | 16760 | 0.023461588 | ||
| Frontal | MFG | 6 | Right | 40 | 6 | 38 | 16760 | 0.021827674 | ||
| Temporal | Fusiform | 37 | Left | −42 | −52 | −20 | 15608 | 0.055118725 | Morita, 2012; Pelphrey, 2005; Redcay, 2012; Silani, 2007; Bastiaansen, 2011; Kana, 2009; Pinkham, 2008; Baron‐Cohen, 1999; Deeley, 2007; Hall, 2003; Uddin, 2008; Carter, 2012; Colich, 2012; Wang, 2006; Corbett, 2009; Dapretto, 2006; Davies, 2011 | |
| Cerebellum | Declive | Left | −18 | −82 | −16 | 15608 | 0.040249955 | |||
| Occipital | Fusiform | 19 | Left | −40 | −80 | −12 | 15608 | 0.03462337 | ||
| Cerebellum | Declive | Left | −30 | −86 | −14 | 15608 | 0.031770688 | |||
| Occipital | MOG | 18 | Left | −30 | −84 | −2 | 15608 | 0.030657215 | ||
| Occipital | MOG | 18 | Left | −22 | −90 | −4 | 15608 | 0.025647033 | ||
| Occipital | Lingual | 18 | Left | −10 | −84 | −4 | 15608 | 0.01790161 | ||
| Temporal | STG | 41 | Right | 46 | −24 | 10 | 11736 | 0.0459998 | Redcay, 2012; Schneider, 2012; Silani, 2007; Bastiaansen, 2011; Kana, 2009; Pinkham, 2008; Baron‐Cohen, 1999; Gervais, 2004; Deeley, 2007; Carter, 2012; Colich, 2012; Wang, 2006; Wang, 2007; Corbett, 2009 | |
| Temporal | STG | 39 | Right | 52 | −52 | 10 | 11736 | 0.042618394 | ||
| Temporal | Insula | 13 | Right | 50 | −16 | 4 | 11736 | 0.03803319 | ||
| Temporal | MTG/STG | 21 | Right | 48 | −12 | −12 | 11736 | 0.032998633 | ||
| Temporal | STG | 22 | Right | 58 | −12 | 2 | 11736 | 0.029443722 | ||
| Temporal | STG | 41 | Right | 64 | −22 | 8 | 11736 | 0.022896701 | ||
| Occipital | MTG | 37 | Right | 46 | −64 | 12 | 11736 | 0.021273583 | ||
| Temporal | STG | 41 | Left | −58 | −24 | 6 | 7552 | 0.043187886 | Morita, 2012; Pelphrey, 2005; Redcay, 2012; Silani, 2007; Bastiaansen, 2011; Baron‐Cohen, 1999; Deeley, 2007; Carter, 2012; Colich, 2012; Wang, 2006; Dapretto, 2006 | |
| Temporal | MTG | 22 | Left | −62 | −32 | 4 | 7552 | 0.036335785 | ||
| Temporal | MTG | 21 | Left | −64 | −32 | 4 | 7552 | 0.034959424 | ||
| Temporal | STG | 22 | Left | −58 | −44 | 8 | 7552 | 0.031985525 | ||
| Temporal | STG | 41 | Left | −46 | −32 | 12 | 7552 | 0.028247612 | ||
| Temporal | STG | 38 | Left | −48 | 14 | −22 | 5264 | 0.037705697 | Morita, 2012; Redcay, 2012; Schneider, 2012; Silani, 2007; Ashwin, 2007; Kana, 2009; Baron‐Cohen, 1999; Deeley, 2007; Carter, 2012; Colich, 2012; Wang, 2006; Wang, 2007 | |
| Frontal | IFG | 13 | Left | −36 | 26 | 2 | 5264 | 0.032419857 | ||
| Frontal | Insula | 47 | Left | −30 | 20 | −6 | 5264 | 0.023984835 | ||
| Limbic | Cingulate | 24 | Right | 4 | 2 | 46 | 5264 | 0.034800988 | ||
| Frontal | MPFC | 6 | Left | −2 | 6 | 56 | 5264 | 0.033842657 | ||
| Frontal | MPFC | 6 | Left | 2 | −4 | 56 | 5264 | 0.030689176 | ||
| Frontal | IFG | 45 | Left | −56 | 22 | 16 | 4408 | 0.032034855 | Kleinhans, 2009; Silani, 2007; Bastiaansen, 2011; Pinkham, 2008; Baron‐Cohen, 1999; Carter, 2012; Corbett, 2009; Dapretto, 2006; Davies, 2011; Dapretto, 2006; | |
| Frontal | Precentral | 6 | Left | −48 | 4 | 32 | 4408 | 0.03180007 | ||
| Frontal | IFG | 13 | Left | −50 | 8 | 4 | 4408 | 0.023599483 | ||
| Frontal | IFG | 13 | Left | −40 | 18 | 16 | 4408 | 0.02340784 | ||
| Frontal | IFG | 9 | Left | −52 | 14 | 24 | 4408 | 0.02178787 | ||
| Limbic | Amygdala | 13 | Left | −20 | −10 | −12 | 2880 | 0.049200706 | Martineau, 2010; Morita, 2012; Silani, 2007; Hall, 2003; Deeley, 2007; Uddin, 2008; Carter, 2012; Davies, 2011 | |
| Limbic | Amygdala | 9 | Left | −24 | −2 | −24 | 2880 | 0.030887658 | ||
| Frontal | MPFC | 9 | Left | 0 | 52 | 24 | 2480 | 0.03270933 | ||
| Frontal | SFG | 9 | Left | −6 | 62 | 20 | 2480 | 0.021746332 | ||
| Frontal | Postcentral | 3 | Left | −34 | −30 | 54 | 2112 | 0.029163424 | Kleinhans, 2009; Ashwin, 2007; Bastiaansen, 2011; Baron‐Cohen, 1999; Carter, 2012; Corbett, 2009; Dapretto, 2006; Davies, 2011 | |
| Frontal | Postcentral | 2 | Left | −46 | −22 | 40 | 2112 | 0.022138184 | ||
| Limbic | Amygdala | Right | 20 | −6 | −14 | 1720 | 0.047734328 | Morita, 2012; Baron‐Cohen, 1999; Gervais, 2004; Deeley, 2007 | ||
| Temporal | MFG | 39 | Left | −46 | −62 | 24 | 1104 | 0.03217082 | Morita, 2012; Baron‐Cohen, 1999; Deeley, 2007; Carter, 2012 | |
| Temporal | MFG | 39 | Left | −48 | −58 | 16 | 1104 | 0.02153084 | ||
| Parietal | Precuneus | 31 | Right | 28 | −76 | 30 | 880 | 0.025590919 | Schneider, 2012; Silani, 2007; Kana, 2009; Baron‐Cohen, 1999 | |
| Occipital | Precuneus | 31 | Right | 32 | −66 | 30 | 880 | 0.02122378 | ||
| Parietal | Precuneus | 31 | Left | −2 | −54 | 34 | 720 | 0.034940273 | Bastiaansen, 2011; Carter, 2012; Davies, 2011 | |
Note. Minimum cluster size based on FDR correction = 576; permutation equilibrium = 16. MFG = middle frontal gyrus, MPFC = medial prefrontal cortex, MTG = middle temporal gyrus, IFG = inferior frontal gyrus, SFG = superior frontal gyrus, STG = superior temporal gyrus, MOG = middle occipital gyrus.
Repetition of same cluster volumes indicates that these peaks were all within the same cluster.
Within‐Group Brain Activity
When activation likelihood during social cognition was estimated separately for each group of participants (within‐ASD, within‐TD), both ASD and TD group showed several overlapping ALE clusters of activation. These include FFA, IFG, MPFC, and STS. There were also a few regions that showed unique activation in each group. For example, insula activation was only seen in ASD group, whereas the TD group showed unique activity in TPJ, cingulate cortex, inferior temporal gyrus (ITG), precentral gyrus, and postcentral gyrus. Several of these regions showing statistically significant clusters in ASD and TD groups, including the STS, FFA, MPFC, IFG, and TPJ, have been implicated in previous studies of social cognition [Pelphrey and Carter, 2008]. Although ITG, precentral gyrus, and postcentral gyrus do not appear to be as commonly activated during social cognition tasks, some studies associate them with social cognition [Baron‐Cohen et al., 1999; Chiu et al., 2008]. See Tables 3 and 4 and Figure 2 for results.
Table 3.
ALE cluster values within ASD group only
| Brain | Site of maximum ALE | Maximum | ||||||
|---|---|---|---|---|---|---|---|---|
| Region | Gyrus/sulcus | BA | Laterality | x | y | z | Volumea (mm3) | ALE value |
| ASD | ||||||||
| Temporal | Fusiform | 37 | Right | 44 | −66 | −12 | 9264 | 0.030331947 |
| Anterior | Culmen | Right | 40 | −54 | −20 | 9264 | 0.030075628 | |
| Posterior | Declive | Right | 36 | −66 | −18 | 9264 | 0.022844706 | |
| Occipital | Lingual | 18 | Right | 16 | −86 | −8 | 9264 | 0.020278946 |
| Occipital | Lingual | 18 | Right | 6 | −84 | −6 | 9264 | 0.018359212 |
| Posterior | Uvula | Right | 30 | −82 | −26 | 9264 | 0.017297413 | |
| Posterior | Declive | Right | 30 | −82 | −14 | 9264 | 0.015294376 | |
| Temporal | Fusiform | 37 | Left | −42 | −52 | −20 | 8848 | 0.025839185 |
| Occipital | Fusiform | 19 | Left | −40 | −74 | −12 | 8848 | 0.022013115 |
| Occipital | Inferior Occipital | 18 | Left | −32 | −84 | −2 | 8848 | 0.019835446 |
| Occipital | Lingual | 19 | Left | −30 | −80 | 4 | 8848 | 0.01900635 |
| Posterior | Declive | Left | −18 | −82 | −12 | 8848 | 0.017046362 | |
| Occipital | Middle Occipital | 18 | Left | −22 | −90 | −6 | 8848 | 0.016933754 |
| Sub‐lobar | Insula | 13 | Right | 34 | 24 | −2 | 3240 | 0.024693143 |
| Frontal | Middle Frontal | 46 | Right | 46 | 30 | 10 | 3240 | 0.018757155 |
| Temporal | Transverse Temporal | 41 | Right | 46 | −24 | 10 | 3216 | 0.028715182 |
| Temporal | Superior Temporal | 13 | Right | 50 | −22 | 4 | 3216 | 0.024662865 |
| Temporal | Superior Temporal | 41 | Right | 58 | −28 | 8 | 3216 | 0.012479794 |
| Temporal | Middle Temporal | 22 | Left | −62 | −36 | 4 | 2928 | 0.02310238 |
| Temporal | Superior Temporal | 41 | Left | −58 | −26 | 10 | 2928 | 0.020005718 |
| Temporal | Superior Temporal | 22 | Left | −52 | −28 | 2 | 2928 | 0.019399282 |
| Temporal | Superior Temporal | 41 | Left | −48 | −32 | 12 | 2928 | 0.016045671 |
| Frontal | Inferior Frontal | 9 | Right | 46 | 12 | 24 | 2160 | 0.020109536 |
| Frontal | Inferior Frontal | 9 | Right | 54 | 8 | 18 | 2160 | 0.018232806 |
| Frontal | Inferior Frontal | 47 | Left | −44 | 18 | −16 | 2024 | 0.020636568 |
| Temporal | Superior Temporal | 38 | Left | −44 | 14 | −28 | 2024 | 0.017843021 |
| Sub‐lobar | Insula | 13 | Left | −42 | 18 | −2 | 2024 | 0.013671238 |
| Frontal | Inferior Frontal | 44 | Left | −52 | 18 | 10 | 1560 | 0.020568147 |
| Frontal | Inferior Frontal | 45 | Left | −54 | 22 | 16 | 1560 | 0.018506812 |
| Frontal | Inferior Frontal | 9 | Left | −52 | 16 | 22 | 1560 | 0.01628338 |
| Parietal | Postcentral | 40 | Left | −44 | −28 | 60 | 1312 | 0.017873524 |
| Parietal | Inferior Parietal | 40 | Left | −34 | −40 | 54 | 1312 | 0.012122758 |
| Sub‐lobar | Lentiform Nucleus | Left | −24 | −8 | −12 | 1248 | 0.019479897 | |
| Limbic | Parahippocampal | Left | −18 | −6 | −16 | 1248 | 0.018269729 | |
| Temporal | Superior Temporal | 22 | Right | 56 | −50 | 8 | 1120 | 0.019661412 |
| Limbic | Parahippocampal | Right | 20 | −6 | −16 | 760 | 0.02188986 | |
| Temporal | Superior Temporal | 38 | Right | 46 | 10 | −20 | 664 | 0.0152831 |
| Temporal | Middle Temporal | 39 | Left | −44 | −60 | 24 | 496 | 0.020626092 |
| Frontal | Inferior Frontal | 6 | Left | −48 | 6 | 32 | 496 | 0.018233394 |
| Frontal | Paracentral Lobule | 31 | Left | 2 | −8 | 50 | 464 | 0.015399425 |
Note. Minimum cluster size based on FDR correction = 464; permutation equilibrium = 22.
Repetition of same cluster volumes indicates that these peaks were all within the same cluster.
Table 4.
ALE cluster values within TD group only
| Brain | Site of maximum ALE | Maximum | ||||||
|---|---|---|---|---|---|---|---|---|
| region | Gyrus/sulcus | BA | Laterality | x | y | z | Volumea (mm3) | ALE value |
| TD | ||||||||
| Anterior | Culmen | Right | 42 | −48 | −22 | 7672 | 0.038141 | |
| Occipital | Fusiform | 19 | Right | 40 | −72 | −10 | 7672 | 0.033462 |
| Temporal | Subgyral | 37 | Right | 50 | −54 | −8 | 7672 | 0.028119 |
| Posterior | Declive | Right | 34 | −84 | −14 | 7672 | 0.019529 | |
| Occipital | Lingual | 18 | Right | 22 | −88 | −12 | 7672 | 0.018287027 |
| Temporal | Fusiform | 37 | Left | −42 | −52 | −18 | 5008 | 0.031164583 |
| Occipital | Inferior Temporal | Left | −48 | −70 | 2 | 5008 | 0.017410288 | |
| Temporal | Fusiform | 37 | Left | −46 | −68 | −6 | 5008 | 0.0170422 |
| Frontal | Inferior Frontal | 45 | Right | 52 | 26 | 2 | 4656 | 0.027324826 |
| Frontal | Middle Frontal | 46 | Right | 42 | 34 | 10 | 4656 | 0.02456526 |
| Sublobar | Insula | 13 | Right | 48 | 12 | −8 | 4656 | 0.022327906 |
| Sublobar | Claustrum | Right | 30 | 18 | 0 | 4656 | 0.02062103 | |
| Sublobar | Insula | 13 | Right | 34 | 26 | 4 | 4656 | 0.015006449 |
| Frontal | Inferior Frontal | 9 | Right | 50 | 8 | 28 | 3912 | 0.032349057 |
| Frontal | Precentral | 44 | Right | 52 | 8 | 10 | 3912 | 0.01981003 |
| Sublobar | Insula | 13 | Right | 44 | 12 | 18 | 3912 | 0.01948477 |
| Temporal | Subgyral | 21 | Right | 48 | −12 | −12 | 3688 | 0.02865497 |
| Sublobar | Insula | 13 | Right | 50 | −14 | 4 | 3688 | 0.025107788 |
| Temporal | Superior Temporal | 41 | Right | 40 | −30 | 14 | 3688 | 0.022448573 |
| Temporal | Superior Temporal | 41 | Right | 60 | −14 | 4 | 3688 | 0.02047863 |
| Limbic | Cingulate | 24 | Right | 4 | 2 | 46 | 2976 | 0.028651956 |
| Frontal | Medial Frontal | 6 | Left | 0 | 8 | 56 | 2976 | 0.022982934 |
| Frontal | Medial Frontal | 6 | Left | 2 | 2 | 58 | 2976 | 0.022076836 |
| Temporal | Superior Temporal | 39 | Right | 50 | −52 | 12 | 2848 | 0.029311212 |
| Temporal | Superior Temporal | 41 | Right | 52 | −40 | 6 | 2848 | 0.019602012 |
| Occipital | Middle Temporal | 37 | Right | 46 | −64 | 12 | 2848 | 0.019062284 |
| Temporal | Superior Temporal | 41 | Left | −58 | −22 | 4 | 2776 | 0.032378495 |
| Frontal | Medial Frontal | 9 | Left | 0 | 52 | 24 | 2352 | 0.025336599 |
| Frontal | Superior Frontal | 9 | Left | −6 | 64 | 18 | 2352 | 0.014481918 |
| Posterior | Declive | Left | −18 | −82 | −16 | 2088 | 0.026589418 | |
| Posterior | Declive | Left | −32 | −86 | −14 | 2088 | 0.021471513 | |
| Occipital | Fusiform | 19 | Left | −40 | −82 | −12 | 2088 | 0.01831894 |
| Sublobar | Lentiform Nucleus | Right | 18 | −8 | −10 | 1272 | 0.03259568 | |
| Sublobar | Lentiform Nucleus | Left | −20 | −10 | −10 | 1216 | 0.03406375 | |
| Temporal | Superior Temporal | 38 | Left | −48 | 14 | −22 | 1016 | 0.027216656 |
| Frontal | Inferior Frontal | 45 | Left | −36 | 28 | 2 | 1016 | 0.022899399 |
| Parietal | Postcentral | 3 | Left | −32 | −30 | 52 | 848 | 0.017779186 |
| Parietal | Postcentral | 2 | Left | −42 | −22 | 40 | 848 | 0.01583136 |
| Posterior | Pyramis | Right | 26 | −80 | −32 | 736 | 0.01774826 | |
| Temporal | Superior Temporal | 22 | Left | −58 | −44 | 10 | 704 | 0.023801552 |
| Frontal | Precentral | 44 | Left | −52 | 6 | 4 | 576 | 0.018190052 |
| Frontal | Precentral | 44 | Left | −50 | 6 | 8 | 576 | 0.01727778 |
Note. Minimum cluster size based on FDR correction = 528; permutation equilibrium = 11.
Repetition of same cluster volumes indicates that these peaks were all within the same cluster.
Figure 2.
ALE estimation of social brain activity across ASD, TD, and ASD and TD participants combined (p < 0.05, FDR cluster‐forming threshold). Activity is seen in regions, such as the MPFC, bilateral STG, posterior cingulate/precuneus, fusiform gyrus, and bilateral inferior frontal gyrus. [Color figure can be viewed at http://wileyonlinelibrary.com.]
Group Differences in Social Brain Activity: ASD > TD vs TD > ASD
The ASD group demonstrated significantly greater activation in the STG, insula, amygdala, IFG, MFG, precentral gyrus, and postcentral gyrus, compared to their TD counterparts (N ASD > TD contrast = 23; N foci = 99; Table 5 and Fig. 3). The ASD group showed significantly lower activity, when compared to TD participants (N TD > ASD contrast = 55; N foci = 279), in amygdala, hippocampus, FFA, STG, cingulate, and IFG. See Table 6 and Figure 3 for results. Although several of these regions are common across these comparisons (ASD > TD and TD > ASD), the peak of activation coordinates differ in some cases. Nevertheless, it should be noted that the main regions of group difference, where ASD group had lower activity than TD, were FFA, hippocampus, and cingulate cortex.
Table 5.
ALE cluster values for ASD > TD between‐group analysis
| Brain | Site of maximum ALE | Maximum | ||||||
|---|---|---|---|---|---|---|---|---|
| region | Gyrus/sulcus | BA | Hem | x | y | z | Volumea (mm3) | ALE value |
| ASD>TD | ||||||||
| Frontal | Inferior frontal | 9 | Left | −54 | 20 | 18 | 1232 | 0.02323516 |
| Parietal | Postcentral | 3 | Left | −40 | −26 | 58 | 968 | 0.013614106 |
| Parietal | Inferior parietal | 40 | Left | −50 | −26 | 50 | 968 | 0.011815298 |
| Temporal | Superior temporal | 22 | Left | −48 | −32 | 2 | 856 | 0.015697075 |
| Limbic | Amygdala | Left | −22 | −4 | −26 | 752 | 0.014984485 | |
| Frontal | Precentral | 4 | Left | −30 | −14 | 66 | 592 | 0.01119461 |
| Frontal | Inferior frontal | 9 | Right | 38 | 14 | 24 | 496 | 0.013928136 |
| Sublobar | Insula | 13 | Right | 40 | 22 | 12 | 488 | 0.013267966 |
| Frontal | Middle frontal | 47 | Right | 38 | 40 | −14 | 480 | 0.013834674 |
| Frontal | Precentral | 6 | Left | −34 | 4 | 34 | 480 | 0.013832372 |
| Frontal | Medial frontal | 6 | Left | −2 | 5 | 60 | 480 | 0.013830137 |
Note. Minimum cluster size based on FDR correction = 312; permutation equilibrium = 11.
Repetition of same cluster volumes indicates that these peaks were all within the same cluster.
Table 6.
ALE cluster values for TD > ASD between‐group analysis
| Brain | Site of maximum ALE | Maximum | ||||||
|---|---|---|---|---|---|---|---|---|
| region | Gyrus | BA | Hem | x | y | z | Volumea (mm3) | ALE value |
| TD>ASD | ||||||||
| Limbic | Amygdala | Left | −24 | −4 | −20 | 2656 | 0.02320312 | |
| Limbic | Hippocampus | Left | −30 | −14 | −16 | 2656 | 0.013125481 | |
| Frontal | Precentral | 44 | Left | −52 | 18 | 0 | 1640 | 0.023291802 |
| Posterior | Declive | Left | −26 | −70 | −16 | 1464 | 0.017044175 | |
| Occipital | Fusiform | 19 | Left | −26 | −64 | −8 | 1464 | 0.013665032 |
| Limbic | Parahippocampal | Right | 22 | −4 | −22 | 1096 | 0.014839961 | |
| Temporal | Superior temporal | 22 | Left | −52 | −30 | 2 | 832 | 0.015007527 |
| Frontal | Inferior frontal | 13 | Right | 42 | 28 | 4 | 816 | 0.018335775 |
| Occipital | Fusiform | 19 | Right | 24 | −88 | −8 | 784 | 0.013432466 |
| Posterior | Declive | Right | 26 | −88 | −18 | 784 | 0.01089274 | |
| Limbic | Cingulate | 31 | Left | −24 | −42 | 34 | 664 | 0.015882928 |
| Parietal | Inferior parietal | 40 | Left | −32 | −46 | 40 | 664 | 0.014318956 |
| Temporal | Middle temporal | 37 | Right | 54 | −64 | 6 | 496 | 0.01714673 |
| Temporal | Middle temporal | 37 | Left | −64 | −48 | −10 | 424 | 0.014566092 |
| Frontal | Inferior frontal | 47 | Left | −32 | 14 | −22 | 408 | 0.015064342 |
Note. Minimum cluster size based on FDR correction = 376; permutation equilibrium = 16.
Repetition of same cluster volumes indicates that these peaks were all within the same cluster.
Comparing Face‐Processing Tasks vs Non‐Face‐Processing Tasks
Sub analyses of social cognition tasks involving only face versus nonface stimuli revealed several clusters of significantly reduced activation in ASD, compared to TD, individuals centered on right parahippocampal gyrus, left FFA, cerebellum, left insula, left anterior cingulate, thalamus, bilateral cingulate, right MFG, and left IFG, during face‐processing social tasks. Nonface social tasks, on the other hand, elicited reduced activity in ASD centered within the left precentral gyrus, STG, IFG, MTG, angular gyrus, cerebellum, IPL, right IFG, lingual gyrus, and MTG. The ASD participants showed greater activity, relative to TD, in the left parahippocampal gyrus during face processing, and greater activity in the following regions during non‐face‐processing tasks: left IFG, STG, postcentral gyrus, precentral gyrus, MPFC, MTG, ITG, right insula, IFG, and MFG tasks. These results are summarized in Table 7 and Figure 4.
Table 7.
ALE clusters of between‐group comparisons for face‐processing vs non‐face‐processing tasks
| Brain | Site of maximum ALE | Volumea (mm3) | Maximum ALE value | |||||
|---|---|---|---|---|---|---|---|---|
| region | Gyrus/sulcus | BA | Hem | x | y | z | ||
| Face tasks: | ||||||||
| TD>ASD b | ||||||||
| Limbic | Inferior frontal | 34 | Left | −22 | −2 | −16 | 2096 | 0.020085309 |
| Limbic | PHG | Right | 22 | −4 | −22 | 1888 | 0.014839509 | |
| Occipital | Fusiform | 19 | Left | −26 | −64 | −8 | 1056 | 0.013205927 |
| Cerebellum | Declive | Left | −34 | −66 | −18 | 1056 | 0.009973204 | |
| Cerebellum | Anterior lobe | Left | −36 | −56 | −30 | 696 | 0.011946438 | |
| Frontal | Insula | 13 | Left | −28 | −34 | 28 | 480 | 0.015424337 |
| Frontal | ACC | 25 | Left | 2 | 18 | −16 | 456 | 0.015806857 |
| Frontal | ACC | 24 | Left | −8 | 26 | −12 | 456 | 0.015807344 |
| Limbic | Cingulate | 31 | Right | 4 | −38 | 32 | 456 | 0.015403693 |
| Limbic | Cingulate | 31 | Left | −24 | −42 | 34 | 456 | 0.015403725 |
| Thalamic | Thalamus | Left | −4 | −22 | 10 | 424 | 0.011637608 | |
| Limbic | Cingulate | 24 | Left | 0 | 30 | 16 | 408 | 0.013570925 |
| Frontal | IFG | 45 | Left | −58 | 20 | 18 | 392 | 0.012095158 |
| Frontal | MFG | 32 | Right | 2 | 44 | −10 | 360 | 0.011654614 |
| ASD>TD c | ||||||||
| Limbic | PHG | 34 | Left | −20 | 0 | −26 | 384 | 0.008797275 |
| Nonface tasks: | ||||||||
| TD > ASD d | ||||||||
| Frontal | Precentral | 44 | Left | −52 | 16 | 2 | 1544 | 0.018760668 |
| Temporal | STG | 22 | Left | −52 | −30 | 2 | 1472 | 0.015001407 |
| Frontal | IFG | 47 | Left | −32 | 14 | −22 | 736 | 0.014999792 |
| Temporal | MTG | 37 | Left | −64 | −48 | −10 | 736 | 0.01456575 |
| Limbic | Hippocampus | Left | −30 | −14 | −16 | 488 | 0.012515563 | |
| Parietal | Angular gyrus | 39 | Left | −54 | −60 | 40 | 488 | 0.015507407 |
| Frontal | IFG | 13 | Right | 30 | 12 | −18 | 480 | 0.013494215 |
| Cerebellum | Declive | Left | −26 | −70 | −17 | 480 | 0.014803587 | |
| Occipital | Lingual gyrus | 18 | Right | 24 | −90 | −8 | 480 | 0.011711578 |
| Temporal | STG | 38 | Left | −44 | 10 | −24 | 448 | 0.01222351 |
| Temporal | MTG | 37 | Right | 52 | −64 | 6 | 440 | 0.014093696 |
| Frontal | IFG | 13 | Right | 42 | 26 | 4 | 408 | 0.012589583 |
| Parietal | IPL | 40 | Left | −32 | −46 | 40 | 392 | 0.013886107 |
| ASD>TD e | ||||||||
| Frontal | IFG | 44 | Left | −54 | 20 | 16 | 912 | 0.019449683 |
| Temporal | STG | 22 | Left | −48 | −32 | 2 | 856 | 0.015597242 |
| Frontal | IFG | 13 | Right | 40 | 22 | 12 | 504 | 0.013254493 |
| Parietal | Postcentral | 3 | Left | −40 | −26 | 58 | 504 | 0.013563364 |
| Frontal | IFG | 9 | Right | 38 | 14 | 24 | 496 | 0.013926981 |
| Frontal | MFG | 47 | Right | 38 | 40 | −14 | 480 | 0.013834672 |
| Frontal | Precentral | 6 | Left | −34 | 3 | 34 | 480 | 0.013830137 |
| Frontal | MPFC | 6 | Left | −2 | 5 | 60 | 480 | 0.013830137 |
| Temporal | MTG | 37 | Left | −58 | −69 | 12 | 384 | 0.013830137 |
| Temporal | ITG | 37 | Left | −62 | −65 | −8 | 344 | 0.013830137 |
Repetition of same cluster volumes indicates that these peaks were all within the same cluster
Minimum cluster size based on FDR correction = 360; permutation equilibrium = 20.
Minimum cluster size based on FDR correction = 200; permutation equilibrium = 19.
Minimum cluster size based on FDR correction = 384; permutation equilibrium = 41.
Minimum cluster size based on FDR correction = 288; permutation equilibrium = 11.
MFG = middle frontal gyrus, MPFC = medial prefrontal cortex, MTG = middle temporal gyrus, IFG = inferior frontal gyrus, SFG = superior frontal gyrus, STG = superior temporal gyrus, ITG = inferior temporal gyrus, MOG = middle occipital gyrus, IPL = inferior parietal lobule, PHG = parahippocampal gyrus.
Figure 4.
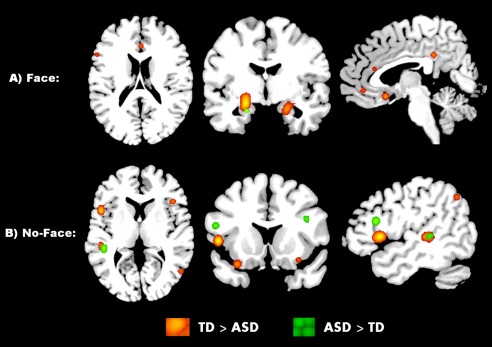
Between‐group differences in social task requiring face processing (A), and social tasks that do not require face processing (B). TD > ASD (orange), ASD > TD (green). All areas p < 0.05, FDR cluster‐forming threshold. [Color figure can be viewed at http://wileyonlinelibrary.com.]
Surface‐Based Morphometry Using Social Brain Mask
Application of the social brain mask, derived from ALE meta‐analysis of fMRI studies, to empirical structural MRI data collected from 115 participants revealed significant morphological changes (cortical surface area, and thickness) in several social brain areas. Cortical surface area was found to be decreased in ASD participants in the superior temporal cortex and right insula relative to total‐intracranial volume (Fig. 5). The effect within the superior temporal cortex was strongly influenced, but not fully explained by age. Analyses of cortical thickness revealed significant increases in thickness in individuals with ASD in the left pars opercularis aspect of the IFG relative to age, and to mean thickness of the left hemisphere. Interactions examining all 3 terms together revealed that the thickness of the left pars opercularis decreases in individuals with ASD as a function of age and as a function of the mean‐thickness of the right hemisphere combined. A similar effect was also noticed in the right fusiform gyrus, with group differences heavily influenced by the interactions between age and mean thickness of the right hemisphere. Finally, qualitative examination of previous results from surface‐based [Libero et al., 2014] and voxel‐based [DeRamus and Kana, 2014] morphometry studies of ASD found several regions that overlap as well as differ with the findings of the current study.
Figure 5.
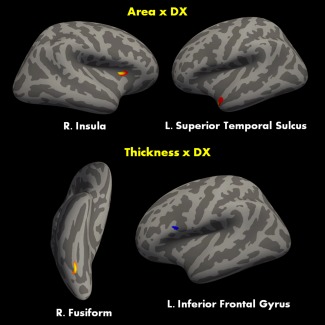
Group differences in surface area (top) and cortical thickness (bottom) between a sample of T1 images of ASD and TD participants within social brain ROIs computed from the ALE mask. Red denotes decrease ASD and blue denotes increases in ASD. [Color figure can be viewed at http://wileyonlinelibrary.com.]
DISCUSSION
This study attempted to consolidate the anatomy and function of the social brain in ASD using a comprehensive meta‐analysis of fMRI studies coupled with cortical morphology data from an empirical structural MRI study. The main findings point to several, but not all, regions of the social brain showing anatomical and functional alterations in ASD participants. Meta‐analysis of ASD and TD groups combined resulted in an ALE map consisting of ROIs that highly overlap with areas of the social brain. These regions are the right cingulate cortex, left MFG, left postcentral gyrus, and bilateral: insula, FFA, amygdala, middle temporal gyrus, and precuneus. Specific social processes including ToM (TPJ, MPFC, PCC), emotional and moral processing (insula, vmPFC, amygdala), processing human faces and actions (FFA, STG, TPJ, premotor/mirror neurons), and social reasoning and self‐reflection (MPFC, precuneus/PCC) are found to be mediated by activity in these regions [Adolphs, 2009; Fletcher et al., 1995; Gallagher and Frith, 2003; Iacoboni and Dapretto, 2006; Oberman and Ramachandran, 2007; Pelphrey and Carter, 2008; Ruby and Decety, 2003; Saxe and Kanwisher, 2003; Vogeley et al., 2001]. Notably, some moderate patterns emerged regarding the clusters identified and their contributing studies (Table 2). Broadly, the largest clusters (e.g., first) are less differentiated and appear to be related to more general social cognition as these experimental paradigms involve face processing, theory‐of‐mind, self vs other, and imitation. However, smaller clusters, such as the last cluster in the table, appear more function specific. For example, the smallest cluster in the left parietal (precuneus) is related to social processing or social judgment (e.g., gaze and face processing).
When the meta‐analysis was applied to each group (ASD, TD) separately, significant clusters of activity were seen common to both groups in left FFA, right insula, right MPFC, bilateral IFG, and STG. Within‐group activation patterns suggest similar recruitment of social brain areas in ASD and TD groups. It should also be noted that there were some social brain area activity unique to each group; right FFA and left insula in ASD group, and MPFC, right cingulate, and precentral gyrus in TD group.
Group difference results indicate underactivity in ASD participants in several social brain areas, such as the amygdala, STG, FFA, and cingulate cortex. It should be noted that dysfunction of all these regions have been proposed by previous neuroimaging studies as potential neural markers of autism. For instance, lower level of amygdala activation has been found to play a significant role in social and emotional processing in autism [Baron‐Cohen et al., 2000; Dalton et al., 2005a; Kliemann et al., 2013; Zalla and Sperduti, 2013]. Reduced cingulate activation during one's own decision (self‐response) while playing a social exchange game has been found to predict ASD symptom severity [Chiu et al., 2008]. It has been suggested that developmental differences in the amygdala, and possibly other limbic areas such as the cingulate, could have a cascading effect on cortical areas that mediate areas related to social perception (e.g., FFA) [Baron‐Cohen et al., 2000; Schultz, 2005]. Dysfunction of regions, such as the STG [Kaiser et al., 2010] and FFA [Spencer et al., 2011] has been proposed by recent neuroimaging studies as potential neuroendophenotypes of autism. The IFG, especially BA44 (pars opercularis aspect of IFG) was another area of underactivation found in ASD participants. Several functional [Dapretto et al., 2006; Oberman et al., 2005] and anatomical [Hadjikhani et al., 2009] abnormalities have been reported in the IFG in autism by previous studies. Thus, the group difference findings from this study revealed reduced activity in important nodes of the social brain in ASD participants.
It is possible that the alterations in brain response to different social cognition tasks in ASD individuals may underlie anatomical differences. An important and novel aspect of this study involves relating the functional MRI results from the meta‐analysis to neuroanatomy in a relatively large empirical dataset. Surface‐based Morphometry analysis of structural MRI data using the social brain mask (created based on the results of our ALE meta‐analysis) showed reduced cortical surface area in right insula, left STG, and FFA in ASD participants, relative to TD controls. It should be noted that these regions were also found to show hypoactivity in ASD participants in the meta‐analysis, suggesting an anatomical basis to some of the functional differences. Reduced sulcal depth [Dierker et al., 2013], cortical volume [Kosaka et al., 2010], and functional activation [Dimartino et al., 2009], as well as connectivity [Ebisch et al., 2011; Kana et al., 2007; Paakki et al., 2010] in the insula have been reported previously in the ASD literature. The insula is also considered as the hub of the “salience network,” integrating external stimuli with self‐perceptions and emotional states, dysfunction of which could relate to many of the behavioral symptoms of ASD [Silani et al., 2008; Uddin and Menon, 2009]. Alterations in cortical morphological features have also been reported in the STG and FFA in individuals with ASD [Boddaert et al., 2004; Dziobek et al., 2010; Ecker et al., 2010; Gervais et al., 2004; Hadjikhani et al., 2006; Jiao et al., 2010; McAlonan et al., 2005]. The frequency and consistency of functional and morphological abnormalities found in STG and FFA suggest a strong role of these regions in the pathobiology of ASD.
One region where we found an increase in cortical thickness in ASD was the IFG. While this finding is consistent with a recent meta‐analysis of gray matter abnormalities in ASD [Via et al., 2011], it is in contrast with some previous findings of smaller gray matter volume in ASD [Dierker et al., 2013; Hadjikhani et al., 2006; Kosaka et al., 2010; Yamasaki et al., 2010]. It is possible that such differences in findings may reflect methodological differences, such as not including age and total intracranial metrics as factors in the analysis model, or the focus of studies on a specific developmental window (i.e., 18–30 years). Considering the developmental differences in total intracranial volume in ASD [Courchesne et al., 2010; Schumann et al., 2009], age can play a significant factor in determining cortical differences. In this context, it should also be noted that the folding patterns within the IFG and insula may be altered in ASD [Nordahl et al., 2007], which could potentially affect the way morphometric data are interpreted in autism.
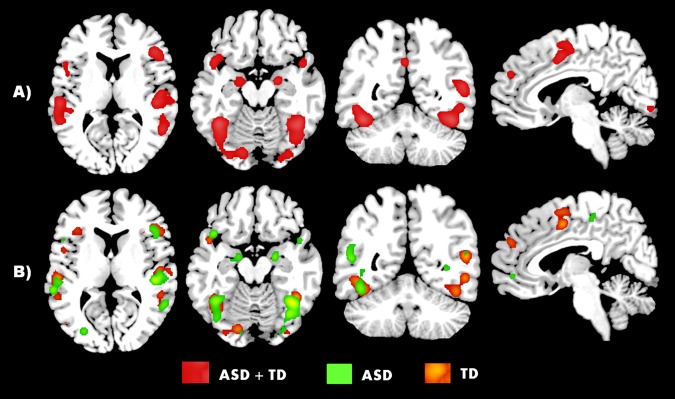
Qualitative examination of previous results from voxel‐based ALE meta‐data [DeRamus & Kana, 2014; see Fig. 6) and whole‐brain surface‐based morphometry study of ASD [Libero et al., 2014] found overlap with the social brain ALE analysis results in the LIFG region reported in Libero et al. [2014], but also different results in the left middle temporal, and right fusiform and insula. There was little apparent overlap with the VBM meta‐meta data (Supporting Information, Fig. 1). This divergence could be due to a number of factors, most of which are likely related to methodology and developmental level of the participants. Methodologically, Libero et al. [2014] used a whole‐brain Monte Carlo correction for reporting the results. In contrast, the ALE social brain mask analysis is Monte Carlo corrected at the level of the mask (red regions in Fig. 2 and yellow regions in Fig. 6), and metrics of age and total intracranial volume (TICV) are centered at the mean. Voxel‐based morphometry (VBM) can be used to measure grey or white matter concentration (proportion of matter type within a region) or volume (weighting voxel intensity by the Jacobian determinant) [Mechelli et al., 2005], both of which calculate measures differently compared to surface‐based approaches (see Greve [2011] for a brief review of both techniques). With regard to development, there is a large amount of literature describing the effects of age on cortical metrics [Giedd et al., 1999] and how these developmental trajectories may be altered in ASD during development [Schumann et al., 2010; Wallace et al., 2010]. However, the cross‐sectional nature and relatively large age‐range in ALE studies like the current one limits the ability to pinpoint and interpret what stages of development are associated with significant morphological changes in the cortex.
Figure 6.

The social brain mask produced across theory of mind task type across both TD and ASD participants is displayed as a yellow overlay. Results of the surface based analysis on the mask found regions of decreased surface area (dark blue), volume (green) and increased thickness (pink). This is displayed in conjunction with ALE computed VBM meta‐data displaying decreased (dark blue) and increased (red) volume in ASD. [Color figure can be viewed at http://wileyonlinelibrary.com.]
One of the most widely studied areas of social cognition in autism is face processing, with evidence supporting abnormalities emerging from behavioral, neuroimaging, and eye‐tracking studies [e.g., Corbett et al., 2014; Sasson and Touchstone, 2014; Yucel et al., 2014]. ALE maps for face processing tasks suggest that ASD participants, relative to TD, showed reduced activity in FFA, cingulate cortex, insula, and parahippocampus. In contrast, the ASD participants showed increased activity only in the left parahippocampal gyrus. These results underscore altered recruitment of core areas during face processing in individuals with ASD, as evidenced from numerous fMRI studies. Activation of FFA along with other social brain areas (cingulate, insula) in TD participants may suggest richer and more meaningful face processing in them. Understanding the effects of face versus non‐face processing is important, particularly in the context of how faces are perceived in ASD: configural or featural. A number of studies of face processing in ASD suggest differences in activation and gaze/fixation preferences between TD and ASD individuals. Preference in eye fixation significantly affects the former, and some studies controlling for fixation [Hadjikhani et al., 2004] or manipulating familiarity [Pierce and Redcay, 2008] suggest that a difference in perceptual strategy in ASD. Studies of social cognition, especially neuroimaging studies, should control for perceptual preferences in order to improve the reliability of findings.
Notably, meta‐analyses have the inherent publication bias and suffer the “file drawer” effect such that only studies with significant findings and thus published, not those with null findings, are included in the meta‐analysis. Although the present ALE is also victim of the file drawer effect, it is more difficult to estimate the effect of publication bias since ALE is a function‐location meta‐analysis, but not effect size meta‐analysis. Prior effect size meta‐analyses of neuroimaging studies have estimated publication bias [Jennings and Van Horn, 2012]; however, further investigation is needed to determine the scientific method for estimating the bias in ALE. Additionally, although the areas identified herein appear to be related to social cognition, it should be noted that the function of these areas may not be exclusive to social cognition. For example, the FFA also responds to many visual stimuli not only social stimuli such as faces [Zachariou et al., 2015]. Further, it is possible that areas such as the motor, visual, or auditory cortex could play no role in social cognition but still be active in studies of social cognition due to requirements of tasks or presentation of stimuli that are inadequately controlled (e.g., button presses, on/off visual or auditory stimuli). Last, there were a few similar areas found in both the ASD > TD and TD >ASD analyses (e.g., left STG), which appears counterintuitive. It is important to highlight that the coordinates found with ALE analyses may be slightly different because studies entered for the analyses differ. For example, a study reports ASD > TD results and did not have any TD > ASD results; in such case, only the ASD > TD coordinates will be entered in the ALE. In this case, however, it appears that the greater activity (ASD > TD) in ASD participants in the STG is related to more general, even positive, emotional processing of faces [Dalton et al., 2005a; Williams et al., 2006]; whereas, less activity in ASD participants in the STG is related to processing of threatening (the “other” vs self, fear, trustworthiness) face processing [Hadjikhani et al., 2009; Pinkham et al., 2008].
In summary, the results of this ALE meta‐analysis and cortical morphometry study validate the findings of many previous studies on activation, connectivity, and morphology in the social brain in individuals with ASD. Among the different social brain areas, insula, FFA, STG, and IFG seem to differentiate autism from control participants at functional and anatomical levels, suggesting alterations in these regions as potential neural markers of ASD. It is important to note that this fMRI meta‐analysis and empirical structural MRI data provide a somewhat converging picture of multilevel abnormality in social cognition in autism. With continuing efforts toward data‐sharing and classification analyses within the field of ASD research, meta‐data approaches could be very useful in developing targets for multilevel neuroimaging models to assist in refining biomarkers for ASD, and develop relationships among function, structure, and connectivity.
Supporting information
Supplementary Information
ACKNOWLEDGMENTS
The authors would like to thank Dr Mick Fox for his help in answering all our questions related to ALE. The authors would also like to thank Hrishikesh Deshpande for his help with the computational aspects of this study.
REFERENCES
- Adolphs R (2001): The neurobiology of social cognition. Curr Opin Neurobiol 11:231–239. [DOI] [PubMed] [Google Scholar]
- Adolphs R (2009): The social brain: Neural basis of social knowledge. Ann Rev Psychol 60:693. [DOI] [PMC free article] [PubMed] [Google Scholar]
- Ashwin C, Baron‐Cohen S, Wheelwright S, O'Riordan M, Bullmore ET (2007): Differential activation of the amygdala and the “social brain” during fearful face‐processing in Asperger Syndrome. Neuropsychologia 45:2–14. [DOI] [PubMed] [Google Scholar]
- Baron‐Cohen S, Ring HA, Bullmore ET, Wheelwright S, Ashwin C, Williams SC (2000): The amygdala theory of autism. Neurosci Biobehav Rev 24:355–364. [DOI] [PubMed] [Google Scholar]
- Baron‐Cohen S, Ring HA, Wheelwright S, Bullmore ET, Brammer MJ, Simmons A, Williams SC (1999): Social intelligence in the normal and autistic brain: An fMRI study. Eur J Neurosci 11:1891–1898. [DOI] [PubMed] [Google Scholar]
- Bastiaansen JA, Thioux M, Nanetti L, van der Gaag C, Ketelaars C, Minderaa R, Keysers C (2011): Age‐related increase in inferior frontal gyrus activity and social functioning in autism spectrum disorder. Biological Psychiatry 69:832–838. [DOI] [PubMed] [Google Scholar]
- Blakemore SJ, den Ouden H, Choudhury S, Frith C (2007): Adolescent development of the neural circuitry for thinking about intentions. Soc Cogn Affect Neurosci 2:130–139. [DOI] [PMC free article] [PubMed] [Google Scholar]
- Bird G, Catmur C, Silani G, Frith CD, Frith U (2006): Attention does not modulate neural responses to social stimuli in autism spectrum disorders. NeuroImage 31:1614–1624. [DOI] [PubMed] [Google Scholar]
- Boddaert N, Chabane N, Gervais H, Good CD, Bourgeois M, Plumet MH, Barthelemy C, Mouren MC, Artiges E, Samson Y, Brunelle F, Frackowiak RS, Zilbovicius M (2004): Superior temporal sulcus anatomical abnormalities in childhood autism: A voxel‐based morphometry MRI study. Neuroimage 23:364–369. [DOI] [PubMed] [Google Scholar]
- Bookheimer SY, Wang AT, Scott A, Sigman M, Dapretto M (2008): Frontal contributions to face processing differences in autism: evidence from fMRI of inverted face processing. Journal of the International Neuropsychological Society 14:922–932. [DOI] [PMC free article] [PubMed] [Google Scholar]
- Brandenburg‐Goddard MN, van Rijn S, Rombouts SA, Veer IM, Swaab H (2014): A comparison of neural correlates underlying social cognition in Klinefelter syndrome and autism. Social Cognitive and Affective Neuroscience 9:1926–1933. [DOI] [PMC free article] [PubMed] [Google Scholar]
- Brothers L (1990): The social brain: A project for integrating primate behavior and neurophysiology in a new domain. Concepts Neurosci 1:27–51. [Google Scholar]
- Castelli F, Frith C, Happe F, Frith U (2002): Autism, Asperger syndrome and brain mechanisms for the attribution of mental states to animated shapes. Brain 125:1839–1849. [DOI] [PubMed] [Google Scholar]
- Cauda F, Costa T, Palermo S, D'Agata F, Diano M, Bianco F, Duca S, Keller R (2014): Concordance of white matter and gray matter abnormalities in autism spectrum disorders: A voxel‐based meta‐analysis study. Hum Brain Mapp 35:2073–2098. [DOI] [PMC free article] [PubMed] [Google Scholar]
- Cauda F, Geda E, Sacco K, D'Agata F, Duca S, Geminiani G, Keller R (2011): Grey matter abnormality in autism spectrum disorder: An activation likelihood estimation meta‐analysis study. J Neurol Neurosurg Psychiatry 82:1304–1313. [DOI] [PubMed] [Google Scholar]
- Chiu PH, Kayali MA, Kishida KT, Tomlin D, Klinger LG, Klinger MR, Montague PR (2008): Self responses along cingulate cortex reveal quantitative neural phenotype for high‐functioning autism. Neuron 57:463–473. [DOI] [PMC free article] [PubMed] [Google Scholar]
- Colich NL, Wang A‐T, Rudie JD, Hernandez LM, Bookheimer SY, Dapretto M (2012): Atypical neural processing of ironic and sincere remarks in children and adolescents with autism spectrum disorders. Metaphor and Symbol 27:70–92. [DOI] [PMC free article] [PubMed] [Google Scholar]
- Corbett BA, Carmean V, Ravizza S, Wendelken C, Henry ML, Carter C, Rivera S.M (2009): A functional and structural study of emotion and face processing in children with autism. Psychiatry Research: Neuroimaging 173:196–205. [DOI] [PMC free article] [PubMed] [Google Scholar]
- Corbett BA, Newsom C, Key AP, Qualls LR, Edmiston EK (2014): Examining the relationship between face processing and social interaction behavior in children with and without autism spectrum disorder. J Neurodev Disorders 6:35. [DOI] [PMC free article] [PubMed] [Google Scholar]
- Courchesne E, Campbell K, Solso S (2010): Brain growth across the life span in autism: Age‐specific changes in anatomical pathology. Brain Res. [DOI] [PMC free article] [PubMed] [Google Scholar]
- Critchley HD, Daly EM, Bullmore ET, Williams SC, Van Amelsvoort T, Robertson DM, Rowe A, Phillips M, McAlonan G, Howlin P, Murphy DG (2000): The functional neuroanatomy of social behaviour: Changes in cerebral blood flow when people with autistic disorder process facial expressions. Brain 123:2203–2212. [DOI] [PubMed] [Google Scholar]
- Dalal DK, Zickar MJ (2012): Some common myths about centering predictor variables in moderated multiple regression and polynomial regression. Organizational Res Met 15:339–362. [Google Scholar]
- Dalton KM, Nacewicz BM, Johnstone T, Schaefer HS, Gernsbacher MA, Goldsmith HH, Alexander AL, Davidson RJ (2005): Gaze fixation and the neural circuitry of face processing in autism. Nat Neurosci 8:519–526. [DOI] [PMC free article] [PubMed] [Google Scholar]
- Dalton K, Nacewicz B, Alexander A, Davidson R (2007): Gaze‐fixation, brain activation, and amygdala volume in unaffected siblings of individuals with autism. Biological Psychiatry 61:512–520. [DOI] [PubMed] [Google Scholar]
- Dapretto M, Davies MS, Pfeifer JH, Scott AA, Sigman M, Bookheimer SY, Iacoboni M (2006): Understanding emotions in others: Mirror neuron dysfunction in children with autism spectrum disorders. Nat Neurosci 9:28–30. [DOI] [PMC free article] [PubMed] [Google Scholar]
- Davies MS, Dapretto M, Sigman M, Sepeta L, Bookheimer SY (2011): Neural bases of gaze and emotion processing in children with autism spectrum disorders. Brain and Behavior 1:1–11. [DOI] [PMC free article] [PubMed] [Google Scholar]
- Deeley Q, Daly EM, Surguladze S, Page L, Toal F, Robertson DM, Curran S, Giampietro V, Seal M, Brammer MJ, Andrew CM, Murphy K, Phillips ML, Murphy DG (2007): An event related functional magnetic resonance imaging study of facial emotion processing in Asperger syndrome. Biological Psychiatry 62:207–217. [DOI] [PubMed] [Google Scholar]
- DeRamus TP, Kana RK (2014): Anatomical likelihood estimation meta‐analysis of grey and white matter anomalies in autism spectrum disorders. NeuroImage: Clinical, Advanced online publication. [DOI] [PMC free article] [PubMed] [Google Scholar]
- Deshpande G, Libero LE, Sreenivasan KR, Deshpande HD, Kana RK (2013): Identification of neural connectivity signatures of autism using machine learning. Front Hum Neurosci 7:670. [DOI] [PMC free article] [PubMed] [Google Scholar]
- Dichter GS, Belger A (2007): Social stimuli interfere with cognitive control in autism. NeuroImage 35:1219–1230. [DOI] [PMC free article] [PubMed] [Google Scholar]
- Dickstein DP, Pescosolido MF, Reidy BL, Galvan T, Kim KL, Seymour KE, Laird AR (2013): Developmental meta‐analysis of the functional neural correlates of autism spectrum disorders. J Am Acad Child Adolescent Psychiatry 52:279–289. e16. [DOI] [PMC free article] [PubMed] [Google Scholar]
- Dierker DL, Feczko E, Pruett JR Jr, Petersen SE, Schlaggar BL, Constantino JN, Harwell JW, Coalson TS, Van Essen DC (2013): Analysis of cortical shape in children with simplex autism. Cereb Cortex. [DOI] [PMC free article] [PubMed] [Google Scholar]
- Dimartino A, Ross K, Uddin LQ, Sklar A, Castellanos FX, Milham MP (2009): Functional brain correlates of social and nonsocial processes in autism spectrum disorders: An activation likelihood estimation meta‐analysis. Biol Psychiatry 65:63–74. [DOI] [PMC free article] [PubMed] [Google Scholar]
- Duerden EG, Mak‐Fan KM, Taylor MJ, Roberts SW (2012): Regional differences in grey and white matter in children and adults with autism spectrum disorders: An activation likelihood estimate (ALE) meta‐analysis. Autism Res 5:49–66. [DOI] [PubMed] [Google Scholar]
- Dziobek I, Bahnemann M, Convit A, Heekeren HR (2010): The role of the fusiform‐amygdala system in the pathophysiology of autism. Arch Gen Psychiatry 67:397–405. [DOI] [PubMed] [Google Scholar]
- Easton A, Emery N (2004): Cognitive Neuroscience of Social Behaviour. NY, NY: Psychology Press. [Google Scholar]
- Ebisch SJ, Gallese V, Willems RM, Mantini D, Groen WB, Romani GL, Buitelaar JK, Bekkering H (2011): Altered intrinsic functional connectivity of anterior and posterior insula regions in high‐functioning participants with autism spectrum disorder. Hum Brain Mapp 32:1013–1028. [DOI] [PMC free article] [PubMed] [Google Scholar]
- Ecker C, Marquand A, Mourao‐Miranda J, Johnston P, Daly EM, Brammer MJ, Maltezos S, Murphy CM, Robertson D, Williams SC, Murphy DG (2010): Describing the brain in autism in five dimensions–magnetic resonance imaging‐assisted diagnosis of autism spectrum disorder using a multiparameter classification approach. J Neurosci 30:10612–10623. [DOI] [PMC free article] [PubMed] [Google Scholar]
- Eickhoff SB, Bzdok D, Laird AR, Kurth F, Fox PT (2012): Activation likelihood estimation meta‐analysis revisited. NeuroImage 59:2349–2361. [DOI] [PMC free article] [PubMed] [Google Scholar]
- Eickhoff SB, Bzdok D, Laird AR, Roski C, Caspers S, Zilles K, Fox PT (2011): Co‐activation patterns distinguish cortical modules, their connectivity and functional differentiation. NeuroImage 57:938–949. [DOI] [PMC free article] [PubMed] [Google Scholar]
- Eickhoff SB, Laird AR, Grefkes C, Wang LE, Zilles K, Fox PT (2009): Coordinated‐based activation likelihood estimation meta‐analysis of neuroimaging data: A random‐effects approach based on empirical estimates of spatial uncertainty. Hum Brain Mapp 30:2907–2926. [DOI] [PMC free article] [PubMed] [Google Scholar]
- Enders CK, Tofighi D (2007): Centering predictor variables in cross‐sectional multilevel models: A new look at an old issue. Psychol Met 12:121–138. [DOI] [PubMed] [Google Scholar]
- Fischl B (2012): FreeSurfer. Neuroimage 62:774–781. [DOI] [PMC free article] [PubMed] [Google Scholar]
- Fischl B, Salat DH, van der Kouwe AJ, Makris N, Segonne F, Quinn BT, Dale AM (2004): Sequence‐independent segmentation of magnetic resonance images. Neuroimage 23:S69–S84. [DOI] [PubMed] [Google Scholar]
- Fiske ST, Taylor SE (1991): Social Cognition. NY: McGraw‐Hill; p 15–16. [Google Scholar]
- Fletcher PC, Happe F, Frith U, Baker SC, Dolan RJ, Frackowiak RS, Frith CD (1995): Other minds in the brain: A functional imaging study of “theory of mind” in story comprehension. Cognition 57:109–128. [DOI] [PubMed] [Google Scholar]
- Freitag CM, Konrad C, Häberlen M, Kleser C, von Gontard A, Reith W, Troje NF, Krick C (2008): Perception of biological motion in autism spectrum disorders. Neuropsychologia 46:1480–1494. [DOI] [PubMed] [Google Scholar]
- Frith CD, Frith U (2008): Implicit and explicit processes in social cognition. Neuron 60:503–510. [DOI] [PubMed] [Google Scholar]
- Gallagher HL, Frith CD (2003): Functional imaging of 'theory of Mind'. Trends Cogn Sci 7:77–83. [DOI] [PubMed] [Google Scholar]
- Gebauer L, Skewes J, Westphael G, Heaton PF, Vuust P (2014): Intact brain processing of musical emotions in autism spectrum disorder, but more cognitive load and arousal in happy vs. sad music. Frontiers in Neuroscience 8:1–10. [DOI] [PMC free article] [PubMed] [Google Scholar]
- Gervais H, Belin P, Boddaert N, Leboyer M, Coez A, Sfaello I, Barthelemy C, Brunelle F, Samson Y, Zilbovicius M (2004): Abnormal cortical voice processing in autism. Nat Neurosci 7:801–802. [DOI] [PubMed] [Google Scholar]
- Giedd JN, Blumenthal J, Jeffries NO, Castellanos FX, Liu H, Zijdenbos A, Paus T, Evans AC, Rapoport JL (1999): Brain development during childhood and adolescence: A longitudinal MRI study. Nat Neurosci 2:861–863. [DOI] [PubMed] [Google Scholar]
- Gotts SJ, Simmons WK, Milbury LA, Wallace GL, Cox RW, Martin A (2012): Fractionation of social brain circuits in autism spectrum disorders. Brain 160. [DOI] [PMC free article] [PubMed] [Google Scholar]
- Greve DN (2011): An absolute beginner's guide to surface‐and voxel‐based morphometric analysis. p 7–13.
- Greimel E, Schulte TM, Fink, G.R , Piefke, M, Herpertz‐Dahlmann, B , Konrad, K (2010): Development of neural correlates of empathy from childhood to early adulthood: An fMRI study in boys and adult men. Journal of Neural Transmission 117:781–791. [DOI] [PubMed] [Google Scholar]
- Hadjikhani N, Joseph RM, Manoach DS, Naik P, Snyder J, Dominick K, Hoge R, Van den Stock J, Flusberg HT, De Gelder B (2009): Body expressions of emotion do not trigger fear contagion in autism spectrum disorder. Soc Cogn Affect Neurosci 4:70–78. [DOI] [PMC free article] [PubMed] [Google Scholar]
- Hadjikhani N, Joseph RM, Snyder J, Chabris CF, Clark J, Steele S, McGrath L, Vangel M, Aharon I, Feczko E (2004): Activation of the fusiform gyrus when individuals with autism spectrum disorder view faces. NeuroImage 22:1141–1150. [DOI] [PubMed] [Google Scholar]
- Hadjikhani N, Joseph RM, Snyder J, Tager‐Flusberg H (2006): Anatomical differences in the mirror neuron system and social cognition network in autism. Cereb Cortex 16:1276–1282. [DOI] [PubMed] [Google Scholar]
- Hall GBC, Szechtman H, Nahmias C (2003): Enhanced salience and emotion recognition in autism: A PET study. American Journal of Psychiatry 160:1439–1441. [DOI] [PubMed] [Google Scholar]
- Happe F, Ehlers S, Fletcher P, Frith U, Johansson M, Gillberg C, Dolan R, Frackowiak R, Frith C (1996): 'Theory of mind' in the brain. Evidence from a PET scan study of Asperger syndrome. Neuroreport 8:197. [DOI] [PubMed] [Google Scholar]
- Hubl D, Bolte S, Feineis‚ ÄìMatthews S, Lanfermann H, Federspiel A, Strik W, Poustka F, Dierks T (2003): Functional imbalance of visual pathways indicates alternative face processing strategies in autism. Neurology 61:1232–1237. [DOI] [PubMed] [Google Scholar]
- Iacoboni M, Dapretto M (2006): The mirror neuron system and the consequences of its dysfunction. Nat Rev Neurosci 7:942–951. [DOI] [PubMed] [Google Scholar]
- Jennings RG, Van Horn JD (2012): Publication bias in neuroimaging research: Implications for meta‐analyses. Neuroinformatics 10:67–80. [DOI] [PMC free article] [PubMed] [Google Scholar]
- Jiao Y, Chen R, Ke X, Chu K, Lu Z, Herskovits EH (2010): Predictive models of autism spectrum disorder based on brain regional cortical thickness. Neuroimage 50:589–599. [DOI] [PMC free article] [PubMed] [Google Scholar]
- Kaiser MD, Hudac CM, Shultz S, Lee SM, Cheung C, Berken AM, Deen B, Pitskel NB, Sugrue DR, Voos AC (2010): Neural signatures of autism. Proc Natl Acad Sci 107:21223–21228. [DOI] [PMC free article] [PubMed] [Google Scholar]
- Kana R, Libero LE, Hu CP, Deshpande HD, Colburn JS (2014): Functional brain networks and white matter underlying Theory‐of‐Mind in autism. Soc Cogn Affect Neurosci 9:98–105. [DOI] [PMC free article] [PubMed] [Google Scholar]
- Kana RK, Keller TA, Minshew NJ, Just MA (2007): Inhibitory control in high‐functioning autism: Decreased activation and underconnectivity in inhibition networks. Biol Psychiatry 62:198–206. [DOI] [PMC free article] [PubMed] [Google Scholar]
- Kana R, Keller TA, Cherkassky VL, Minshew NJ, Just MA (2009): Atypical frontal‐posterior synchronization of Theory of Mind regions in autism during mental state attribution. Social Neuroscience 4:135–152. [DOI] [PMC free article] [PubMed] [Google Scholar]
- Kana R, Travers B (2012): Neural substrates of interpreting actions and emotions from body postures. Social Cognitive and Affective Neuroscience 7:446–456. [DOI] [PMC free article] [PubMed] [Google Scholar]
- Kennedy DP, Courchesne E (2008): Functional abnormalities of the default network during self‐and other‐reflection in autism. Social Cognitive and Affective Neuroscience 3:177–190. [DOI] [PMC free article] [PubMed] [Google Scholar]
- Kennedy DP, Adolphs R (2012): The social brain in psychiatric and neurological disorders. Trends Cogn Sci 16:559–572. [DOI] [PMC free article] [PubMed] [Google Scholar]
- Kleinhans NM, Richards T, Sterling L, Stegbauer KC, Mahurin R, Johnson LC, Greenson J, Dawson G, Aylward E (2008): Abnormal functional connectivity in autism spectrum disorders during face processing. Brain 131:1000–1012. [DOI] [PubMed] [Google Scholar]
- Kleinhans NM, Johnson LC, Richards T, Mahurin R, Greenson J, Dawson G, Aylward E (2009): Reduced neural habituation in the amygdala and social impairments in autism spectrum disorders. American Journal of Psychiatry 166:467–475. [DOI] [PubMed] [Google Scholar]
- Kliemann D, Rosenblau G, Bölte S, Heekeren HR, Dziobek I (2013): Face puzzle—two new video‐based tasks for measuring explicit and implicit aspects of facial emotion recognition. Front Psychol 4:376. [DOI] [PMC free article] [PubMed] [Google Scholar]
- Kosaka H, Omori M, Munesue T, Ishitobi M, Matsumura Y, Takahashi T, Narita K, Murata T, Saito DN, Uchiyama H, Morita T, Kikuchi M, Mizukami K, Okazawa H, Sadato N, Wada Y (2010): Smaller insula and inferior frontal volumes in young adults with pervasive developmental disorders. Neuroimage 50:1357–1363. [DOI] [PubMed] [Google Scholar]
- Koshino H, Kana RK, Keller TA, Cherkassky VL, Minshew NJ, Just MA (2008): fMRI investigation of working memory for faces in autism: Visual coding and underconnectivity with frontal areas. Cerebral Cortex 18:289–300. [DOI] [PMC free article] [PubMed] [Google Scholar]
- Knaus TA, Silver AM, Lindgren KA, Hadjikhani N, Tager‐Flusberg H (2008): fMRI activation during a language task in adolescents with ASD. Journal of the International Neuropsychological Society 14:967–979. [DOI] [PMC free article] [PubMed] [Google Scholar]
- Laird AR, Robinson JL, McMillan KM, Tordesillas‐Gutiérrez D, Moran ST, Gonzales SM, Ray KL, Franklin C, Glahn DC, Fox PT (2010): Comparison of the disparity between Talairach and MNI coordinates in functional neuroimaging data: Validation of the Lancaster transform. Neuroimage 51:677–683. [DOI] [PMC free article] [PubMed] [Google Scholar]
- Libero LE, DeRamus TP, Deshpande HD, Kana RK (2014): Surface‐based morphometry of the cortical architecture of autism spectrum Disorders: Volume, thickness, area, and gyrification. Neuropsychologia [DOI] [PubMed] [Google Scholar]
- Lombardo MV, Chakrabarti B, Bullmore ET, Sadek SA, Pasco G, Wheelwright SJ, Suckling J, Baron‐Cohen S (2010): Atypical neural self‐representation in autism. Brain 133:611–624. [DOI] [PubMed] [Google Scholar]
- Martineau J, Andersson F, Barthélémy C, Cottier J‐P, Destrieux C (2010): Atypical activation of the mirror neuron system during perception of hand motion in autism. Brain Research 1320:168–175. [DOI] [PubMed] [Google Scholar]
- McAlonan GM, Cheung V, Cheung C, Suckling J, Lam GY, Tai KS, Yip L, Murphy DG, Chua SE (2005): Mapping the brain in autism. A voxel‐based MRI study of volumetric differences and intercorrelations in autism. Brain 128:268–276. [DOI] [PubMed] [Google Scholar]
- Mechelli A, Price CJ, Friston KJ, Ashburner J (2005): Voxel‐based morphometry of the human brain: Methods and applications. Curr Med Imag Rev 1:105–113. [Google Scholar]
- Morita T, Kosaka H, Saito DN, Ishitobi M, Munesue T, Itakura S, Omori M, Okazawa H, Wada Y, Sadato N (2012): Emotional responses associated with self‐face processing in individuals with autism spectrum disorders: An fMRI study. Social Neuroscience 7:223–239. [DOI] [PubMed] [Google Scholar]
- Nickl‐Jockschat T, Habel U, Maria Michel T, Manning J, Laird AR, Fox PT, Schneider F Eickhoff SB (2012): Brain structure anomalies in autism spectrum disorder—a meta‐analysis of VBM studies using anatomic likelihood estimation. Hum Brain Mapp 33:1470–1489. [DOI] [PMC free article] [PubMed] [Google Scholar]
- Nordahl CW, Dierker D, Mostafavi I, Schumann CM, Rivera SM, Amaral DG, Van Essen DC (2007): Cortical folding abnormalities in autism revealed by surface‐based morphometry. J Neurosci 27:11725–11735. [DOI] [PMC free article] [PubMed] [Google Scholar]
- Oberman L, Ramachandran V (2007): The simulating social mind: The role of the mirror neuron system and simulation in the social and communicative deficits of autism spectrum disorders. Psychol Bull 133:310. [DOI] [PubMed] [Google Scholar]
- Oberman LM, Hubbard EM, McCleery JP, Altschuler EL, Ramachandran VS, Pineda JA (2005): EEG evidence for mirror neuron dysfunction in autism spectrum disorders. Cogn Brain Res 24:190–198. [DOI] [PubMed] [Google Scholar]
- Paakki JJ, Rahko J, Long X, Moilanen I, Tervonen O, Nikkinen J, Starck T, Remes J, Hurtig T, Haapsamo H, Jussila K, Kuusikko‐Gauffin S, Mattila ML, Zang Y, Kiviniemi V (2010): Alterations in regional homogeneity of resting‐state brain activity in autism spectrum disorders. Brain Res 1321:169–179. [DOI] [PubMed] [Google Scholar]
- Pelphrey KA, Morris JP, McCarthy G (2005): Neural basis of eye gaze processing deficits in autism. Brain 128:1038–1048. [DOI] [PubMed] [Google Scholar]
- Pelphrey KA, Morris JP, McCarthy G, LaBar KS (2007): Perception of dynamic changes in facial affect and identity in autism. Social Cognitive and Affective Neuroscience 2:140–149. [DOI] [PMC free article] [PubMed] [Google Scholar]
- Pelphrey KA, Carter EJ (2008): Brain mechanisms for social perception. Ann NY Acad Sci 1145:283–299. [DOI] [PMC free article] [PubMed] [Google Scholar]
- Pelphrey KA, Shultz S, Hudac CM, Vander Wyk BC (2011): Constraining heterogeneity: The social brain and its development in autism spectrum disorder. J Child Psychol Psychiatry 52:631–644. [DOI] [PMC free article] [PubMed] [Google Scholar]
- Pierce K, Muller RA, Ambrose J, Allen G, Courchesne E (2001): Face processing occurs outside the fusiform 'face area' in autism: Evidence from functional MRI. Brain 124:2059–2073. [DOI] [PubMed] [Google Scholar]
- Pierce K (2004): The brain response to personally familiar faces in autism: Findings of fusiform activity and beyond. Brain 127:2703–2716. [DOI] [PubMed] [Google Scholar]
- Pierce K, Redcay E (2008): Fusiform function in children with an autism spectrum disorder is a matter of “who”. Biol Psychiatry 64:552–560. [DOI] [PMC free article] [PubMed] [Google Scholar]
- Pinkham AE, Hopfinger JB, Pelphrey KA, Piven J, Penn DL (2008): Neural bases for impaired social cognition in schizophrenia and autism spectrum disorders. Schizophrenia Res 99:164–175. [DOI] [PMC free article] [PubMed] [Google Scholar]
- Radeloff D, Ciaramidaro A, Siniatchkin M, Hainz D, Schlitt S, Weber B, Poustka F, Bölte S, Walter H, Freitag CM (2014): Structural alterations of the social brain: A comparison between schizophrenia and autism. PloS One 9:e106539. [DOI] [PMC free article] [PubMed] [Google Scholar]
- Robinson C, Schumacker RE (2009): Interaction effects: Centering, variance inflation factor, and interpretation issues. Multiple Linear Regression Viewpoints 35:6–11. [Google Scholar]
- Ruby P, Decety J (2003): What you believe versus what you think they believe: A neuroimaging study of conceptual perspective‐taking. Eur J Neurosci 17:2475–2480. [DOI] [PubMed] [Google Scholar]
- Sasson NJ, Touchstone EW (2014): Visual attention to competing social and object images by preschool children with autism spectrum disorder. J Autism Dev Disord 44:584–592. [DOI] [PubMed] [Google Scholar]
- Saxe R, Kanwisher N (2003): People thinking about thinking people: The role of the temporo‐parietal junction in 'theory of mind'. NeuroImage 19:1835–1842. [DOI] [PubMed] [Google Scholar]
- Schneider K, Pauly KD, Gossen A, Mevissen L, Michel TM, Gur RC, Schneider F, Habel U (2012) Neural correlates of moral reasoning in autism spectrum disorder. Social Cognitive and Affective Neuroscience. [DOI] [PMC free article] [PubMed]
- Schilbach L, Bzdok D, Timmermans B, Fox PT, Laird AR, Vogeley K, Eickhoff SB (2012): Introspective minds: Using ALE meta‐analyses to study commonalities in the neural correlates of emotional processing, social & unconstrained cognition. PloS One 7:e30920. [DOI] [PMC free article] [PubMed] [Google Scholar]
- Schultz RT (2005): Developmental deficits in social perception in autism: The role of the amygdala and fusiform face area. Int J Dev Neurosci 23:125–141. [DOI] [PubMed] [Google Scholar]
- Schumann CM, Barnes CC, Lord C, Courchesne E (2009): Amygdala enlargement in toddlers with autism related to severity of social and communication impairments. Biol Psychiatry 66:942–949. [DOI] [PMC free article] [PubMed] [Google Scholar]
- Schumann CM, Bloss CS, Barnes CC, Wideman GM, Carper RA, Akshoomoff N, Pierce K, Hagler D, Schork N, Lord C, Courchesne E (2010): Longitudinal magnetic resonance imaging study of cortical development through early childhood in autism. J Neurosci 30:4419–4427. [DOI] [PMC free article] [PubMed] [Google Scholar]
- Silani G, Bird G, Brindley R, Singer T, Frith C, Frith U (2008): Levels of emotional awareness and autism: An fMRI study. Soc Neurosci 3:97–112. [DOI] [PubMed] [Google Scholar]
- Spencer M, Holt R, Chura L, Suckling J, Calder A, Bullmore E, Baron‐Cohen S (2011): A novel functional brain imaging endophenotype of autism: The neural response to facial expression of emotion. Transl Psychiatry 1:e19. [DOI] [PMC free article] [PubMed] [Google Scholar]
- Stanfield A, McIntosh A, Spencer M, Philip R, Gaur S, Lawrie S (2008): Towards a neuroanatomy of autism: A systematic review and meta‐analysis of structural magnetic resonance imaging studies. Eur Psychiatry 23:289–299. [DOI] [PubMed] [Google Scholar]
- Sugranyes G, Kyriakopoulos M, Corrigall R, Taylor E, Frangou S (2011): Autism spectrum disorders and schizophrenia: Meta‐analysis of the neural correlates of social cognition. PloS One 6:e25322. [DOI] [PMC free article] [PubMed] [Google Scholar]
- Turkeltaub PE, Eickhoff SB, Laird AR, Fox M, Wiener M, Fox P (2012): Minimizing within‐experiment and within‐group effects in activation likelihood estimation meta‐analyses. Hum Brain Mapp 33:1–13. [DOI] [PMC free article] [PubMed] [Google Scholar]
- Uddin LQ, Davies MS, Scott AA, Zaidel E, Bookheimer SY, Iacoboni M, Dapretto M (2008): Neural basis of self and other representation in autism: An FMRI study of self‐face recognition. PloS one 3:e3526. [DOI] [PMC free article] [PubMed] [Google Scholar]
- Uddin LQ, Menon V (2009): The anterior insula in autism: Under‐connected and under‐examined. Neurosci Biobehav Rev 33:1198–1203. [DOI] [PMC free article] [PubMed] [Google Scholar]
- Vaidya CJ, Foss‐Feig J, Shook D, Kaplan L, Kenworthy L, Gaillard WD (2011): Controlling attention to gaze and arrows in childhood: An fMRI study of typical development and Autism Spectrum Disorders. Developmental Science 14:911–924. [DOI] [PubMed] [Google Scholar]
- Via E, Radua J, Cardoner N, Happé F, Mataix‐Cols D (2011): Meta‐analysis of gray matter abnormalities in autism spectrum disorder: Should Asperger disorder be subsumed under a broader umbrella of autistic spectrum disorder? Arch Gen Psychiatry 68:409–418. [DOI] [PubMed] [Google Scholar]
- Vogeley K, Bussfeld P, Newen A, Herrmann S, Happe F, Falkai P, Maier W, Shah N, Fink G, Zilles K (2001): Mind reading: Neural mechanisms of theory of mind and self‐perspective. NeuroImage 14:170–181. [DOI] [PubMed] [Google Scholar]
- Wang AT, Dapretto M, Hariri AR, Sigman M, Bookheimer SY (2004): Neural correlates of facial affect processing in children and adolescents with autism spectrum disorder. Journal American Academy of Child and Adolescent Psychiatry 43:481. [DOI] [PubMed] [Google Scholar]
- Wang AT, Lee SS, Sigman M, Dapretto M (2006): Developmental changes in the neural basis of interpreting communicative intent. Social Cognitive and Affective Neuroscience 1:107–121. [DOI] [PMC free article] [PubMed] [Google Scholar]
- Wang R, Benner T, Sorensen AG, Wedeen VJ (Diffusion toolkit: A software package for diffusion imaging data processing and tractography). In; 2007.
- Wallace GL, Dankner N, Kenworthy L, Giedd JN, Martin A (2010): Age‐related temporal and parietal cortical thinning in autism spectrum disorders. Brain 133:3745–3754. [DOI] [PMC free article] [PubMed] [Google Scholar]
- Williams JH, Waiter GD, Gilchrist A, Perrett DI, Murray AD, Whiten A (2006): Neural mechanisms of imitation and 'mirror neuron' functioning in autistic spectrum disorder. Neuropsychologia 44:610–621. [DOI] [PubMed] [Google Scholar]
- Yamasaki S, Yamasue H, Abe O, Suga M, Yamada H, Inoue H, Kuwabara H, Kawakubo Y, Yahata N, Aoki S, Kano Y, Kato N, Kasai K (2010): Reduced gray matter volume of pars opercularis is associated with impaired social communication in high‐functioning autism spectrum disorders. Biol Psychiatry 68:1141–1147. [DOI] [PubMed] [Google Scholar]
- Yucel GH, Belger A, Bizzell J, Parlier M, Adolphs R, Piven J (2014): Abnormal neural activation to faces in the parents of children with autism. Cereb Cortex 147. [DOI] [PMC free article] [PubMed] [Google Scholar]
- Zachariou V, Safiullah Z, Ungerleider L (2015): The FFA can process a non‐face category of objects as robustly as faces. J Vision 15:424–424. [Google Scholar]
- Zalla T, Sperduti M (2013): The amygdala and the relevance detection theory of autism: An evolutionary perspective. Front Hum Neurosci 7:894. [DOI] [PMC free article] [PubMed] [Google Scholar]
Associated Data
This section collects any data citations, data availability statements, or supplementary materials included in this article.
Supplementary Materials
Supplementary Information