

Abstract
The purpose of this study was to evaluate thermal and near-infrared (NIR) reflectance imaging methods for the assessment of the activity of root caries lesions. In addition, changes in the lesion structure were monitored with polarization sensitive optical coherence tomography (PS-OCT). Artificial bovine and natural root caries lesions were imaged with PS-OCT, and their dehydration rate was measured with thermal and NIR cameras. The lesion activity of the natural root caries samples was also assessed by two clinicians by conventional means according to ICDAS II guidelines. The thickness of the highly mineralized transparent surface layer measured using PS-OCT increased and the area enclosed by the time-temperature curve, ΔQ, measured with thermal imaging decreased significantly with longer periods of remineralization in simulated dentin lesions, but the NIR reflectance intensity differences, ΔI, failed to show any significant relationship with the degree of remineralization. The PS-OCT algorithm for the automated assessment of remineralization successfully detected the highly mineralized surface layer on both natural and simulated lesions. Thermal imaging provided the most accurate diagnosis of root caries lesion activity. These results demonstrate that thermal imaging and PS-OCT may be ideally suited for the nondestructive root caries lesion activity during a clinical examination.
Keywords: dentin, root caries, thermal, near-infrared, optical coherence tomography
1. Introduction
Exposed dentin is a risk factor for root caries and dentin hypersensitivity.[1–4] Etiologies of exposed dentin include loss of overlying enamel and gingival recession due to loss of periodontal structures.[3, 4] It has been reported that dentin exposure increases significantly with age, inadequate oral hygiene and excessive tooth brushing.[5] The abrasive and erosive wear properties of dentin are significantly lower than those of enamel due to the higher organic content and more reactive mineral phase.[6] Dentin surfaces are more susceptible to carious attack than enamel surfaces and the fluid flow within dentinal tubules can induce nociceptor activation in the pulp.[7, 8] It has been well established that early root caries and dentin hypersensitivity can be treated via non-surgical approaches such as fluoride application; the permeability and reactivity of exposed dentin surfaces may be modified so that they become less susceptible to future cariogenic challenges and dentin hypersensitivity.[9, 10] Therefore, it is essential to have non-destructive methods to assess the condition of the exposed dentin in order to determine whether the lesion requires chemical or surgical intervention.
It is extremely difficult to detect early root caries due to its rapid progression and lack of reliable diagnostic techniques.[9] The international Caries Detection and Assessment System (ICDAS) coordinating committee and Ekstrand et al. proposed clinical scoring systems for assessing root caries lesion activity.[11, 12] However, the clinical methods for root caries lesion activity assessment lack histological validation and are composed of visual and tactile exams, which are prone to subjective bias and interference from staining.[13] Histological analyses for lesion assessment such as transverse microradiography (TMR) and polarized light microscopy (PLM) require destruction of the tooth and are not suitable for use in-vivo. Accurate diagnosis of early root caries and non-carious cervical lesions (NCCL) will allow clinicians to apply appropriate treatments for occlusion of dentinal tubules and restoration of the lost tooth structure.
Optical coherence tomography (OCT) is a non-invasive technique for creating cross-sectional images of internal biological structures. Polarization sensitivity is particularly valuable for resolving the structure of early caries lesions because caries lesions strongly scatter incident polarized light and the image in the polarization axis orthogonal to that of the incident polarization can provide improved lesion contrast. Polarization-sensitive OCT (PS-OCT) has been successfully used to acquire images of both artificial and natural caries lesions, assess their severity in depth and assess the remineralization of such lesions on enamel and dentin.[14–16] Even though the penetration of near-infrared (NIR) light is markedly reduced in dentin due to higher light scattering and absorption, PS-OCT can effectively be used to discriminate demineralized dentin from sound dentin and cementum.[17] PS-OCT has also been used to measure remineralization on dentin surfaces and to detect the formation of a highly mineralized layer on the lesion surface after exposure to a remineralization solution.[16] In previous studies, we developed approaches to automatically detect the highly mineralized surface layer of enamel lesions exposed to remineralization solutions and measure its thickness with high accuracy.[18] In this study, we modified the algorithm to automatically detect and measure the remineralization in simulated dentin lesions and natural root caries lesions.
The organic scaffold and dentinal tubules are occupied by mostly water when hydrated.[22] The capacity of water retention of dentin increases with the increase in severity of demineralization and the size of dentinal tubules.[23] Therefore, loss of mobile water from the lesion and sound dentin is likely to be highly dependent on the structure and mineral content of the exposed dentin surface. The optical changes associated with water loss have been investigated via thermal imaging and NIR imaging for enamel caries lesions.[24–26] The influence of hydration on dentin lesions can also be investigated as an indirect indicator of the decreased permeability of water due to remineralization.
Evaporation of water from a lesion is an endothermic process, which causes a temperature decrease followed by a recovery to thermal equilibrium as the lesion becomes dry. Kaneko et al. and Zakian et al. carried out thermal imaging studies using an infrared camera and an air-jet for evaporation on occlusal and smooth natural tooth enamel surfaces.[24, 27] In our most recent study, the thermal imaging via dehydration was also found to be suitable for detection of remineralization of enamel.[28]
Near-infrared imaging has also been exploited for caries detection since sound enamel is transparent in the NIR and the scattering coefficient increases exponentially with increasing mineral loss.[29] Zakian et al. showed that the reflectance from sound tooth areas decreases at longer wavelengths where water absorption is higher.[30] We demonstrated that the rate of water evaporation from enamel could be analyzed for the assessment of remineralization.[28] However, sound dentin manifests higher scattering and absorption coefficients, almost an order of magnitude higher than enamel, due to the presence of dentinal tubules of 1 – 3 μm in diameter and an organic matrix largely composed of collagen.[31] It is anticipated that the high water content of dentin increases the lesion contrast during the dehydration process. In this study, PS-OCT was used to measure the severity and the thickness of the highly mineralized surface zone of simulated dentin and natural root caries lesions. In addition, lesion dehydration rates were measured using thermal and near-infrared reflectance imaging with the aim of developing new methods for the assessment of lesion activity on root surfaces.
2. Material and methods
In this study, 2 sets of samples were used: simulated bovine dentin lesion samples and natural human root caries lesion samples. Figure 1 shows a flowchart of the study design employed.
Figure 1.

Flowchart of the study design.
2.1. Simulated Dentin Lesion Sample Preparation
Dentin blocks (n = 30), approximately 8 – 12 mm in length with a width of 2 mm and a thickness of 2 mm were prepared from extracted bovine incisors acquired from a slaughterhouse. The bovine enamel was removed from the outer surface towards the dentinoenamel junction (DEJ) exposing the dentin and the surfaces of the bovine dentin blocks were ground to a 9 μm finish to create a smooth dentin surface. Each sample was partitioned into six windows (1 sound control, 4 lesion and 1 remineralization control) by etching small incisions 1.8 mm apart across each of the dentin blocks using a laser. Incisions were etched using a transverse excited atmospheric pressure (TEA) CO2 laser, an Impact 2500, GSI Lumonics (Rugby, UK), operating at 9.3 μm with a pulse duration of 15 μs, a pulse repetition rate of 200 Hz and a fluence of 20 J/cm2.
A thin layer of acid-resistant varnish in the form of nail polish, Revlon (New York, NY), was applied to protect the sound and remineralization control windows before exposure to the demineralization solution. Two groups (n = 15 per group) of dentin samples each with four exposed lesion windows were immersed in 45 mL aliquots of the demineralization solution for 8 and 24 hours, respectively. The demineralization solution, which was maintained at 37°C and pH 4.9, was composed of 2.0 mmol/L calcium, 2.0 mmol/L phosphate and 0.075 mol/L acetate. After the demineralization period, the acid resistant varnish was removed by immersion in acetone in an ultrasonic bath for 15 minutes and the acid-resistant varnish was applied again to the sound and lesion windows.
Sample windows were subsequently exposed to an acidic remineralization solution for 4, 8 or 12-days by covering appropriate windows with acid resistant varnish at each time point. It has been hypothesized that the lower pH reduces preferential deposition of mineral in the outer enamel, enhancing remineralization of the lesion body.[32] This model has only been previously applied to enamel, and to the best of our knowledge, this is the first time it has been applied to dentin. The acidic remineralization solution was composed of 4.1 mmol/L calcium, 15 mmol/L phosphate, 50 mmol/L lactic acid, 20 mmol/L HEPES buffer and 2 ppm F− maintained at 37°C and a pH of 4.9.[32] The remineralization control window was exposed to the acidic remineralization solution for 12 days in order to examine its effect on sound dentin. After the 12 days of remineralization, the acid resistant varnish was removed and the samples were stored in a 0.1 % thymol solution to prevent fungal and bacterial growth.
2.2. Natural Root Caries Lesion Sample Selection and Examination
Teeth extracted from patients in the San Francisco Bay area were collected, cleaned and sterilized with Gamma radiation. Twenty-five teeth with suspected caries lesions were selected with scores of 1 or 2 based on the ICDAS II root caries lesion classification.[11] The coronal portions of the teeth were cut off and the root portions of teeth were mounted on 1.2 cm x 1.2 cm x 3 cm delrin blocks. The buccal surfaces of the cervical root portion of the teeth were scored according to the ICDAS II root caries lesion activity assessment criteria system via visual and tactile examination independently by two trained clinicians.[11] Prior to the study, clinicians had been extensively calibrated through practical exercises. Ball ended periodontal probes were used to gently check for loss of tooth structure and surface texture without damaging the tooth structure.
2.3. PS-OCT System
The PS-OCT system used in this study has been described previously.[15] An all fiber-based Optical Coherence Domain Reflectometry (OCDR) system with polarization maintaining (PM) optical fiber, high speed piezoelectric fiber-stretchers and two balanced InGaAs receivers that was designed and fabricated by Optiphase, Inc., Van Nuys, CA, USA was used to acquire the images.[33] This two-channel system was integrated with a broadband superluminescent diode (SLD) DL-CS3159A, Denselight (Jessup, MD, USA) and a high-speed XY-scanning motion controller system, ESP 300 controller with ILS100PP and 850G-HS stages, (Newport, Irvine, CA, USA) for in-vitro optical coherence tomography. A high power (15 mW) polarized SLD source operated at a center wavelength of 1317 nm with a spectral bandwidth full-width-half-maximum (FWHM) of 84 nm was used to provide an axial resolution of 9 μm in air and 6 μm in dentin (refractive index = 1.5). Light from the sample arm was focused onto the sample surface using a 20 mm focal length plano-convex lens providing a lateral resolution of approximately 20 μm.
The PS-OCT system was completely controlled using LabView™ software (National Instruments, Austin, TX, USA). Samples were dried with pressurized air for 30 seconds prior to scanning. Each B-scan consisted of 300 A-scans spaced 50 μm apart. The A-scan sweep rate was 150 Hz with a dynamic range of 48 dB and each A-scan was an average of 10 scans. The total number of data points in each A-scan was 2000 over a scan range of approximately 5 mm in air.
2.4. Calculation of Surface Layer Thickness, Shrinkage, Lesion Depth and Integrated Reflectivity (ΔR)
PS-OCT images were processed using a dedicated program constructed with LabView™ software. There was a phase shift in the PM-fiber between the two axes, so an axial position calibration was performed once prior to the study. A gold mirror was scanned at a 150 Hz sweep rate and each A-scan was an average of 100 scans. Five hundred A-scans were acquired at 10 μm intervals over the entire scan range to determine the required axial position adjustments and the axial position of the cross-polarization scan images was adjusted to match the co-polarization scan images.
Previously employed image processing methods for surface layer detection and measurement utilized an edge detection technique using the zero-crossing first-order derivative.[18, 34] In this study, the threshold requirements for the ratio of the intensity values of the edge and the second peak were removed from the surface layer detection algorithm for dentin samples. Previous studies have shown that the integrated reflectivity, ΔR, over the estimated lesion depth positively correlates with the integrated mineral loss (volume percent mineral loss × μm), ΔZ.[35, 36] ΔR was calculated by integrating from the base of the surface layer through the entire estimated lesion body in the cross-polarization (CP) OCT images.[18] This had the added advantage of removing the contribution of the high specular reflection at the surface of the sample, which was large enough to be present even in the CP-OCT images.
Shrinkage was significant for the PS-OCT images in the zones of demineralization due to rapid dehydration after exposure to air. The simulated dentin lesions had relatively flat lesion surfaces while the natural root caries lesions had irregular lesion surfaces, thus shrinkage adjustments were only carried out for the simulated dentin lesions. The surface reflection measured in the co-polarization axis from the PS-OCT images was used to measure the shrinkage. We employed a previously developed approach to adjust for shrinkage in the lesion depth and integrated reflectivity measurements.[17] Shrinkage is expected to cause an overall loss in the integrated reflectivity from the lesion. The correction is predicated on the assumption that the additional mineral present in the dentin lesion area due to contraction from shrinkage causes no net change in reflectivity. This is a reasonable assumption since initial demineralization causes pores to be formed in the tissue that produce an increase in light scattering as the demineralization becomes more severe. The increase in light scattering reaches a plateau since pores merge and further demineralization does not increase the number or density of scattering sites.[29] Therefore, a further change in reflectivity above a certain level of mineral loss is not anticipated.
A region of interest (ROI) was specified for the sound region from each sample in order to discriminate between demineralized and sound dentin. ΔR was calculated from the selected ROI and it was compared to the ΔR of the lesions in order to reduce false-positives in lesion detection. The surface layer, lesion depth and ΔR measurements were estimated by averaging 25 A-scans from a 5 × 5 pixel region of interest. A 5 × 5 pixel median filter was applied to the final 2D projection images for improved visualization.
Three-dimensional images were constructed by compiling the post-processed images using Avizo™ 9.0 software (FEI Visualization Sciences Group, Hillsboro, OR, USA).
2.5. Dehydration Measurements
The following setup was used for the dehydration experiments of sections 2.6 and 2.7. Each sample was placed in a mount connected to a high-speed XY-scanning motion controller system, Newport ESP 300 controller & 850G-HS stages coupled with an air nozzle and a light source as shown in the first figure of reference [28]. The dehydration setup was completely automated using LabView™ software.
All surfaces of the simulated dentin lesion samples, excluding the windows, were covered with black nail polish, OPI (North Hollywood, CA, USA) in order to confine water loss to the exposed surface and prevent the transmission of light through the sides of the sample. Each simulated dentin lesion sample was immersed in the water bath for 30 seconds while being vigorously shaken to enhance water diffusion. After the sample was removed from the water bath, an image was captured as an initial reference image and the air spray was activated. The air pressure was set to 15 psi and the computer controlled air nozzle was positioned 2 cm away from the sample. Each measurement consisted of capturing a sequence of images at 4 frames per second for 30 seconds. For each measurement, the air nozzle was centered on the ROI, and this process was repeated for each window (6 times per sample).
The dehydration setup was slightly modified for the natural root caries lesion samples due to their complex anatomical structures. After the samples were removed from the water bath, the excess water on the surface of the lesions was removed with a disposable cotton roll. Seven air nozzles were positioned 5 cm away from the sample and the air pressure was set to 12 psi to ensure uniform distribution of airflow. The duration of the dehydration was set to 60 seconds instead of 30 seconds in order to ensure adequate dehydration of the natural root caries samples.
2.6. Thermal Imaging and Analysis
An infrared (IR) thermography camera, Model A65 (FLIR Systems, Wilsonville, OR, USA) sensitive from 8 – 13 μm with a resolution of 640 x 512 pixels, a thermal sensitivity of 50 mK and a lens with a 13 mm focal length was used to record temperature changes during the dehydration process. The area per pixel was approximately 0.02 mm2. The ambient room temperature, flowing air temperature and water bath temperature were approximately 21 °C (294.15 K) and were consistent throughout the experiment. The object emissivity was set to 0.92, and the atmospheric temperature was set to 294.15 K.[37] Relative humidity was set at a default value of 50%; humidity values were not recorded, but every sample was measured under the same conditions. Previous studies have shown that ΔQ, the area enclosed by the time-temperature curve, can be used as a quantitative measure of porosity and can be used to discriminate between the demineralized enamel and the remineralized or sound enamel in-vitro.[27, 28]
Thermal images were processed and analyzed using a dedicated program written in Labview™. The thermography camera outputs a series of temperature measurements over time. The initial reference temperature measurements varied slightly (± 0.5 K) due to the different emissivity, lesion structure, mineral composition and water content among windows. Calibration was carried out via matching the measurements from the initial reference image to the ambient temperature. ΔQ was calculated from the area enclosed by the initial temperature and the time-temperature curve, acquired from an average measurement of a 3 × 3 pixel ROI for each window.
2.7. NIR Reflectance Imaging and Analysis
A NIR camera, Indigo Alpha (FLIR Systems, Wilsonville, OR, USA) with an InGaAs focal plane array, a spectral sensitivity range from 900 nm to 1750 nm, a resolution of 320 x 256 pixels and an InfiniMite™ lens (Infinity, Boulder, CO, USA) was used to acquire images during the dehydration process. The area per pixel was approximately 0.003 mm2. Light from a 150 W fiber-optic illuminator FOI-1 (E Licht Company, Denver, CO, USA) was directed at the sample at an incident angle of approximately 60 ° in order to reduce specular reflection as shown in the first figure of reference [28]. Several band-pass (BP) and long-pass (LP) filters were used to provide different spectral distributions of NIR light: band-pass filters centered at 1300 nm with 90 nm bandwidth (1260–1340 nm), 1460 nm with 85 nm bandwidth (1420–1500 nm) (Spectrogon, Parsippany, NJ, USA) and long-pass filters at 1400 nm (1400–1700 nm) and 1500 nm (1500–1700 nm), FEL LP series from (Thorlabs, Newton, NJ, USA). Source to sample distance was fixed at 5 cm for all samples.
NIR reflectance images were processed and automatically analyzed using a dedicated program constructed with LabView™ software. A 5 × 5 pixel ROI was specified for each window and an average measurement was recorded for each time point. The image contrast was calculated using (IL – IS)/IL of the final image, where IS is the mean intensity of the sound dentin and IL is the mean intensity of the lesion. In addition to lesion contrast, the intensity difference, ΔI, was calculated by taking the difference of the mean intensity before and after the dehydration process.
2.8. Polarized Light Microscopy (PLM) and Transverse Microradiography (TMR)
After sample imaging was completed, 230 μm thick serial sections were cut using an Isomet 5000 saw (Buehler, IL, USA) for polarized light microscopy (PLM) and transverse microradiography (TMR). PLM was carried out using a Meiji Techno Model RZT microscope (Meiji Techno Co., LTD, Saitama, Japan) with an integrated digital camera, Canon EOS Digital Rebel XT (Canon Inc., Tokyo, Japan). The sample sections were imbibed in water and examined in the brightfield mode with crossed polarizers and a red I plate with 500 nm retardation. PLM images were acquired at 40x magnification and had a resolution of 3264 x 2448 pixels.
A custom built digital microradiography (TMR) system was used to measure the volume percent mineral content in the areas of demineralization on the tooth sections.[38] High-resolution microradiographs were taken using Cu Kα radiation from a Philips 3100 X-ray generator and a Photonics Science FDI X-ray digital imager, Microphotonics (Allentown, PA, USA). The X-ray digital imager consisted of a 1392×1040 pixel interline CCD directly bonded to a coherent micro fiber-optic coupler that transfers the light from an optimized gadolinium oxysulfide scintillator to the CCD sensor. The pixel resolution was 2.1 μm and the images were acquired at 10 frames per second. A high-speed motion control system with Newport UTM150 and 850G stages and an ESP 300 controller coupled to a video microscopy and a laser targeting system was used for precise positioning of the sample in the field of view of the imaging system. Shrinkage also confounds measurement of the integrated mineral loss. The effect of shrinkage can be compensated for in TMR by equating the depth of shrinkage with an equivalent loss of sound dentin for the simulated dentin lesion samples. Line profiles were integrated from the surface of the lesion to a depth of 150 μm subtracted by the depth of the shrinkage to ensure that the effective integrated volume was the same between zones that exhibited shrinkage and those zones did not.
2.9. Histological Validation of Lesion Activity of Natural Root Caries Lesions
PLM was used to record the location of caries lesions, the presence of an intact cementum layer and irregular surface defects such as cavitation, and TMR was used to measure changes in mineral content. If a surface layer of a similar or higher mineral content of sound dentin was present, the activity of the suspected lesion was categorized as “arrested”. If there was cavitation without any signs of caries activity (i.e., loss of mineral at surface of the lesion), the lesion was classified as a “non-carious cervical lesion”. If the lesion did not have the surface layer or had a significant loss in mineral content with a discontinuity of the surface layer, the lesion was categorized as “active”.
2.10. Statistical Analysis
Groups of the simulated dentin lesion samples were compared using repeated measures analysis of variance (ANOVA) with a Tukey–Kramer post hoc multiple comparison test. The natural root caries lesion samples were divided into two groups based on their histological assessment (section 2.9): active and non-active lesions. Imaging methods were evaluated using a paired t-test (two-tailed) and receiver operating characteristic (ROC) curves. All statistical analyses were performed with 95% confidence with Prism™ (GraphPad software, San Diego, CA).
3. Results
3.1. Simulated dentin lesion samples
Figure 2 shows the visible, PLM, TMR and PS-OCT images of a simulated dentin lesion sample from the initial 24-hour demineralization group after exposure to the remineralization solution. Unlike enamel lesions, the windows exposed to the demineralization or the remineralization solution could not be easily discriminated from the sound window by visual examination as shown in Figure 2A. The changes to the subsurface mineral structure upon demineralization and remineralization could be seen with PLM and TMR as shown in Figures 1B – 1C. There was an increase in lesion depth measured with PLM even though there was a decrease in mineral loss with increasing periods of remineralization as shown in Table 1. The highly mineralized surface layer was often difficult to distinguish from demineralization with PLM. TMR showed an increase in mineral density at the surface of the lesion with increasing periods of exposure to the remineralization solution. The acidic pH remineralization model utilized in this study produced increased mineralization in the lesion body in a similar fashion to what has been observed for enamel samples.[28]
Figure 2.
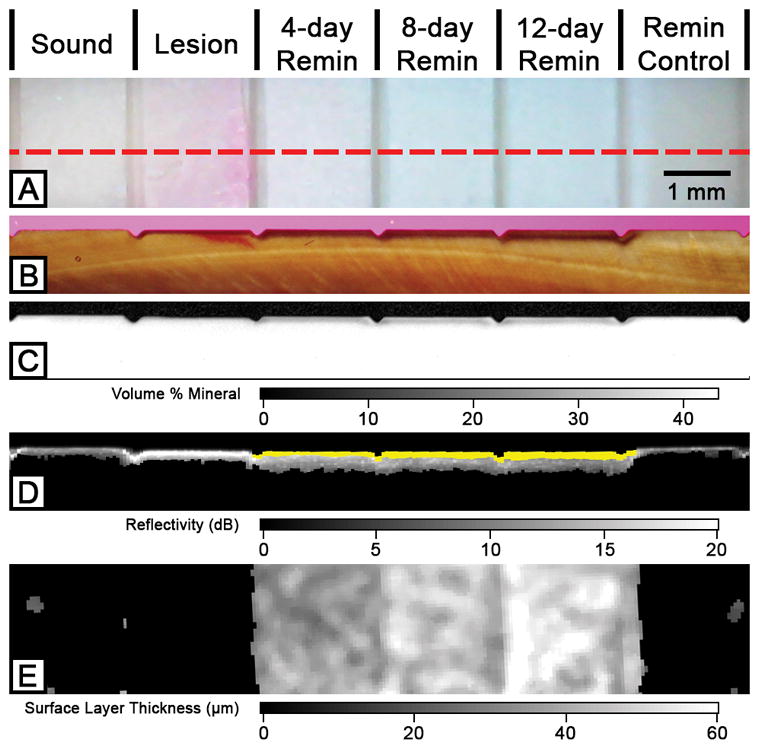
Two-dimensional projection and cross-sectional PLM, TMR and PS-OCT images of the six windows on a 24-hour demineralization sample. The red dotted line in the visible light reflectance image (A) represents the position of the section shown in (B), (C) and (D). PLM (B), TMR (C) and processed PS-OCT B-scan (D) images show an increase in transparent surface layer thickness over the periods of exposure to the remineralization solution. The transparent surface layer is highlighted in yellow (D) and shown in the 2D OCT surface projection images (E).
Table 1.
Mean ± S.D. of PS-OCT, PLM, TMR, ΔQ from thermal imaging and NIR reflectance measurements at 1400 – 1700 nm wavelength for the 8 and 24-hour demineralization groups of the simulated dentin lesion samples. Groups with the same letters are statistically similar, P > 0.05 in each row (n = 15).
| Sound | Lesion | 4-day Remin | 8-day Remin | 12-day Remin | Remin Control | |
|---|---|---|---|---|---|---|
|
24-hour demineralization (n=15)
| ||||||
| Surface Layer Thickness (PS-OCT, μm) | 0a | 0a | 43.6 ± 12.9b | 49.3 ± 11.6b,c | 53.8 ± 13.3c | 3.8 ± 10.1a |
| Shrinkage (μm) | 0a | 40.1 ± 11.9b | 30.3 ± 13.6c | 28.5 ± 13.8c | 24.9 ± 10.9c | 0.5 ± 6.2a |
| Integrated Reflectivity, ΔR (dB × μm) | 0a | 2097 ± 464b | 1661 ± 316c | 1725 ± 404c | 1602 ± 380c | 29 ± 113a |
| Lesion Depth (PLM, μm) | 0a | 57.7 ± 10.4b | 78.3 ± 12.9c | 91.7 ± 14d | 109.9 ± 25.8e | 1.2 ± 4.7a |
| Integrated Mineral Loss, ΔZ (vol% × μm) | 0a | 2138 ± 382b | 1932 ± 444c | 1817 ± 418d | 1575 ± 314e | 142 ± 376a |
| ΔQ (K × s) | 39.1 ± 14.1a | 48.5 ± 20.7b | 29.9 ± 18.9ac | 25.0 ± 14.5c | 21.3 ± 11.5c | 12.8 ± 9.2d |
| NIR Contrast | - | 0.31 ± 0.17ac | 0.46 ± 0.19b | 0.41 ± 0.24a | 0.34 ± 0.28a | −0.22 ± 0.71c |
| ΔI(t=30) | 215 ± 124a | 372 ± 240b | 512 ± 244c | 447 ± 237bc | 366 ± 203b | 112 ± 69d |
|
| ||||||
|
8-hour demineralization (n=15)
| ||||||
| Surface Layer Thickness (PS-OCT, μm) | 0a | 0a | 34.1 ± 11.8b | 35.2 ± 9.9b | 38.5 ± 12.6b | 4.2 ± 11.1a |
| Shrinkage (μm) | 0a | 19.7 ± 4.8b | 11.4 ± 5.5c | 9.4 ± 6.0d | 7.9 ± 4.9d | −0.2 ± 2.5a |
| Integrated Reflectivity, ΔR (dB × μm) | 0a | 1452 ± 166b | 1126 ± 183c | 1146 ± 196c | 1077 ± 154c | 89 ± 187a |
| Lesion Depth (PLM, μm) | 0a | 34.0 ± 3.8b | 60.5 ± 8.3c | 73.8 ± 9.9d | 78.8 ± 18.3d | 4.5 ± 9.6a |
| Integrated Mineral Loss, ΔZ (vol% × μm) | 0a | 1058 ± 266b | 770 ± 288c | 639 ± 250d | 516 ± 247e | 78 ± 265a |
| ΔQ (K × s) | 28.9 ± 14.0a | 34.6 ± 7.9b | 13.8 ± 7.2c | 11.3 ± 7.2c | 11.6 ± 7.4c | 9.7 ± 2.9c |
| NIR Contrast | - | 0.29 ± 0.14ac | 0.43 ± 0.15b | 0.41 ± 0.24a | 0.35 ± 0.32a | 0.08 ± 0.42c |
| ΔI(t=30) | 185 ± 134ac | 286 ± 130b | 319 ± 186ab | 320 ± 199ab | 279 ± 195ab | 133 ± 64c |
In our previous study, the algorithm successfully detected the surface layer in enamel with high sensitivity and specificity.[18] In this study, the algorithm was optimized for dentin and it was able to detect increased remineralization in the simulated dentin lesion samples with increasing periods of exposure to the remineralization solution as shown in Figures 1D – 1E and Table 1. The modified algorithm was able to detect remineralization successfully without any false positives and false negatives; there were a total of 150 windows from 30 samples, with 90 true positives and 60 true negatives. The thickness measurements of the surface layer with PS-OCT could not be accurately validated with histology due to the high opacity of dentin in PLM images and the absence of a distinct sharp edge to the highly mineralized surface layer in TMR images.[17]
There was considerable shrinkage in the windows that were treated with the demineralization solution in the TMR and PS-OCT images (Figures 1C – 1D). The degree of shrinkage decreased with increasing exposure to the remineralization solution with an exception of the remineralization control group as shown in Table 1. Both ΔR and the ΔZ decreased with exposure to increasing periods of remineralization for both the initial 24-hour and 8-hour demineralization models.
The time-temperature profiles of the sample from Figure 2 are shown in Figure 3A. With air-drying, most samples approached ambient temperature within 30 seconds. Figure 3A shows that the lesion window exhibited the greatest temperature drop within the first 5 seconds of air-drying and manifested the slowest recovery to equilibrium. However, the magnitude of the temperature drop and the recovery time to ambient temperature decreased significantly with exposure to increasing periods of remineralization. In addition, the remineralization control window that was only treated with the remineralization solution underwent a marked reduction in ΔQ compared to the sound window. The ΔQ measurements are shown in Figure 3B and Table 1.
Figure 3.

Typical time-temperature profiles (A) and time-NIR reflectance intensity difference profiles (C) with a 1400 nm long-pass filter over 30 seconds for the simulated dentin lesion sample shown in Figure 2. Mean ± S.D. of ΔQ (B) and ΔI measurements (D) of the 24-hour demineralization samples. Dashed line (A) represents the initial temperature and ΔQ is the area under the dashed line enclosed by the time-temperature curve. Bars not sharing any common colors were significantly different, P < 0.05 (n = 15).
NIR time-intensity difference profiles acquired at 1400 – 1700 nm wavelengths for the sample shown in Figure 2 are shown in Figure 3C. The intensity difference, ΔI, was recorded instead of raw intensity data due to differences in anatomic structure of the sample, i.e. variation in depth to pulp chamber, presence of cracks, orientation and size of dentinal tubules and organic content of the tissue. As seen in Figures 2C and 2D and Table 1, the lesion contrast and the ΔI measurements for NIR reflectance did not manifest a significant reduction among groups as the sample was treated with increasing periods of remineralization. In addition, the lesion contrast and ΔI increased after exposure to the first 4-day period of remineralization. The samples were also imaged at different wavelengths and yielded similar measurements producing no significant changes with increasing periods of remineralization.
3.2 Natural root caries lesions
Two trained clinician examiners relied on the ICDAS II lesion assessment system, which utilizes color (light/dark brown, black), texture (smooth, rough), appearance (shiny or glossy, matte or non-glossy), perception on gentle probing (soft, leathery, hard) and cavitation (loss of anatomic contour). The inter-examiner agreement was 80% agreement of diagnosis with a kappa value of 0.53, which is considered to be moderate in the strength of agreement. With the true-positive being the successful diagnosis of an active lesion, the two examiners yielded an average sensitivity of 0.38 and an average specificity of 0.83.
Images of a natural root caries lesion are shown in Figure 4. The visible image (Figure 4A) shows a cervical root caries lesion that is both light and dark brown in color, both smooth and rough in texture, both matte and non-glossy in appearance, and both soft and hard in perception on gentle probing with the presence of cavitation. PLM images (Figures 3G and 3H) show anatomical structural loss, yet they do not show a distinct surface zone indicative of an arrested lesion. TMR images (Figures 3I and 3J) show a significant difference in mineral content between two sections and it is evident that the highly mineralized surface layer is present in Figure 4J. PS-OCT images (Figures 3B – 3D) accurately estimated the lesion severity and detected the presence of the highly mineralized surface layer. The NIR reflectance image (Figure 4E) shows localized areas of high ΔI values while thermal image (Figure 4F) shows different localized areas of high ΔQ values.
Figure 4.

Visible (A), PS-OCT (B – D), NIR reflectance (E) and thermal (F) images and cross-sectional PLM and TMR images of a natural root caries lesion sample. Three-dimensional composite image (B) of processed PS-OCT images (C and D) shows the surface layer (blue) covering the underlying lesion body (orange) The red line (A) represents the active portion of the root caries lesion as shown in sections (G) and (I), and the green line (A) represents the arrested portion of the root caries lesion as shown in sections (H) and (J).
Lesion activity assessment via detection of the presence of a highly mineralized surface layer with PS-OCT yielded a sensitivity of 0.81 and a specificity of 0.67 for the natural root caries lesions. In addition, the lesion severity, ΔR, from PS-OCT was also evaluated for the root caries lesion activity assessment. The diagnostic performance of ΔR from PS-OCT, ΔI from NIR reflectance imaging and ΔQ from thermal imaging were also evaluated for the lesion activity assessment of natural root caries lesions. As shown in Figure 5 and Table 2, only the ΔQ measurements showed the significant differences between active and non-active lesion groups (P < 0.0001) from both t-test and ROC curve analyses.
Figure 5.

ROC curve analysis of three imaging modalities: PS-OCT ΔR (A), NIR reflectance ΔI (B) and Thermal ΔQ (C) measurements of the natural root caries lesion samples. AUC represents the area under the curve.
Table 2.
Mean ± S.D. and P-values for PS-OCT ΔR, NIR reflectance ΔI at 1400 – 1700 nm wavelength and thermal ΔQ measurements of the natural root caries lesion samples.
| Active (n = 16) | Non-Active (n = 9) | P-value | |
|---|---|---|---|
| ΔR (dB × μm) | 835 ± 538 | 591 ± 351 | 0.2360 |
| ΔI(t=60) | 169 ± 181 | 103 ± 116 | 0.3377 |
| ΔQ (K × s) | 18.6 ± 18.7 | 0.7 ± 0.7 | < 0.0001 |
4. Discussion
The purpose of this study was to determine whether PS-OCT, NIR reflectance and thermal imaging methods could be used to non-destructively assess lesion activity on root surfaces. In order to simulate the complex process of demineralization and remineralization that occurs in the oral cavity, we used an acidic pH remineralization model that is designed to repair the existing crystal remnants in lesions.[32] In a previous dentin remineralization study, a neutral pH remineralization model was used and there was superficial deposition of new mineral at the surface of the dentin lesion with minimal mineralization of the lesion body.[16] This model yielded far greater success in generating the highly mineralized surface layer compared to the neutral pH remineralization model; all windows of the simulated dentin lesion samples that were treated with both the demineralization and acidic remineralization solution in this study yielded highly mineralized surface layers. The acidic pH remineralization model successfully remineralized artificial dentin lesions without producing superficial mineral deposition on the lesion surface, which was observed in a previous study.[16] The increase in mineral density and the decrease in shrinkage with this acidic remineralization treatment show that this acidic remineralization model was successful as shown in Figure 2 and Table 1. It has been shown that demineralized dentin exhibits considerable shrinkage if not immersed in water due to the high percentage of collagen and the amount of shrinkage in demineralized dentin is proportional to the integrated mineral loss, ΔZ.[17]
However, this acidic remineralization model did produce an increase in the lesion depth with longer periods of remineralization. It is likely that this model initially induces further demineralization in the lesion body until fluorapatite deposition begins to form the surface layer inhibiting diffusion. PLM image (Figure 2B) of the simulated dentin lesion sample shows that the windows treated with both the demineralization and acidic remineralization solutions have lesion depths greater than the initial lesion window, while the remineralization control window appears unaffected by the remineralization solution. One can speculate that the permeability of the demineralized dentin is much higher than that of sound dentin, which can lead to the acceleration of demineralization before diffusion is inhibited by the remineralization process. The algorithm for automatic assessment of remineralization was successfully modified and applied to the PS-OCT images of the simulated dentin lesion samples to accommodate for the different refractive index (1.5) and higher scattering and absorption coefficients of dentin. The algorithm was able to detect and measure the highly mineralized surface layer automatically (Figures 1D – 1E). The measurements of ΔR and thickness of the highly mineralized surface layer suggested that they could be used to nondestructively measure lesion severity, remineralization and the activity of root caries lesions. However, the performance of the modified PS-OCT algorithm was not as high for the natural root caries lesions. The algorithm yielded a much higher sensitivity but with a lower specificity compared to the conventional root caries lesion assessment methods recommended by ICDAS II. There were several characteristics of natural root caries lesion samples that led to a significant decrease in the diagnostic performance of the algorithm. Healthy root dentin is typically encapsulated by the cementum layer, which can be mistaken for the surface layer if there is an active lesion underlying the cementum layer, and the cementum layer is significantly more acid resistant than the underlying dentin.[39] In addition, dentin and cementum are significantly weaker than enamel; their structural integrity can be much more easily compromised due to acid erosion, caries activity and mechanical abrasions.[6, 40] There was generalized loss of the cementum layer centered on the suspected root caries lesions and they were often accompanied with loss of dentin structure as well. Edges of the surrounding cementum layer appeared sharp when examined with histology and increased the reflectivity and scattering of NIR light resulting in false positives.
In a previous study, we reported that the highly mineralized surface layer plays an important role in the dehydration process of remineralized enamel lesions and that both the thermal and NIR imaging methods are suitable for detection of remineralization.[28] In this study, only ΔQ decreased as the simulated dentin lesion was exposed to the remineralization solution. Unlike the enamel lesions, which showed no significant differences in ΔQ between individual remineralization windows or between sound and remineralization windows, there were significant differences in ΔQ among different windows as shown in Figure 3B and Table 1. Another major difference is that the remineralization control window showed a large change in ΔQ compared to the sound window. This suggests that the dentinal tubules on the sound dentin surface were successfully occluded, i.e., filled with new mineral from the acidic remineralization treatment. Although there were no histological changes between the sound and the remineralization control windows in the PLM, TMR and PS-OCT analyses (Figure 2 and Table 1), there was an obvious change in thermodynamic behavior during the dehydration process. This result shows a potential application of the acidic remineralization regime for addressing dentin hypersensitivity.
We expected the NIR lesion contrast and ΔI to decrease as the lesion was exposed to the remineralization solution. Instead of a reduction in the NIR lesion contrast and ΔI, there was a significant increase after 4 days of remineralization followed by a decreasing trend in NIR lesion contrast and ΔI measurements with further remineralization as shown in Figure 3 and Table 1. Because the lesion was more severe for the 4-day remineralization window than the lesion window itself, the lesion contrast and intensity difference measurements of the 4-day remineralization window appeared significantly higher after dehydration compared to those of the initial lesion.
Thermal imaging (ΔQ) yielded the strongest diagnostic performance for assessment of the natural root caries lesions while NIR reflectance (ΔI) did not perform well. Regardless of the presence of the surface layer, ΔI was highly dependent on the underlying lesion severity. However, the ΔQ values were low, independent of the severity of the underlying lesion, if the surface layer was present. Sound root surfaces yielded low ΔQ values, most likely due to the presence of the cementum layer and occlusion of dentinal tubules from the continued exposure to the oral environment. In addition, ΔQ was not affected by the structural variations of the root surface; presence of cementum or cavitation due to abrasion did not influence ΔQ measurements.
Clinical implication of these new techniques should be straightforward. Thermal cameras have been miniaturized to the point that they are now available as attachments for cell phones. Although the dehydration and imaging setup used in this study may not be feasible in clinical practice due to its large size, each component can be miniaturized and integrated into a single handpiece to fit into a person’s mouth. The duration of the measurement can be also significantly reduced by increasing the pressure of the air and positioning air nozzles closer to the sample. Further research is required to evaluate the clinical feasibility of the new techniques for assessment of root caries lesion activity.
5. Conclusions
This study demonstrates that the infrared imaging modalities can be used to non-destructively assess root caries lesion activity. A modified PS-OCT algorithm for the automated assessment of remineralization was successful for discriminating between active and non-active root caries lesions. In addition, the highly mineralized surface layer plays an important role in the dehydration process of remineralized dentin lesions. Thermal imaging provided the best performance in root caries lesion activity assessment. NIR based imaging modalities, PS-OCT and NIR reflectance imaging, were extremely sensitive to anatomic structural variations and lesion severity. However, NIR reflectance imaging was not suitable for root caries lesion activity assessment because there was not a significant reduction in intensity with the presence of a surface layer. Therefore, PS-OCT and thermal imaging performed best for monitoring the activity of root caries lesions unlike in our earlier study on enamel lesions that yielded the highest performance for NIR reflectance imaging. Detection of remineralization with these novel methods is highly promising and extremely important for the clinical assessment of root caries lesion activity.
Acknowledgments
This work was supported by NIH/NIDCR Grants F30-DE023278, R01-DE17869 and R01-DE14698.
References
- 1.Canadian Advisory Board on Dentin Hypersensitivity. J Can Dent Assoc. 2003;69(4):221–226. [PubMed] [Google Scholar]
- 2.West NX, Lussi A, Seong J, Hellwig E. Clin Oral Investig. 2013;17(S1):9–19. doi: 10.1007/s00784-012-0887-x. [DOI] [PubMed] [Google Scholar]
- 3.Holland GR, Narhi MN, Addy M, Gangarosa L, Orchardson R. J Clin Periodontol. 1997;24(11):808–813. doi: 10.1111/j.1600-051x.1997.tb01194.x. [DOI] [PubMed] [Google Scholar]
- 4.Sumney DL, Jordan HV, Englander HR. J Periodontol. 1973;44(8):500–504. doi: 10.1902/jop.1973.44.8.500. [DOI] [PubMed] [Google Scholar]
- 5.Tugnait A, Clerehugh V. J Dent. 2001;29(6):381–394. doi: 10.1016/s0300-5712(01)00035-5. [DOI] [PubMed] [Google Scholar]
- 6.Kinney JH, Marshall SJ, Marshall GW. Crit Rev Oral Biol Med. 2003;14(1):13–29. doi: 10.1177/154411130301400103. [DOI] [PubMed] [Google Scholar]
- 7.Kawasaki K, Featherstone JD. J Dent Res. 1997;76(1):588–595. doi: 10.1177/00220345970760011001. [DOI] [PubMed] [Google Scholar]
- 8.Bignozzi I, Crea A, Capri D, Littarru C, Lajolo C, Tatakis DN. J Periodontal Res. 2014;49(2):143–163. doi: 10.1111/jre.12094. [DOI] [PubMed] [Google Scholar]
- 9.Fejerskov O, Kidd E. Dental Caries: The Disease and its Clinical Management. Blackwell; Oxford: 2003. [Google Scholar]
- 10.Brannstrom M. Oral Surg Oral Med Oral Pathol. 1966;21(4):517–526. doi: 10.1016/0030-4220(66)90411-7. [DOI] [PubMed] [Google Scholar]
- 11.Ismail A, Banting D, Eggertsson H, Ekstrand K, Ferreira-Zandona A, Longbottom C, Pitts N, Reich E, Ricketts D, Selwitz R, Sohn W, Topping G, Zero D. In: Proceedings of the Annual Indiana Conference. Stookey GK, editor. Vol. 7. Indiana University; Indianapolis, IN, USA: 2005. [Google Scholar]
- 12.Ekstrand K, Martignon S, Holm-Pedersen P. Gerodontology. 2008;25(2):67–75. doi: 10.1111/j.1741-2358.2007.00200.x. [DOI] [PubMed] [Google Scholar]
- 13.Lynch E, Beighton D. Caries Res. 1994;28(4):233–239. doi: 10.1159/000261971. [DOI] [PubMed] [Google Scholar]
- 14.Everett MJ, Colston BW, Sathyam US, Silva LBD, Fried D, Featherstone JDB. SPIE Proc. 1999;3593:177–183. [Google Scholar]
- 15.Fried D, Xie J, Shafi S, Featherstone JD, Breunig TM, Le C. J Biomed Opt. 2002;7(4):618–627. doi: 10.1117/1.1509752. [DOI] [PubMed] [Google Scholar]
- 16.Manesh SK, Darling CL, Fried D. J Biomed Opt. 2009;14(4):044002. doi: 10.1117/1.3158995. [DOI] [PubMed] [Google Scholar]
- 17.Lee C, Darling CL, Fried D. Dent Mater. 2009;25(6):721–728. doi: 10.1016/j.dental.2008.11.014. [DOI] [PMC free article] [PubMed] [Google Scholar]
- 18.Lee RC, Kang H, Darling CL, Fried D. Biomed Opt Express. 2014;5(9):2950–2962. doi: 10.1364/BOE.5.002950. [DOI] [PMC free article] [PubMed] [Google Scholar]
- 19.Schiff T, Bonta Y, Proskin HM, DeVizio W, Petrone M, Volpe AR. Am J Dent. 2000;13(3):111–115. [PubMed] [Google Scholar]
- 20.Schupbach P, Lutz F, Finger WJ. Eur J Oral Sci. 1997;105(5):414–421. doi: 10.1111/j.1600-0722.1997.tb02138.x. [DOI] [PubMed] [Google Scholar]
- 21.Suge T, Ishikawa K, Kawasaki A, Yoshiyama M, Asaoka K, Ebisu S. J Dent Res. 1995;74(4):1079–1085. doi: 10.1177/00220345950740040801. [DOI] [PubMed] [Google Scholar]
- 22.Kinney JH, Balooch M, Marshall GW, Marshall SJ. Arch Oral Biol. 1993;38(11):1003–1007. doi: 10.1016/0003-9969(93)90114-2. [DOI] [PubMed] [Google Scholar]
- 23.Ozok AR, Wu MK, ten Cate JM, Wesselink PR. J Dent Res. 2002;81(11):733–737. doi: 10.1177/0810733. [DOI] [PubMed] [Google Scholar]
- 24.Kaneko K, Matsuyama K, Nakashima S. In: Proceedings of the Annual Indiana Conference. Stookey GK, editor. Vol. 4. Indiana University; Indianapolis, IN, USA: 1999. [Google Scholar]
- 25.Usenik P, Bürmen M, Fidler A, Pernuš F, Likar B. J Dent. 2014;42(10):1242–1247. doi: 10.1016/j.jdent.2014.08.007. [DOI] [PubMed] [Google Scholar]
- 26.Ando M, Sharp N, Adams D. SPIE Proc. 2012;8348S:1–7. [Google Scholar]
- 27.Zakian CM, Taylor AM, Ellwood RP, Pretty IA. J Dent. 2010;38(10):788–795. doi: 10.1016/j.jdent.2010.06.010. [DOI] [PubMed] [Google Scholar]
- 28.Lee RC, Darling CL, Fried D. J Dent. 2015;43(8):1032–1042. doi: 10.1016/j.jdent.2015.03.005. [DOI] [PMC free article] [PubMed] [Google Scholar]
- 29.Darling CL, Huynh GD, Fried D. J Biomed Opt. 2006;11(3):34023. doi: 10.1117/1.2204603. [DOI] [PubMed] [Google Scholar]
- 30.Zakian C, Pretty I, Ellwood R. J Biomed Opt. 2009;14(6):064047. doi: 10.1117/1.3275480. [DOI] [PubMed] [Google Scholar]
- 31.Chan AC, Darling CL, Chan KH, Fried D. SPIE Proc. 2014;8929M:1–9. [Google Scholar]
- 32.Yamazaki H, Margolis HC. J Dent Res. 2008;87(6):569–574. doi: 10.1177/154405910808700612. [DOI] [PubMed] [Google Scholar]
- 33.Bush J, Davis P, Marcus MA. SPIE Proc. 2000;4204:71–80. [Google Scholar]
- 34.Lee RC, Darling CL, Fried D. SPIE Proc. 2014;8929E:1–8. doi: 10.1117/12.2045676. [DOI] [PMC free article] [PubMed] [Google Scholar]
- 35.Jones RS, Darling CL, Featherstone JD, Fried D. Caries Res. 2006;40(2):81–89. doi: 10.1159/000091052. [DOI] [PubMed] [Google Scholar]
- 36.Ngaotheppitak P, Darling CL, Fried D. Lasers Surg Med. 2005;37(1):78–88. doi: 10.1002/lsm.20169. [DOI] [PubMed] [Google Scholar]
- 37.Lin M, Liu QD, Xu F, Bai BF, Lu TJ. SPIE Proc. 2009;7522N:1–7. [Google Scholar]
- 38.Darling CL, Featherstone JDB, Le CQ, Fried D. SPIE Proc. 2009;7162T:1–7. doi: 10.1117/12.816868. [DOI] [PMC free article] [PubMed] [Google Scholar]
- 39.McIntyre JM, Featherstone JD, Fu J. Aust Dent J. 2000;45(2):97–102. doi: 10.1111/j.1834-7819.2000.tb00248.x. [DOI] [PubMed] [Google Scholar]
- 40.Malek S, Darendeliler MA, Swain MV. Am J Orthod Dentofacial Orthop. 2001;120(2):198–208. doi: 10.1067/mod.2001.114535. [DOI] [PubMed] [Google Scholar]