

Abstract
Gene subset selection is essential for classification and analysis of microarray data. However, gene selection is known to be a very difficult task since gene expression data not only have high dimensionalities, but also contain redundant information and noises. To cope with these difficulties, this paper introduces a fuzzy logic based pre-processing approach composed of two main steps. First, we use fuzzy inference rules to transform the gene expression levels of a given dataset into fuzzy values. Then we apply a similarity relation to these fuzzy values to define fuzzy equivalence groups, each group containing strongly similar genes. Dimension reduction is achieved by considering for each group of similar genes a single representative based on mutual information. To assess the usefulness of this approach, extensive experimentations were carried out on three well-known public datasets with a combined classification model using three statistic filters and three classifiers.
Key words: fuzzy processing, gene selection, dimension reduction, classification
Introduction
The DNA microarray technology allows us to monitor and to measure gene expression levels for tens of thousands of genes simultaneously in a cell mixture. Pioneer works reported in the literature 1., 2., 3., 4. have studied gene selection and classification methods in order to recognize cancerous and normal tissues from the analysis of microarray data.
Given the very high number of genes, it is useful to select a limited number of relevant genes for classifying tissue samples. In the traditional filter methods, each gene is first evaluated and assigned a score according to its individual relevance to the target classes. Then the genes are ranked by their scores and the first top-ranked genes are retained for classification. However, this individual evaluation of genes cannot lead to optimal gene subsets because microarray data contain many correlated genes with similar expression levels (5). The presence of redundant information makes the classification task even more difficult since redundant genes do not provide the classifier with additional discriminating information. In the most recent studies on tumor classification, the analysis of the gene expression data turns toward the selection of genes that are not only relevant, but also non-redundant 6., 7., 8., 9., 10., 11., 12., 13., 14., 15., 16., 17., 18.. These studies demonstrate that the genes obtained through the minimum redundancy and the maximum relevance may be of more interest to classification and represent broader spectrum of characteristics of phenotypes.
A general discussion about the notions of feature relevance and redundancy can be found in previous studies 19., 20., 21.. The techniques proposed in the literature can be roughly classified into three categories according to the criteria they use: minimum redundancy, maximum relevance, minimum redundancy combined with maximum relevance.
In this paper, we propose a fuzzy logic based approach for elimination of information redundancy of microarray data. This approach also helps to deal with the problems related to the imprecise and noisy nature of gene expression data.
The proposed approach is divided into two main steps. The first step fuzzifies the data to normalize the gene expression levels, helping to lighten the negative effect of noisy data; this transformation of expression values relies on a fuzzy inference system. The second step performs a feature space reduction that eliminates redundant information and selects relevant genes. The key idea of this step is to gather genes into groups according to a fuzzy similarity relation. Dimension reduction is achieved by choosing a sole representative member for each group and the mutual information criterion is used to select the gene that is the most informative for the classification process. This fuzzy processing provides a reduced set of dissimilar and relevant genes. This technique is easy to understand and consequently can be used for a biological interpretation. Moreover, the constitution of groups is performed in a hierarchical way that does not require to define a priori the number of groups.
To evaluate the usefulness of the proposed fuzzy logic approach, we carried out a number of extensive experimentations on three public datasets. The first experimentation studies how the results of a classification process are modified when we introduce the fuzzy treatment as a first step of the process. The classification process uses the k-nearest neighbor (kNN) classifier combined with some well-known filtering/ranking methods. The other experimentations change the different components of the classification process, namely the filter criterion or the classifier, to determine whether a certain combination gives optimal gene selection and classification results. We also study the influence of the relevance criterion instead of mutual information to determine the relevance of a gene.
Results and Discussion
This section aims to study the effect of our fuzzy logic approach on the classification task. We performed our experimentations on three well-known public datasets of leukemia, colon, and lymphoma. Details about the data are provided in Materials and Methods.
Our method is essentially a dimension reduction technique and we find very few results in the literature that concern this subject. For our purpose, we used the experimental protocol shown in Figure 1. Figure 1A is the simple filter based model that is used as our comparison reference. Figure 1B describes the model using our fuzzy approach, composed of the following steps:
-
1.
Apply the fuzzy approach to the dataset. This processing generates a reduced set of k genes that are obtained from k equivalent gene groups.
-
2.
Apply a statistic filtering/ranking method to rank these k genes.
-
3.
Pick the first p top-ranked genes among these k genes.
-
4.
Apply a classifier with these p genes to the samples of the dataset and calculate the classification accuracy.
Fig. 1.

A. Simple filter based model used as our comparison reference. B. Combined model using our fuzzy processing followed by the classical filter approach.
Step 1 is essential for our experimental comparisons. This step allows an important dimensionality reduction by eliminating irrelevant genes. Table 1 shows the effect of this processing in terms of dimensionality reduction on the three datasets.
Table 1.
Reduced dataset obtained by the fuzzy approach
| Dataset | Original number of genes | Reduced number of genes | Percentage (%) of informative genes |
|---|---|---|---|
| Leukemia | 7,129 | 1,360 | 19.07 |
| Colon | 2,000 | 943 | 47.15 |
| Lymphoma | 4,026 | 435 | 10.80 |
For the ranking method used in Step 2, we take three well-known methods, namely BSS/WSS (BW) (22), t-statistic (TT) (23), and Wilcoxon test (WT) (7). For the classification task of Step 4, we use a simple kNN classifier. Although any other classifier can be employed here, kNN has the advantage of being fast. Of course, using a more powerful classifier such as support vector machine (SVM) may lead to better classification results, but this is not essential here given that our goal is to observe the possible difference of classification with and without the application of our fuzzy logic processing (Step 1).
In order to estimate the classification accuracy, we adopt an external leave-one-out cross validation (LOOCV). This validation leaves out a single sample of the data, applies the complete process of selection and classification on the remaining samples, and then evaluates the classification rate on the test sample. This step is repeated for each sample to obtain the average classification rate, which is a nearly unbiased estimate of the true classification rate of the classifier (24).
Since we experiment with three filters, the fuzzy approach gives three kinds of processing that will be called combined models (CMs):
-
−
CM1: fuzzy logic followed by the BW filter
-
−
CM2: fuzzy logic followed by the TT filter
-
−
CM3: fuzzy logic followed by the WT filter
As a comparison reference, we use the conventional filter-based classification procedure described in Figure 1A; it is composed of Steps 2–4 of the above procedure. In addition, a pre-processing is first applied to each dataset (Step 1) to eliminate extreme values (leukemia and colon) (22) and to replace missing data (with the kNN imputation method) (lymphoma) (25). Each combined model will be compared with the reference model that uses the same filtering criteria; therefore, the three reference models will be called BW, TT, and WT according to the name of the filter used in Step 2.
Each couple of models [(BW, CM1), (TT, CM2), (WT, CM3)] was applied on the 3 datasets, which gave 18 results that were analyzed to see whether or not fuzzy logic permits to improve the classification accuracy.
From our experimentations, we present two types of comparative results. First, we show the classification results obtained when only a small number of genes is used for the classification task. Indeed, this experimentation is consistent with many reported studies where a reduced set of predictive genes (several tens of genes) are identified for classification. In our case, we show results with p ≤30 top-ranked genes. On the other hand, when no sufficient knowledge is available on the genes, it would be harmful to discard at this stage too many genes to retain only a very small number of them. Indeed, a gene which is wrongly eliminated by the filter cannot be recovered. For this reason, we show also classification results with more genes (p=50, but also 50< p ≤100).
Results with a small number of selected genes
In this section, we compare the classification results of different couples of models on the datasets. In all the cases, the p top-ranked genes, with p ≤ 30, are used by the kNN classifier to classify the samples; the number of neighbors k is fixed to 5. Fig. 2, Fig. 3, Fig. 4 show respectively the comparisons on the three datasets. For each dataset and each couple of models, we draw the accuracy (classification rate) as a function of the number of genes p; we also report the best (peak) classification rates as well as the average classification rates (the averages are calculated across p=1 to 30). From these figures, we can make several comments.
Fig. 2.

Classification rate (accuracy) (%) with p genes on the leukemia dataset. A. BW: 95.83 (peak classification rate) and 90.23 (average classification rate) vs CM1: 100 and 87.77. B. TT: 95.83 and 83.70 vs CM2: 97.22 and 93.37. C. WT: 87.5 and 75.64 vs CM3: 98.61 and 94.72.
Fig. 3.

Classification rate (accuracy) (%) with p genes on the colon dataset. A. BW: 88.70 (peak classification rate) and 86.45 (average classification rate) vs CM1: 90.32 and 82.04. B. TT: 80.64 and 75.43 vs CM2: 85.48 and 84.78. C. WT: 82.25 and 77.79 vs CM3: 85.48 and 83.60.
Fig. 4.

Classification rate (accuracy) (%) with p genes on the lymphoma dataset. A. BW: 92.70 (peak classification rate) and 89.30 (average classification rate) vs CM1: 92.70 and 83.47. B. TT: 87.50 and 84.37 vs CM2: 88.54 and 79.30. C. WT: 93.75 and 91.04 vs CM3: 86.45 and 78.81.
First, the analysis may focus on the datasets. One observes, except for WT applied to lymphoma, a strong and positive influence of fuzzy processing, whatever the filter is used. Indeed, the combined models allow the classifier to achieve a higher peak for the classification rate in 7 of 9 cases and achieve the equal performance in 1 case. In particular, CM1 obtains a perfect classification accuracy for leukemia (with 30 genes). One also notices that the improvement is stronger for leukemia and colon datasets than for the lymphoma dataset. Given that leukemia and colon contain a high level of noise, this improvement seems to confirm that the fuzzy normalization step reduces the negative effect of noise.
Second, if one compares a particular filter method with its combined model across all the datasets, one observes that fuzzy logic has similar and positive effect on the three filters. The effect seems more consistent on BW and TT than on WT for which a worse performance is observed on the lymphoma dataset. Notice that the lymphoma dataset contains many missing data, which are replaced in our case by the kNN imputation method (25). This could restrict the positive effect of fuzzy processing.
Third, if one considers the average classification accuracies calculated over the range of p = 1 to 30 genes, the results are more intermixed: only in 4 of 9 cases an improvement is observed.
Finally, notice that these results correspond in reality to a snapshot with a small number of genes for classification. One may wonder then to which extent the above observations remain valid in general. Indeed, according to where one puts the cursor on the number of the retained genes, one may reasonably expect variations of the performance of the combined models. We present in the next section more computational results with an extended number of genes for the classification task.
Results with more selected genes
In this section, we show results of the combined models CM1, CM2 and CM3 with p=100 genes for classification. Table 2 summarizes respectively the best and average classification rates obtained for each dataset. One notices that the peak results for the filtering methods remain almost the same as those presented in Fig. 2, Fig. 3, Fig. 4. This is because adding more genes after the 30 top-ranked ones has little or no influence on the classification performance of the kNN classifier with the filter models.
Table 2.
Best and average classification rates for leukemia, colon, and lymphoma datasets using the first 100 top-ranked genes
| Best classification rate (%) | ||||||
| Dataset | Method |
|||||
| BW | CM1 | TT | CM2 | WT | CM3 | |
| Leukemia | 98.6 | 100 | 97.2 | 97.2 | 95.8 | 98.6 |
| Colon | 88.7 | 90.3 | 80.6 | 85.4 | 82.2 | 85.4 |
| Lymphoma | 92.7 | 93.7 | 87.5 | 89.5 | 93.7 | 90.6 |
| Average classification rate (%) |
||||||
| Dataset |
Method |
|||||
| BW | CM1 | TT | CM2 | WT | CM3 | |
| Leukemia | 94.5 | 95.7 | 91.6 | 91.0 | 86.9 | 91.8 |
| Colon | 87.2 | 87.3 | 70.3 | 80.8 | 72.5 | 81.3 |
| Lymphoma | 87.7 | 88.2 | 84.5 | 83.6 | 88.7 | 84.2 |
From Table 2, we can observe that except the case of WT applied to lymphoma, the combined models obtain always better (equal with TT for leukemia) peak performance than the filter models alone. The average classification rate is also improved in 6 of 9 cases. These results are thus quite consistent with those obtained with a smaller number of genes as shown above (p ≤30). Therefore, we confirm that we have also examined the classification results with larger number of genes (p ≤100) and we could draw the same conclusions.
Biological interpretation for the leukemia dataset
The leukemia dataset was first presented in Golub et al. (4) and has been studied in numerous papers. This section presents the top 30 genes selected by our combined model CM1, which leads to a perfect recognition accuracy with kNN. Table 3 gives for each gene its rank in our selection process, its ID number in the dataset, and its code and description. The genes that are also reported as informative genes by other well-known models 4., 10., 26., 27., 28., 29., 30., 31., 32., 33. are given in bold face. For instance, our combined model CM1 finds the gene 4847 (rank 1). In fact, this gene is well known in the literature; it encodes proteins for cell adhesion, and has low expression level for the acute lymphoblastic leukemia (ALL) samples and a high expression level for the acute myeloid leukemia (AML) samples, respectively. Other relevant genes found with our fuzzy approach are the gene 1882 (rank 6) and the gene 2121 (rank 9) (26). We also find the gene 4951 (rank 23) reported in Chu et al. (29) as the first ranked gene by their model based on a Gaussian process. The gene 2354 (rank 19) is reported in Golub et al. (4) and Bicciato et al. (26) as a strong marker of ALL. The following genes are cited in Ding and Peng (10) as informative: 2121 (rank 9), 4366 (rank 13), 4328 (rank 17), 2354 (rank 19), 6855 (rank 22), 2642 (rank 24), 6225 (rank 26), 235 (rank 27) and 804 (rank 30). We can also notice that in Marohnic et al. (9), the gene 4847 (rank 1) combined with the gene 804 (rank 30) gives an almost exact classification of the samples. In Guyon et al. (34), this last gene is listed as the second most relevant gene for the leukemia dataset. These observations confirm the interesting role of the fuzzy pre-processing of our model.
Table 3.
The 30 genes selected for the leukemia dataset
| Rank | ID | Gene code | Description | References |
|---|---|---|---|---|
| 1 | 4847 | X95735 | Zyxin | 4, 9, 10, 26., 27., 28., 29., 30., 31., 33 |
| 2 | 4196 | X17042 | PRG1 proteoglycan 1 | 10, 26., 27., 28., 29., 31 |
| 3 | 1834 | M23197 | CD33 antigen | 4, 10, 26., 27., 28., 29., 30., 31., 33 |
| 4 | 6041 | L09209 | APLP2 | 27 |
| 5 | 3252 | U46499 | Glutathione s-transferase | 27, 32 |
| 6 | 1882 | M27891 | CST3 cystatin C | 4, 27 |
| 7 | 1745 | M16038 | LYN V-yes-1 | 27, 32, 33 |
| 8 | 1829 | M22960 | PPGB (galactosialidosis) | 27, 33 |
| 9 | 2121 | M63138 | CTSD cathepsin D | 4, 10, 33 |
| 10 | 2020 | M55150 | FAH fumarylacetoacetate | 10, 26., 27., 28., 29., 31, 33 |
| 11 | 2111 | M62762 | ATP6C vacuolar H+ | 4, 33 |
| 12 | 3320 | U50136 | Leukotriene C4 synthase | 10, 26., 27., 28., 29., 30., 31., 32., 33. |
| 13 | 4366 | X61587 | ARHG Ras (rho G) | 10 |
| 14 | 6005 | M32304 | TIMP2 tissue inhibitor | |
| 15 | 4229 | X52056 | SPI1 (SFFV) | |
| 16 | 461 | D49950 | Liver mRNA (IGIF) | 10, 26., 27., 28., 29., 30., 31., 33 |
| 17 | 4328 | X59417 | Proteasome iota chain | 10, 32 |
| 18 | 6281 | M31211 | MYL1 myosin (alkali) | |
| 19 | 2354 | M92287 | CCND3 cyclin D3 | 4, 10, 26 |
| 20 | 6185 | X64072 | SELL | |
| 21 | 1260 | L09717 | LAMP2 | |
| 22 | 6855 | M31523 | TCF3 | 10 |
| 23 | 4951 | Y07604 | NDP kinase | 9, 27, 29 |
| 24 | 2642 | U05259 | MB-1 gene | 10 |
| 25 | 1615 | L42379 | Quiescin (Q6) | |
| 26 | 6225 | M84371 | CD19 gene | 10 |
| 27 | 235 | D14664 | KIAA0022 | 10 |
| 28 | 1144 | J05243 | SPTAN1 | 32 |
| 29 | 2363 | M93053 | Leukocyte elastase inhibitor | |
| 30 | 804 | HG612-HT1612 | Macmarcks | 9, 10 |
Experiments on other relevance criteria and classifiers
All the combined models submitted to the above experimentations rely on a dimension reduction step that uses the mutual information criterion (see Materials and Methods) to determine the most relevant gene from a group of similar genes. Calculus of the mutual information between a gene and the class requires estimation of probabilities that may be very approximate when the number of samples is limited as it is the case for microarray data. So we want to verify whether other relevance criteria can be used to identify a relevant gene from each group of similar genes.
For this purpose, we have experimented with three alternative criteria: a random criterion (RC), the Kendall test (KT) (35), and the signal-to-noise ratio (SNR) 27., 28., 36.. Each of these criteria can be applied in the generic combined model explained above, and to be exhaustive, we have considered the three combined models associated to the three filtering criteria BW, TT, and WT presented above.
These different combinations give nine models, namely FRC +BW, FRC+TT, FRC +WT, FKT +BW, FKT+TT, FKT +WT, FSNR+BW, FSNR+TT, and FSNR+WT, whose names are constructed according to the pattern FRelevance+Filter, where Relevance is the measure of relevance applied in the fuzzy process and Filter is the name of filter criterion. Moreover, these models are tested with different classifiers: kNN (k=5 neighbors), learning vector quantization (LVQ) (learning rate=0.02 and number of epochs=5000), and SVM (RBF kernel; C=100 and sigma=1).
The results of this very exhaustive experimentation are presented in Table 4, showing the best performance obtained in each case.
Table 4.
Best classification rate (%) with different relevance criteria and filter methods combined with different classifiers*
| Combined methods | Leukemia |
Colon |
Lymphoma |
||||||
|---|---|---|---|---|---|---|---|---|---|
| kNN | LVQ | SVM | kNN | LVQ | SVM | kNN | LVQ | SVM | |
| FRC+BW | 97.5 | 91.0 | 99.4 | 90.8 | 87.0 | 91.7 | 93.7 | 97.9 | 99.3 |
| FRC+TT | 98.3 | 91.0 | 99.8 | 89.3 | 87.0 | 92.0 | 94.7 | 97.9 | 99.4 |
| FRC+WT | 97.2 | 91.0 | 98.1 | 89.5 | 87.0 | 88.5 | 94.7 | 95.8 | 98.4 |
| FKT+BT | 96.2 | 91.0 | 98.4 | 89.5 | 87.0 | 91.9 | 91.6 | 72.9 | 97.9 |
| FKT+TT | 97.7 | 91.0 | 98.4 | 89.8 | 87.0 | 91.4 | 94.7 | 100 | 98.7 |
| FKT+WT | 98.0 | 91.0 | 98.4 | 90.1 | 87.0 | 88.7 | 93.7 | 97.9 | 99.1 |
| FSNR+BT | 99.4 | 91.0 | 99.8 | 89.5 | 87.0 | 91.4 | 96.8 | 93.7 | 99.4 |
| FSNR+TT | 98.3 | 97.0 | 100 | 89.5 | 83.8 | 92.4 | 94.7 | 95.8 | 99.6 |
| FSNR+TT | 98.8 | 91.0 | 98.3 | 89.5 | 87.0 | 89.0 | 93.7 | 89.5 | 97.7 |
We report the best classification rate obtained with p selected genes (p ≤100).
The key observation from this experimentation is that it is possible to use another relevance criterion to pick a relevant gene from each group of similar genes. In addition to the relevance criterion, the final results depend equally on the classifier used. Table 4 shows that the highest accurate results (in bold) are obtained with an SVM classifier for the three datasets (for the lymphoma, this gives the second best performance of 99.6%). We can find that among all the combined methods, the fuzzy approach combined with SNR as relevance criterion and TT as filter method is an effective combination to select non-redundant and relevant genes. We can also observe that LVQ gives rather mediocre results on leukemia and colon datasets, but it gives an accuracy of 100% for the lymphoma dataset. However, as observed by other researchers, it is difficult to find a method well suited for all datasets; despite the great number of publications, it is difficult to understand the particularities of each dataset.
Comparisons with previous results
A lot of works study the problem of classification of microarray data. In this section, we propose a comparison of the results obtained by different methods of selection and classification. A reliable comparison between two approaches can be obtained only if we are sure that the experimental conditions are the same. Particularly, it has been proved (24) that the way of conducting cross validation may lead to optimistic results with a selection bias if the validation loop does not include the selection process.
We present in Table 5 the best results obtained by several methods and by our models on the three datasets. In the table, the results from Furey to Nguyen (lines 2 to 6) are taken directly from Cho and Won (28). The other works are recent propositions (since 2004). All the methods reported in this table use a process of cross validation, but sometimes the papers do not explain precisely how the experimentation is conducted. This table indicates that our fuzzy model is very competitive compared with these most recent feature selection models.
Table 5.
Comparison of classification rates on the three datasets
| Work/Method | Best classification rate (%) |
||
|---|---|---|---|
| Leukemia | Colon | Lymphoma | |
| Ben-dor et al. (2) | 91.6–95.8 | 72.6–80.6 | – |
| Furey et al. (36) | 94.1 | 90.3 | – |
| Li et al. (37) | – | 94.1 | 84.6 |
| Li and Yang (38) | 94.1 | – | – |
| Dudoit et al. (22) | 95.0 | – | 90.0 |
| Nguyen and Rocke (23) | 94.2–96.4 | 87.1–93.5 | 96.9–98.1 |
| Marohnic et al. (9) | 100 | – | – |
| Ding and Peng (10) | 100 | 93.5 | 98.9 |
| Tang et al. (30) | 100 | – | – |
| Marchiori and Sebag (39) | 100 | 94.0 | 93.0 |
| Hu et al. (13) | 94.1 | 83.8 | 95.8 |
| Cho and Won (28) | 95.9 | 87.7 | 93.0 |
| Yang et al. (40) | 76.7 | 86.1 | 100 |
| Peng et al. (41) | 98.6 | 96.7 | – |
| Wang et al. (31) | 95.8 | 100 | 95.6 |
| Kim et al. (15) | 100 | 90.32 | – |
| Mundra and Rajapakse (17) | 97.2 | 89.3 | – |
| Tang et al. (33) | 100 | 96.7 | 95.4 |
| Li et al. (42) | 97.1 | 83.5 | 93.0 |
| Zhang et al. (43) | 100 | 90.3 | 92.2 |
| CM1 using kNN | 100 | 90.3 | 93.7 |
| CM1 using LVQ | 100 | 87.1 | 100 |
| CM1 using SVM (RBF) | 100 | 91.4 | 100 |
| FSNR+TT using kNN | 98.3 | 89.5 | 94.7 |
| FSNR+TT using LVQ | 97.0 | 83.8 | 95.8 |
| FSNR+TT using SVM (RBF) | 100 | 92.4 | 99.6 |
As mentioned above, the classification accuracy obtained by our model CM1 and by the model FSNR+TT is improved if we use a powerful classifier such as SVM. Indeed, our approach, combined with SVM, achieves an accuracy of 100% for the leukemia dataset. For the colon dataset which is known to be difficult for many methods, we can get a good performance (92.4%) using FSNR+TT. This is worse than the best prediction reported in Wang et al. (31) (100%), but is better than many other methods. Finally, for the lymphoma dataset, our model CM1 gives the highest recognition rate using either an LVQ or an SVM classifier (100%); the model FSNR+TT using SVM also gives a very interesting classification rate (99.6%) of the dataset.
Conclusion
In this paper, we have introduced a new approach for eliminating redundant information of microarray data. This approach uses fuzzy inference rules to fuzzify and normalize the initial data and fuzzy relation composition to reassemble similar genes into dissimilar groups. From each group of similar genes, a relevance criterion is used to identify the most relevant representative gene from each gene group, leading to the elimination of redundant and non-relevant genes. Moreover, this approach permits naturally the reduction of gene dimensionality, which is essential for analysis of large-scale gene expression data.
The effect of the proposed approach was evaluated on three public datasets (leukemia, colon, and lymphoma). At first, we studied the performance of this fuzzy pre-processing approach in combination with three well-known filtering/ranking methods (BSS/WSS, t-statistic, and Wilcoxon test) and a kNN classifier. Experimentations were carried out both with a small number of genes (≤30) as well as many genes (up to 100). The results show that the proposed fuzzy processing improves consistently the performance of these conventional ranking methods.
More precisely, the best classification rates with 100 selected genes are generally higher when the data are pre-processed by our approach. For the leukemia dataset, this is true for the three combined models and a perfect classification rate of 100% is achieved by the model CM1 (fuzzy pre-processing followed by the BSS/WSS filter). For the colon dataset, our pre-processing using the three combined models improves the classification accuracy and the best rate of 90.3% is obtained by CM1. For the lymphoma dataset, our approach using CM1 and CM2 (fuzzy pre-processing followed by t-statsitic) improves the classification accuracy and the best result 93.7% is obtained by CM1. On this dataset, the simple model with Wilcoxon test is better than its combined model. Notice that this dataset contains many missing values that must be imputed before processing. This may limit the positive effect of our fuzzy approach. In addition to the high classification accuracy obtained, we find that the identified genes are biologically meaningful. For instance, for the leukemia dataset, 23 of the 30 top-ranked genes selected by our approach are already reported in the literature.
To enlarge our study, we carried out an intensive experimentation to analyze the influence of relevance criterion (for picking a representative member from a group of similar genes) and the effect of the classifier. For this purpose, we realized an exhaustive comparison of 27 combinations using our fuzzy processing approach together with the three previously used filtering methods, three other relevance measures (KT, SNR, RC), and three different classifiers (kNN, LVQ, SVM). Results obtained from this experimentation showed that we can achieve excellent classification accuracy: 100% for leukemia, 92.4% for colon, and 100% for lymphoma. In most of the cases considered in this experimentation (Table 4), the best results are obtained by the SVM classifier, whatever the relevance criterion and the filter criterion are. The sole exception concerns the lymphoma dataset for which the classifier LVQ, associated to the Kendall test as relevance criterion and the t-statistic as filter criterion, gives an accuracy of 100%.
To summarize, the results shown in this paper demonstrate the usefulness of the proposed fuzzy approach for “pre-processing” noisy data and reducing data dimension. This approach can thus be used as a general pre-processing technique by any gene selection and classification method.
Materials and Methods
Microarray gene expression datasets
The leukemia dataset (4) consists of 72 microarray experiments with 7,129 gene expression levels, including two types of leukemia, namely AML (25 samples) and ALL (47 samples). This dataset is originated from the Affymetrix technology and is available at http://www.broad.mit.edu/cgi-bin/cancer/datasets.cgi.
The colon dataset contains expressions of 6,000 genes obtained from 62 cell samples, among which 40 samples are tumor samples and the remainings (22 of 62) are normal samples. Only 2,000 genes were selected based on the confidence in the measured expression levels (2). This dataset is available at http://microarray.princeton.edu/oncology/affydata/index.html.
The lymphoma dataset contains the expression measurements of 4,026 genes. The number of samples is 96, where 42 samples are diffuse large B-cell lymphoma (DLBCL) and 54 are activated B-like DL-BCL (A-DLBCL) (3). This dataset is available at http://llmpp.nci.nih.gov/lymphoma.
Fuzzy logic for dimension reduction of microarray data
Our approach relies on a similarity relation between gene expressions and leads to a partition of the genes into groups of similar genes. The different genes of a group carry redundant information and can be replaced by a representative member. The choice of this representative member is based on a mutual information criterion (or another criterion) that evaluates the relevance of a gene for the classification process. This approach enables a considerable reduction of the number of genes, which is essential for very large-scale gene expression data.
Fuzzy discretization of gene expression levels
It is well-known that microarray data contain noise due to experimental procedures and biological heterogeneity (44). In order to minimize the negative effect of noise, our approach begins with a pre-processing step that achieves a fuzzy normalization of the data (Figure 5).
Fig. 5.
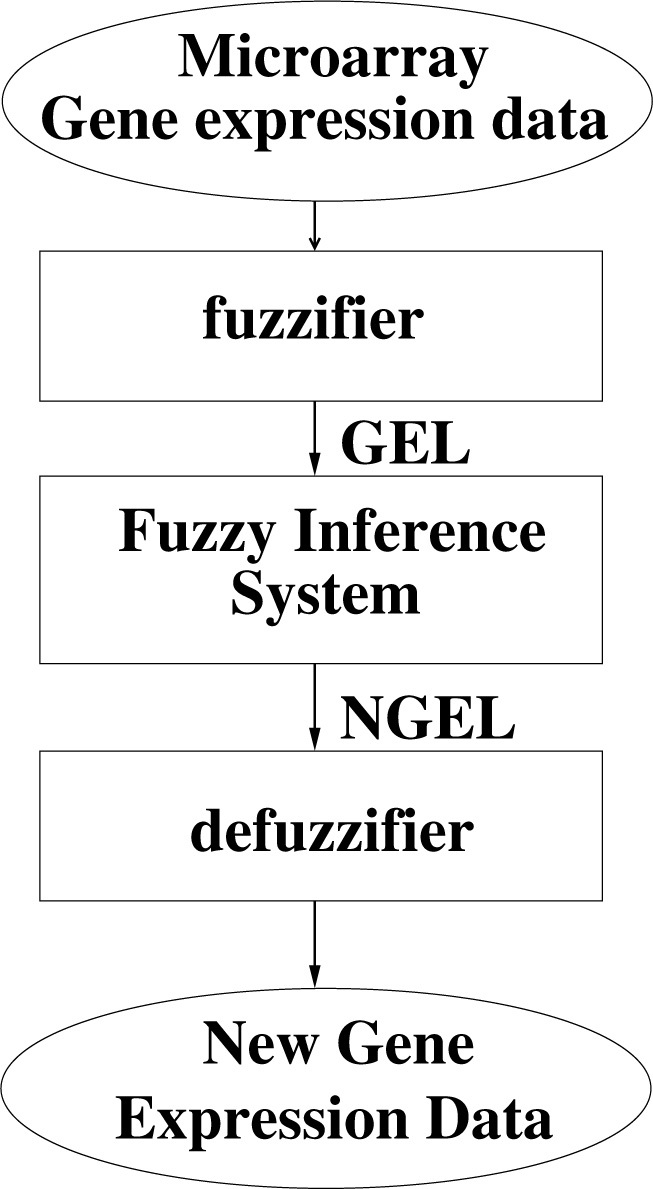
Fuzzy discretization of gene expression levels using a fuzzy inference system.
Let us represent a microarray dataset by a matrix D of dimension m × n, where m is the number of samples and n is the number of genes. Each real number dij is the expression level of gene j measured in the sample observation i. Our approach begins with a pre-processing step that relies on fuzzy logic to transform the crisp data D into a fuzzy matrix of gene expression levels, Df. This pre-processing can be further decomposed into several operations:
-
1.Perform a fuzzy discretization on the gene expression domain. Each crisp gene expression dij is transformed into a triple:
which represents the membership degrees to three possible fuzzy sets named by the values: LOW, MEDIUM, and HIGH. We use triangular functions to define these three fuzzy sets but other membership functions can be considered as well. -
2.
Apply a fuzzy inference system to normalize the fuzzy values GELij and to obtain normalized gene expression values NGELij. Three fuzzy partitions are used that are distributed symmetrically into interval [0, 1]. So this process gives a matrix (NGELij) where NGELij is a triple of three membership degrees.
-
3.
Apply a defuzzification process to transform each NGELij into a crisp value. This is obtained by computing the centroid of the area representing the fuzzy variable NGELij to obtain the final value gij, which is a real number in interval [0,1]. These values form the fuzzy matrix Df = (gij), which is analyzed in the following steps of our method.
Correlation matrix
In order to identify groups of similar genes, we need to evaluate the similarity between fuzzy gene expressions contained in Df. For this purpose, we use the cosine similarity as a measure of correlation 45., 46.. The column j of the matrix Df is a vector of the fuzzy expressions of gene j across all the samples. Therefore, the similarity between two genes j and k is defined by:
| (1) |
By applying this measure to each pair of genes, we obtain a fuzzy matrix of similarity S of size n × n, which represents a fuzzy relation between the genes denoted also by S.
Fuzzy equivalence relation to express redundancy between genes
The similarity relation S is a tolerance relation (45) since it satisfies only the reflexivity and symmetry properties but not the transitivity. Let us recall the definitions of reflexivity, symmetry, and transitivity for a fuzzy relation E represented by a matrix E:
-
−
E is reflexive if f ∀j ∈ {1, …, n}, E(gj, gj) = 1
-
−
E is symmetric if f ∀j, k ∈ {1, …, n}, j ≠ k, E(gj, gk) = E(gk, gj)
-
−
E is transitive if f ∀i, j, k ∈ {1,…, n}, i ≠ j ≠ k, E (gi, gj ) = λ1 and E(gj, gk) = λ2 → E(gi, gk) = λ where λ ≥ min [λι, λ2]
From a tolerance relation S, we can obtain a fuzzy equivalence relation E among the genes by computing the transitive closure of S. The transitive closure is obtained from Si, for a certain i such that i ≤ n, where Si is defined as follows:
| (2) |
For the operator of composition ∘, we use the most commonly used operator, namely the max-min operator.
Once we have obtained the fuzzy equivalence relation E = Si, we can naturally obtain groups of equivalent genes by applying α-cuts.
α-cuts for fuzzy relations
The α-cut (sometimes also called γ-cut) of a fuzzy set is the crisp set of all elements that have a grade of membership greater than or equal to the value α. If we consider a fuzzy equivalence relation represented by a matrix E, for each value α appearing in the matrix, we define the α-cut of E by:
| (3) |
Eα induces a crisp equivalence relation that defines a partition of genes into groups of similar genes.
The different possible values of α induce a hierarchy of partitions that can be represented as a dendogram. We have to choose a value of α that gives an interesting partition of the genes. The lowest and highest α-cuts are not considered because these extreme cases form respectively a single group for all genes and as many groups as genes.
We begin with the highest possible value of α and construct the partitions until we find an important variation in the number of groups between two successive α-cuts.
Eliminating redundancy while dealing with relevant genes
This step aims to summarize the whole information associated to the genes of a similar group by keeping a single gene from the group. To determine the representative member of a group, we propose to evaluate which gene has the greatest dependency with the class. Several well-known measures, such as Pearson coefficient, enable to evaluate linear dependencies between two variables, whereas criteria defined in the framework of information theory (47) enable to evaluate arbitrary dependencies. So we propose to evaluate the relevance of a gene by the mutual information between that gene and the class. When two events are independent, their mutual information is null; the more they are related, the higher the mutual information is. We recall now the definitions of entropy and mutual information in the context of microarray data.
Let us denote the entropy function by H. A gene G is represented by a vector of dimension m (a column of Df) and the class is represented by a vector C of dimension m where Ci is the class value of the ith sample. In a multi-class problem, C is a discrete variable with s values {C1, C2, …, Cs}. If we denote the probability of each class by p(Ci), the entropy function H(C) is defined by:
For the continuous variable G, if we denote the probability density by p(g), the entropy function H(G) is defined by:
The mutual information between a gene G and the class C is then defined by the formula:
The mutual information measures the amount by which the knowledge provided by the gene G decreases the uncertainty about the class.
Several approaches have been proposed to estimate the mutual information from a finite set of samples (48). In this work, we use the calculus proposed in Schlogl et al. (49) to evaluate the mutual information between a gene and the class. We use this measure as a ranking criterion to sort the genes of a group: the gene with the highest mutual information value with the class is chosen as a representative of its group.
Authors’ contributions
EBH implemented the system, conducted the experimentations, and prepared the draft manuscript. BD and JKH supervised the project, participated in data analyses and co-wrote the manuscript. All authors read and approved the final manuscript
Competing interests
The authors have declared that no competing interests exist.
Acknowledgements
This work was partially supported by the French Ouest Genopole Program and the “Bioinformatique Ligérienne” project of the “Pays de la Loire” Region. Huerta EB is supported by a CoSNET research scholarship. The authors would like to thank the referees for their useful suggestions that helped to improve the quality of this paper.
References
- 1.Alon U. Broad patterns of gene expression revealed by clustering analysis of tumor and normal colon tissues probed by oligonucleotide arrays. Proc. Natl. Acad. Sci. USA. 1999;96:6745–6750. doi: 10.1073/pnas.96.12.6745. [DOI] [PMC free article] [PubMed] [Google Scholar]
- 2.Ben-Dor A. Tissue classification with gene expression profiles. J. Comput. Biol. 2000;7:559–583. doi: 10.1089/106652700750050943. [DOI] [PubMed] [Google Scholar]
- 3.Alizadeh A. Distinct types of diffuse large B-cell lymphoma identified by gene expression profiling. Nature. 2000;403:503–511. doi: 10.1038/35000501. [DOI] [PubMed] [Google Scholar]
- 4.Golub T.R. Molecular classification of cancer: class discovery and class prediction by gene expression monitoring. Science. 1999;286:531–537. doi: 10.1126/science.286.5439.531. [DOI] [PubMed] [Google Scholar]
- 5.Eisen M.B. Cluster analysis and display of genome-wide expression patterns. Proc. Natl. Acad. Sci. USA. 1998;95:14863–14868. doi: 10.1073/pnas.95.25.14863. [DOI] [PMC free article] [PubMed] [Google Scholar]
- 6.Xiong M. Biomarker identification by feature wrappers. Genome Res. 2001;11:1878–1887. doi: 10.1101/gr.190001. [DOI] [PMC free article] [PubMed] [Google Scholar]
- 7.Jaeger J. Improved gene selection for classification of microarrays. Pac. Symp. Biocomput. 2003:53–64. doi: 10.1142/9789812776303_0006. [DOI] [PubMed] [Google Scholar]
- 8.Yu L., Liu H. Redundancy based feature selection for microarray data. In: Kim W., editor. Proceedings of the Tenth ACM SIGKDD International Conference on Knowledge Discovery and Data Mining. Seattle; USA: 2004. pp. 737–742. [Google Scholar]
- 9.Marohnic V. Vol. 1. Cavtat; Croatia: 2004. Mutual information based reduction of data mining dimensionality in gene expression analysis; pp. 249–254. (Proceedings of the 26th International Conference on Information Technology Interfaces). [Google Scholar]
- 10.Ding C., Peng H. Minimum redundancy feature selection from microarray gene expression data. J. Bioinform. Comput. Biol. 2005;3:185–205. doi: 10.1142/s0219720005001004. [DOI] [PubMed] [Google Scholar]
- 11.Liu X. An entropy-based gene selection method for cancer classification using microarray data. BMC Bioinformatics. 2005;6:76. doi: 10.1186/1471-2105-6-76. [DOI] [PMC free article] [PubMed] [Google Scholar]
- 12.Peng H. Feature selection based on mutual information: criteria of max dependency, maxrelevance, and min-redundancy. IEEE Trans. Pattern Anal. Mach. Intel. 2005;27:1226–1238. doi: 10.1109/TPAMI.2005.159. [DOI] [PubMed] [Google Scholar]
- 13.Hu Y. Proceedings of the Sixth International Conference on Hybrid Intelligent Systems. IEEE Computer Society; 2006. A novel microarray gene selection method based on consistency. [Google Scholar]
- 14.Mao K., Tang W. Correlation-based relevancy and redundancy measures for efficient gene selection. Lect. Notes Comput. Sci. 2007;4774:230–241. [Google Scholar]
- 15.Kim Y.B. A new maximum-relevance criterion for significant gene selection. Lect. Notes Comput. Sci. 2006;4146:71–80. [Google Scholar]
- 16.Li J. Optimal search-based gene subset selection for gene array cancer classification. IEEE Trans. INF. Technol. Biomed. 2007;11:398–405. doi: 10.1109/titb.2007.892693. [DOI] [PubMed] [Google Scholar]
- 17.Mundra P.A., Rajapakse J.C. SVM-RFE with relevancy and redundancy criteria for gene selection. Lect. Notes Comput. Sci. 2007;4774:242–252. [Google Scholar]
- 18.Mamitsuka H. Selecting features in microarray classification using ROC curves. Pattern Recognit. 2006;39:2393–2404. [Google Scholar]
- 19.John G. Proceedings of the 11th International Conference on Machine Learning. Morgan Kaufmann; 1994. Irrelevant features and the subset selection problem; pp. 121–129. [Google Scholar]
- 20.Yu L., Liu H. Efficient feature selection via analysis of relevance and redundancy. J. Mach. Learn. Res. 2004;5:1205–1224. [Google Scholar]
- 21.Saeys Y. A review of feature selection techniques in bioinformatics. Bioinformatics. 2007;23:2507–2517. doi: 10.1093/bioinformatics/btm344. [DOI] [PubMed] [Google Scholar]
- 22.Dudoit S. Comparison of discrimination methods for the classification of tumors using gene expression data. J. Am. Stat. Assoc. 2002;97:77–87. [Google Scholar]
- 23.Nguyen D.V., Rocke D.M. Tumor classification by partial least squares using microarray gene expression data. Bioinformatics. 2002;18:39–50. doi: 10.1093/bioinformatics/18.1.39. [DOI] [PubMed] [Google Scholar]
- 24.Ambroise C., McLachlan G.J. Selection bias in gene extraction on the basis of microarray geneexpression data. Proc. Natl. Acad. Sci. USA. 2002;99:6562–6566. doi: 10.1073/pnas.102102699. [DOI] [PMC free article] [PubMed] [Google Scholar]
- 25.Troyanskaya O. Missing value estimation methods for DNA microarrays. Bioinformatics. 2001;17:520–525. doi: 10.1093/bioinformatics/17.6.520. [DOI] [PubMed] [Google Scholar]
- 26.Bicciato S. Proceedings of the ACM SIGKDD Workshop on Data Mining in Bioinformatics. San Francisco; USA: 2001. Analysis of an associative memory neural network for pattern identification in gene expression data; pp. 22–30. [Google Scholar]
- 27.Cho S.B., Won H.H. Proceedings of the First Asia-Pacific Bioinformatics Conference. Adelaide; Australia: 2003. Machine learning in DNA microarray analysis for cancer classification; pp. 189–198. [Google Scholar]
- 28.Cho S.B., Won H.H. Cancer classification using ensemble of neural networks with multiple significant gene subsets. Appl. Intell. 2007;26:243–250. [Google Scholar]
- 29.Chu W. Biomarker discovery in microarray gene expression data with Gaussian processes. Bioinformatics. 2005;21:3385–3393. doi: 10.1093/bioinformatics/bti526. [DOI] [PubMed] [Google Scholar]
- 30.Tang, Y., et al. 2005. FCM-SVM-RFE gene feature selection algorithm for leukemia classification from microarray gene expression data. In Proceedings of the 14th IEEE International Conference on Fuzzy Systems, pp. 97-101. Reno, USA.
- 31.Wang, Z., et al. 2006. Neuro-fuzzy ensemble approach for microarray cancer gene expression data analysis. In Proceedings of the Second International Symposium on Evolving Fuzzy Systems, pp. 241-246. Lake District, UK.
- 32.Zhou X. Gene Selection using Logistic Regressions based on Aic, Bic and MDL criteria. New Math. Nat. Comput. 2005;1:129–145. [Google Scholar]
- 33.Tang Y. Development of two-stage SVM-RFE gene selection strategy for microarray expression data analysis. IEEE/ACM Trans. Comput. Biol. Bioinform. 2007;4:365–381. doi: 10.1109/TCBB.2007.70224. [DOI] [PubMed] [Google Scholar]
- 34.Guyon I. Gene selection for cancer classification using support vector machines. Mach. Learn. 2002;46:389–422. [Google Scholar]
- 35.Park P.J. A nonparametric scoring algorithm for identifying informative genes from microarray data. Pac. Symp. Biocomput. 2001:52–63. doi: 10.1142/9789814447362_0006. [DOI] [PubMed] [Google Scholar]
- 36.Furey T.S. Support vector machine classification and validation of cancer tissue samples using microarray expression data. Bioinformatics. 2000;16:906–914. doi: 10.1093/bioinformatics/16.10.906. [DOI] [PubMed] [Google Scholar]
- 37.Li L. Gene selection for sample classification based on gene expression data: study of sensitivity to choice of parameters of the GA/KNN method. Bioinformatics. 2001;17:1131–1142. doi: 10.1093/bioinformatics/17.12.1131. [DOI] [PubMed] [Google Scholar]
- 38.Li W., Yang Y. Methods of Microarray Data Analysis. Kluwer Academic, Boston; USA: 2002. How many genes are needed for a discriminant microarray data analysis? pp. 137–150. [Google Scholar]
- 39.Marchiori E., Sebag M. Bayesian learning with local support vector machines for cancer classification with gene expression data. Lect. Notes Comput. Sci. 2005;3449:74–83. [Google Scholar]
- 40.Yang W.H. Generalized discriminant analysis for tumor classification with gene expression data. In Proceedings of the International Conference on Machine Learning and Cybernetics. 2006:4322–4327. [Google Scholar]
- 41.Peng Y. A hybrid approach for biomarker discovery from microarray gene expression data for cancer classification. Cancer Informatics. 2006;2:301–311. [PMC free article] [PubMed] [Google Scholar]
- 42.Li G.Z. Proceedings of the 7th IEEE International Conference on Bioinformatics and Bioengineering. Boston; USA: 2007. Partial least squares based dimension reduction with gene selection for tumor classification; pp. 1439–1444. [Google Scholar]
- 43.Zhang L. An effective gene selection method based on relevance analysis and discernibility matrix. Lect. Notes Comput. Sci. 2007;4426:1088–1095. [Google Scholar]
- 44.Schuchhardt J. Normalization strategies for cDNA microarrays. Nucleic Acids Res. 2000;28:E47. doi: 10.1093/nar/28.10.e47. [DOI] [PMC free article] [PubMed] [Google Scholar]
- 45.Ross T.J. Fuzzy Logic with Engineering Applications. second edition. Wiley; 2005. [Google Scholar]
- 46.Tang C. Interrelated clustering: an approach for gene expression data analysis. In: Wang J.T.L., editor. Computational Biology and Genome Informatics. World Scientific; Singapore: 2003. pp. 183–206. [Google Scholar]
- 47.Shannon C.E. A mathematical theory of communication. Bell Syst. Tech. J. 1948;27:379–423. 623-656. [Google Scholar]
- 48.Steuer R. The mutual information: detecting and evaluating dependencies between variables. Bioinformatics. 2002;18:S231–S240. doi: 10.1093/bioinformatics/18.suppl_2.s231. [DOI] [PubMed] [Google Scholar]
- 49.Schlögl A. Estimating the mutual information of an EEG-based Brain-Computer Interface. Biomed. Tech. 2002;47:3–8. doi: 10.1515/bmte.2002.47.1-2.3. [DOI] [PubMed] [Google Scholar]