Summary
Epidemiological studies have linked periodontitis to rheumatoid arthritis (RA). Porphyromonas gingivalis (Pg) was reported recently to produce citrullinated protein (CP) and increase anti‐cyclic CP antibody (ACPA), both of which have been identified as causative factors of RA. In the present study, we determined the effects of Pg infection on the exacerbation of RA in a mouse model. RA model mice (SKG mice) were established by an intraperitoneal (i.p.) injection of laminarin (LA). Mice were divided into six groups, Ctrl (PBS injection), LA (LA injection), Pg/LA (Pg + LA injection), Pg (Pg injection), Ec/LA (Escherichia coli and LA injection) and Ec (E. coli injection). In order to evaluate RA, joint swelling by the arthritis score, bone morphology by microcomputed tomography (microCT), haematoxylin and eosin staining, ACPA, matrix metalloproteinase‐3 (MMP‐3) and cytokine level in serum by enzyme‐linked immunosorbent assay were determined. Osteoclast differentiation from bone marrow mononuclear cells (BMCs) was examined to clarify the underlying mechanisms of RA. The presence of Pg and CP in joint tissue was also investigated. The arthritis score was threefold higher in the Pg/LA group than in the LA group. Severe bone destruction was observed in joint tissue of the Pg/LA group. A microCT analysis of the Pg/LA group revealed a decrease in bone density. ACPA, MMP‐3, interleukin (IL)‐2, IL‐6, CXCL1 and macrophage inflammatory protein (MIP)‐1α levels from the Pg/LA group were the highest. The osteoclastogenesis of BMCs was enhanced in the Pg/LA group. Furthermore, large amounts of Pg components and CP were detected in the Pg/LA group. In conclusion, Pg infection has the potential to exacerbate RA.
Keywords: anti‐CCP, citrullinated protein, periodontitis, Porphyromonas gingivalis, rheumatoid arthritis
Introduction
Periodontitis is caused by an interaction between periodontopathogenic bacteria, such as Porphyromonas gingivalis (Pg) and Aggregatibacter actinomycetemcomitans, and host immune responses. An excessive interaction may cause the severe destruction of supportive periodontal tissue as well as loss of teeth 1. Pg is a Gram‐negative and obligate anaerobe that has been classified by Socransky 2 into the red complex group of periodontopathogenic bacteria. Pg also possesses a number of virulence factors that induce inflammation in periodontal tissue. Outer membrane proteins (Omps), fimbriae and gingipain (KGP, RGP) induce inflammation in gingival tissue, which enhances the progression of periodontitis 2, 3, 4. Among the various pathogenic factors identified to date, lipopolysaccharide (LPS) in the outer membrane of Pg is also a strong modulator of inflammation 5. Relationship have been reported recently between periodontitis and systemic diseases such as diabetes mellitus (DM), arterial sclerosis and rheumatoid arthritis (RA) 6. Locally induced inflammatory cytokines by a direct Pg challenge or systemic Pg infection in the bloodstream, also called bacteraemia, may exacerbate the onset of systemic diseases 7, 8.
RA is a systemic autoimmune disease that is characterized by chronic inflammation of the diarthrodial joints, leading to bone erosion and progressive disability 9. RA is generally considered to develop as a result of interactions between responsible genes, hormonal and environmental factors, such as human leucocyte antigen D‐related (HLA‐DR), solute carrier family 22 member 3 (SLC22A3), runt‐related transcription factor 2 (RUNX2), peptidylarginine deiminase (PAD)I4, smoking and stress 10. Most genetic studies on RA have focused on the HLA region and PADI4 gene, which encodes the PAD type IV enzyme 11. Genetic mutations in HLA and PADI4 have been shown to increase anti‐citrullinated protein antibody (ACPA) levels of the elevation of citrullinated protein (CP) 12. The production of ACPA in serum may be an important diagnostic marker of RA, similar to rheumatoid factor, which is an autoantibody of immunoglobulin (Ig)M against the Fc portion of IgG 13.
A previous study demonstrated that the production of CP was induced by PAD derived from Pg (PgPAD) 14. Citrullination is a post‐translational modification of arginine residues, mediated by the PAD family. The mechanism underlying the generation of CP by PgPAD differs from that by endogenously produced CP. Fragmented target proteins, such as fibrinogen and alpha‐enolase, after being digested by the Pg‐produced arginine‐specific enzyme, RGP are targeted for the citrullination of c‐terminal arginine 15. PgPAD‐induced increases in CP and ACPA levels may also be a cause of RA 16.
Regarding the relationship between periodontitis and RA in clinical studies, the non‐surgical treatment of periodontitis has been shown to reduce the severity of RA in patients treated with or without tumour necrosis factor (TNF) inhibitors 17. Elevation in inflammatory cytokines, such as interleukin (IL)‐6 and TNF‐α and matrix metalloprotease (MMP)‐3, are the main clinical parameters of RA 18. These factors may communicate the progression of periodontitis via the bloodstream. Therefore, the use of the cytokine inhibitors, infliximab (an anti‐TNF neutralization antibody), etanercept (an anti‐TNF receptor antibody), adalimumab (an anti‐TNF‐α neutralization antibody), tocilizumab (an anti‐IL‐6 receptor antibody) and abatacept (cytotoxic T lymphocyte‐associated protein 4‐immunogloblin fusion protein) has led to improvements in periodontitis by suppressing inflammation in periodontal tissue 19.
In order to determine whether the induction of periodontitis affects the progression of experimental arthritis in vivo, mice immunized with type II collagen received oral inoculations of Pg every other day 20. Periodontitis induced by Pg accelerated the onset of arthritis in addition to periodontal bone loss in these mice. An analysis of the T cell population in joint‐draining lymph nodes with Pg infection showed the activation of T helper type 17 (Th17). Furthermore, the Pg stimulation activated bone marrow‐derived dendritic cells (BMDCs) to produce cytokines affecting T cell differentiation, such as IL‐1β, IL‐6 and TNF‐α via Toll‐like receptor (TLR)‐2 signalling 21.
Although previous studies have focused upon immune responses to periodontopathogenic bacteria in RA model mice 15, 21, 22, the effects of Pg infection on bone erosion in joints as one of the symptoms reflecting the progression of RA remain unclear. However, the involvement of Pg infection in osteoclastogenesis in advanced RA needs to be clarified for treatment of systemic disease. In a previous type of RA mouse model, RA was induced through the injection of human type II collagen into the ankle joint [collagen‐induced arthritis (CIA) mouse]. This mouse model received an antigen (collagen) that induced RA directly into the diseased site. Severe destruction of joint tissue was shown to occur as the result of the induction of immune responses against collagen 23. The administration of Pg exacerbated RA in this model with CP elevations. Currently, however, it remains unclear whether the origin of CP in the joint tissue is derived from endogenous PAD or PgPAD. It is also unknown if the effect of Pg infection in the onset of RA is via directly produced CP by PgPAD or up‐regulation of endogenous PAD by Pg‐induced inflammation. The other RA mouse model (SKG) was established as the RA model, which has a syndrome that shares features with human RA 24. SKG mice have a single point mutation in the zeta‐chain‐associated protein kinase 70 (ZAP‐70) gene that results in attenuated TCR signalling and abnormality of positive negative selection. As a result, autoimmune disease could be induced by the activated autoreactive CT4+ T cells that have escaped negative selection. Therefore, use of the SKG mouse as a RA model has the advantage of systemic induction by Laminaria digitate (LA). In the present study, we attempted to elucidate local and systemic immune responses associated with the exacerbation of RA by establishing Pg‐infected SKG mice as a RA model.
Materials and methods
Animals
SKG mice (6–8‐week‐old females; Clea Japan, Inc., Tokyo, Japan) were kept in a specific pathogen‐free (SPF) room with a 12‐h light–dark cycle at a constant temperature. The experimental procedures employed in this study were approved by the Ethical Committee of Hiroshima University (approved no. A12‐15).
Preparation of bacteria
The bacteria used in this study were purchased from the American Type Culture Collection (ATCC, Manassas, VA, USA). Pg W83 was cultured on a sheep blood agar plate using the Anaeropack system (Mitsubishi Gas Chemical, Tokyo, Japan) at 37°C. After a 2‐day incubation, Pg was inoculated in 40 ml of trypticase soy broth supplemented with 1% yeast extract, haemin (200 μg) and menadion (20 μg). Escherichia coli (Ec) HB101 was grown aerobically in Luria–Bertani (LB) broth at 37°C. Bacteria were harvested in the exponential growth phase and washed with phosphate‐buffered saline (PBS).
Induction of RA in SKG mice (RA mice)
Laminarin derived from LA was purchased from Sigma‐Aldrich (L9634; St Louis, MO, USA). LA was dissolved in PBS at 100 mg/ml before intraperitoneal (i.p.) injections. In order to induce RA, LA (100 μl/mouse) was administered to SKG mice by i.p. injection. Pg W83 was also injected i.p. (108 bacterial cells/100 μl saline) using a 28‐G needle syringe (Terumo, Tokyo, Japan) every week for 6 weeks. As a Pg injection control, E. coli was injected i.p. (108 bacterial cells/100 μl saline) every week for 6 weeks. A diagram of the experimental protocol is shown in Fig. 1a.
Figure 1.
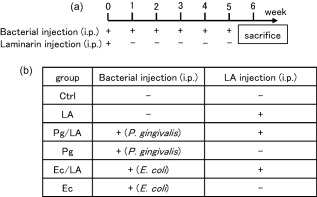
Establishment of the Porphyromonas gingivalis (Pg) infection rheumatoid arthritis (RA) model. (a) In order to determine the involvement of Pg infection in the induction of RA, model mice (SKG mice, 6–8 weeks old) were established on an intraperitoneal (i.p.) injection of laminarin (LA) (0·5 mg/g/mouse) and Pg W83 or Ec HB101 at 1·0 × 108 colony‐forming units (CFU)/mouse. A single injection of bacteria was performed in the same manner every week. All mice were killed 6 weeks later and serum, bone marrow mononuclear cells (BMCs) and leg joint tissue were collected. (b) Mice were divided into six groups: phosphate‐buffered saline (PBS) injection (control group), LA injection (LA group), Pg+LA injection (Pg/LA group), Pg injection (Pg group), Ec+LA injection (Ec/LA group) and Ec injection (Ec group).
Clinical assessment of SKG arthritis (AS)
Joint swelling was monitored by inspection and scored as follows: 0, no joint swelling; 0·1, swelling of one finger joint; 0·5, mild swelling of the wrist or ankle; and 1·0, severe swelling of the wrist or ankle. Scores for all digits, wrists and ankles were totalled for each mouse, as reported previously by Sakaguchi 25.
Analysis of the ankle joint by microcomputed tomography (microCT)
A formalin‐fixed ankle joint tissues were analysed by microCT (Skyscan 1176, Bruker, Kontich, Belgium). The microCT settings used were as follows: pixel size, 1024 × 1024; slice thickness, 6 μm; magnification, ×6; voltage, 50 kV; and electrical current, 0·08 mA. Three‐dimensional views were constructed with the imaging software program CTAn version1.5.0 (Bruker).
Histology
Ankle joints were fixed in buffered 4% formalin, and paraffin‐embedded sections were stained with haematoxylin and eosin (H&E) and the tartrate‐resistant acid phosphatase kit (TRAP staining kit; Takara Bio Inc., Shiga, Japan). The number of lymphocytes and TRAP‐positive cells in the randomly selected diseased site (three sites/picture) were counted and compared among the different groups.
Detection of CP and Pg components in the ankle joint
The soft tissue of the ankle joint derived from the six groups of SKG mice was lysed in 500 μl of ×1 lysis buffer (Invitrogen, Tokyo, Japan) with 0·1% phenylmethanesulphonyl fluoride (PMSF; Sigma‐Aldrich) and 1% proteinase inhibitor cocktail (#87786; Thermo Fisher Scientific, Tokyo, Japan), and then homogenized using a homogenizer (Nippi Corporation, Tokyo, Japan). In order to detect CP, samples were applied to a 12% sodium dodecyl sulphate (SDS)‐polyacrylamide gel, electrophoresed and transferred electronically onto nitrocellulose membranes (Bio‐Rad Laboratories, Hercules, CA, USA). The membrane was blocked with 1% non‐fat dried milk at room temperature for 1 h and then reacted with anti‐citrulline mouse monoclonal IgG (10 μg/ml, #ab100932; Abcam, Cambridge, MA, USA) in PBST at 4°C for 12 h. The membrane was incubated with anti‐β‐actin IgG (10 μg/ml, #ab6726; Abcam) as a positive control. In order to detect Pg components in the ankle joint, an anti‐Pg antibody was incubated with the membrane. An anti‐Pg antibody was purified using the IgG purification kit (Thermo Fisher Scientific) from rat serum after i.p. injection of Pg W83 [formalin‐fixed, 109 cells/F344/Jcl ret (Clea Japan, Inc.)] every week for 6 weeks. The membrane was then incubated with horseradish peroxidase (HRP)‐conjugated sheep anti‐mouse or rat IgG in PBST at room temperature for 1 h. Immunodetection was performed according to the manual supplied with the ECL Plus Western blotting reagents (GE Healthcare Life Sciences, Tokyo, Japan).
Enzyme‐linked immunosorbent assay (ELISA)
In order to examine IgG levels against ACPA – those against Pg, Ec and MMP‐3 levels in mouse serum – serum derived from six groups of mice was collected. Briefly, a solid‐phase anti‐citrulline monoclonal antibody (Orgentec, Chicago, IL, USA), formalin‐fixed Pg cells, Ec cells or solid‐phased anti‐MMP‐3 antibody (#ab100731; Abcam) (diluted in PBS pH 7·2 at final concentration of 0·5 μg/ml) were coated onto a 96‐well enzyme‐linked immunosorbent assay (ELISA) plate (BD Falcon, Franklin Lakes, NJ, USA) in order to capture the target. After blocking each well with 1% bovine serum albumin (BSA) in PBS supplemented with 0·05% Tween 20 (PBST), the serum (100‐fold dilution) or standard (diluted in PBST from 1 ng/ml to zero) was applied to each well. After application of the detection antibody (diluted in PBST to a final concentration of 1 μg/ml), anti‐IgG conjugated with HRP (2000‐fold dilution in PBST) was applied to the wells. Colorimetric reactions were developed with o‐phenylenediamine (Sigma‐Aldrich) in the presence of 0·02% H2O2. Colour development was paused with H2SO4 (2N) and measured by an ELISA reader [optical density (OD)405)]. The actual concentration of the target was calibrated by referring to a standard curve prepared by serial dilutions. Each sample was examined in triplicate wells of a 96‐well ELISA plate.
Measurement of multiple cytokine production
The Bio‐Plex Pro mouse cytokine 23‐plex assay (# M60009RDPD; Bio‐Rad Laboratories, Inc.), which is a multiplex biometric ELISA‐based immunoassay involving dyed microspheres conjugated with a monoclonal antibody specific for a target protein, was performed according to the manufacturer's guidelines using serum samples. Briefly, the following soluble molecules in serum samples were measured: IL‐1α, IL‐1β, IL‐2, IL‐3, IL‐4, IL‐5, IL‐6, IL‐9, IL‐10, IL‐12 (p40), IL‐12 (p70), IL‐13, IL‐17A, eotaxin, granulocyte‐colony stimulating factor (G‐CSF), granulocyte–macrophage‐colony stimulating factor (GM‐CSF), interferon (IFN)‐γ, CXCL1, TNF‐α, monocyte chemotactic protein (MCP‐1), macrophage inflammatory protein (MIP)−1α, MIP‐1β and regulated upon activation normal T cell‐expressed an secreted (RANTES). All serum samples used in this study were examined in duplicate for cytokines at the same time. Targets in the serum were determined using a Bio‐Plex array reader (Luminex, Austin, TX, USA). The analyte concentration was calculated using a standard curve with software provided by the manufacturer (Bio‐Plex Manager Software; Bio‐Rad Laboratories, Inc.). The distribution of serum molecules among the groups was analysed using Student's two‐tailed t‐test.
Collection of bone marrow mononuclear cells (BMCs)
BMCs were isolated by density gradient centrifugation with Histopaque‐1083 (Sigma‐Aldrich) from the femurs and tibias of SKG mice in complete Dulbecco's modified Eagle's medium (DMEM) containing 10% fetal bovine serum (FBS) (Invitrogen, Carlsbad, CA, USA), antibiotics (penicillin, streptomycin and gentamicin; Invitrogen) and L‐glutamine.
Osteoclast differentiation
BMCs were seeded onto 96‐well plates at a density of 105 cells/well in 15% FBS containing alpha modified Eagle's minimum essential medium (α‐MEM). BMCs were cultured for 7 days with 50 ng/ml murine recombinant receptor activator of nuclear factor kappa‐B ligand (RANKL) and 20 ng/ml murine macrophage colony‐stimulating factor (M‐CSF; Peprotech, Rocky Hill, NJ, USA) in order to determine osteoclastogenesis. BMCs were also cultured for 48 h under the same conditions in an attempt to identify osteoclastogenesis‐related targets by real‐time polymerase chain reaction (PCR). The medium was replaced with fresh medium with soluble RANKL (sRANKL) and M‐CSF for another 3 days. Cells were stained using the TRAP staining kit, as described previously. TRAP‐positive (TRAP+) cells with three or more nuclei were considered to be osteoclasts. TRAP+ multi‐nuclear cells were counted, and the results obtained were expressed as numbers per well in a 96‐well plate.
Real‐time PCR
Total RNA was extracted from BMCs after the stimulation using RNAiso (Takara Bio, Inc.), according to the manufacturer's protocol. Total RNA was purified and analysed using the two‐step real‐time PCR system 26. Briefly, 1 μg of total RNA was used for reverse transcription with the first‐strand cDNA synthesis kit for reverse transcription (RT)–PCR (Roche Diagnostics, Basel, Switzerland). One μl of cDNA was used for real‐time PCR. The amplification conditions used were described previously 26. Real‐time PCR was performed by StepOne Plus (Applied Biosystems, Carlsbad, CA, USA). Template cDNA (1 μl) was mixed with the Core Reagent Fast SYBR® Master Mix system (4 μl; Applied Biosystems), distilled water (4·5 μl) and the primer (0·5 μl). The following primer sets were used for real‐time PCR: RANK forward, 5′‐TGCAGCTCAACAAGGATACG‐3′ and RANK reverse, 5′‐CATCTTCTCCTCCCGAGT‐3′; OSCAR forward, 5′‐TGGCGGTTTGCACTCTTCA‐3′ and osteoclast‐associated receptor (OSCAR) reverse, 5′‐GATCCGTTACCAGCAGTTCCAGA‐3′; TNF receptor‐associated factor 6 (TRAF6) forward, 5′‐CTGCAAAGCCTGCATCAT‐3′ and TRAF6 reverse, 5′‐AATGTGTGTATTAACCTGGC‐3′; c‐Fos forward, 5′‐AAGATGGCTGCAGCCAAGTG‐3′ and c‐Fos reverse, 5′‐TCCAGTTTTTCCTTCTCTTTCAGCA‐3′; nuclear factor of activated T cells, cytoplasmic 1 (NFATc1) forward, 5′‐TCATCCTGTCCAACACCAAA‐3′ and NFATc1 reverse, 5′‐TTGCGGAAAGGTGGTATCTC‐3′; cathepsin K (CatK) forward, 5′‐GAAGAAGACTCACCAGAAGCAG‐3′ and CatK reverse, 5′‐TCCAGGTTATGGGCAGAGATT‐3′; MMP‐9 forward, 5′‐CTGGACAGCCAGACACTAAAG‐3′ and MMP‐9 reverse, 5′‐CTCGCGGCAAGTCTTCAGAG‐3′; dendritic cell‐specific transmembrane protein (DC‐STAMP) forward, 5′‐CTTGCAACCTAAGGGCAAAG‐3′ and DC‐STAMP reverse, 5′‐TCAACAGCTCTGTCGTGACC‐3′; β‐actin forward, 5′‐GACGGGGTCACCCACACTGT‐3′ and β‐actin reverse, 5′‐AGGAGCAATGATCTTGATCTTC‐3′.
Statistical analysis
All data are shown as the mean ± standard deviation (s.d.). A two‐way repeated‐measures analysis of variance (anova) was used to evaluate comparisons of arthritis scores. Regarding comparisons between two groups, statistical analyses were performed using Student's t‐test. P < 0·05, P < 0·01 and P < 0·001 were considered significant in all analyses.
Results
Assessment of RA model mice
SKG mice were divided into six groups, as shown in Fig. 1b. The arthritis score established by Sakaguchi was recorded every week in order to assess the RA model mice used in the present study 27. A single injection of LA led to a slightly higher RA score than that in the control group (PBS injection) at 6 weeks (control group: 0, LA group: 0·85 ± 0·41). The Pg/LA group had the highest RA score among all groups tested (3·4 ± 1·31). The single Pg injection did not increase the RA score in SKG mice (0·2 ± 0·35). Twenty weeks’ feeding of SKG mice with LA single injection showed the same RA score as the LA‐injected group with Pg infection (3·65 ± 1·19). As a control bacterium, Ec was injected instead of Pg. A slight increase was observed in the arthritis score of the Ec/LA group, whereas the arthritis score remained unchanged in the Ec group (Fig. 2).
Figure 2.
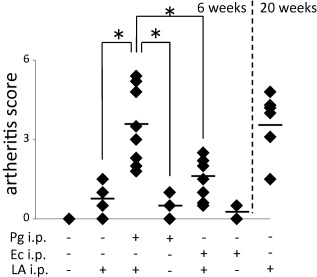
Evaluation of joint swelling after 6 weeks. Joint swelling was quantified using Sakaguchi's arthritis score (AS) for 6 weeks after the immunization with bacteria [1·0 × 108 colony‐forming units (CFU)/mouse] and laminarin (LA). The solid mark shows the results of AS after 20 weeks of LA single injection as the positive controls of rheumatoid arthritis (RA). A two‐way repeated‐measures analysis of variance (anova) was used to compare AS (n = 10, *P < 0·05 Porphyromonas gingivalis (Pg)/LA versus Pg or LA).
Three‐dimensional analysis of the ankle joint in SKG mice
Three‐dimensional pictures of the ankle joint in six groups were analysed by microCT (Fig. 3a–f). The permeability of the ankle joint was increased in the Pg/LA group. An increase in the thickness of soft tissue around the ankle joint was also observed in the Pg/LA group (Fig. 3d). Naked‐eye observations of the ankle joint in the Pg/LA group showed more severe swelling than in the other groups (Fig. 3d). As the positive control, which was reported previously 27, the single LA injection led to mild swelling of the ankle joint at 20 weeks (Fig. 3g). As the control of Pg infection, Ec infection did not affect the thickness of soft tissue around the ankle joint (Fig. 3e,f).
Figure 3.
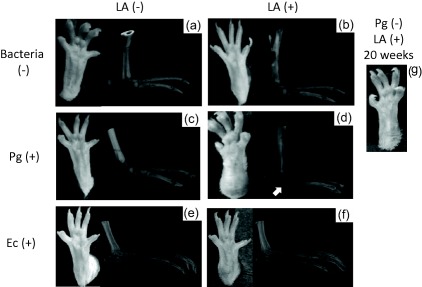
Photographic and microcomputed tomography (microCT) images of ankle joint. Typical photographic and microCT images were shown of ankle joints from each group. (a–f) 6 weeks, (g) 20 weeks in the (a) control group, (b) laminarin (LA) group, (c) Porphyromonas gingivalis (Pg) group, (d) Pg/LA group, (e) Escherichia coli (Ec) group, (f) Ec/LA group, and (g) is the group with single injection of LA after 20 weeks. The white arrowhead in (d) shows the thickening of soft tissue in the ankle joint.
Histological observations of the ankle joint
Sections of the ankle joint from six groups of SKG mice were analysed by H&E staining. The infiltration of immune cells in the subdermal connective tissue was detected in the LA and Pg/LA groups (Fig. 4c,d, respectively). A slight increase in immune cells in connective tissue was noted in the Pg group (Fig. 4b). Hyperplasia of the synovial membrane, known clinically as pannus, was observed in the Pg/LA group (Fig. 4d). The infiltration of immune cells and marginal erosion of the bone were noted in the Ec/LA group (Fig. 4f). A single injection of Ec had no significant effect on joint swelling (Fig. 4e). However, the number of lymphocytes in the Ec and Ec/LA groups was lower than that of the Pg and Pg/LA groups, respectively (Fig. 4m). TRAP staining was also performed on the ankle tissue. A large number of TRAP+ osteoclasts was detected at the interface between the pannus and bone in the Pg/LA group (Fig. 4j). However, a higher number of osteoclasts was not observed in the control group (Fig. 4g). A slight increase in the number of osteoclasts was noted at the surface of the bone in the Pg, LA, Ec and Ec/LA groups (Fig. 4h, i,k–l,n).
Figure 4.
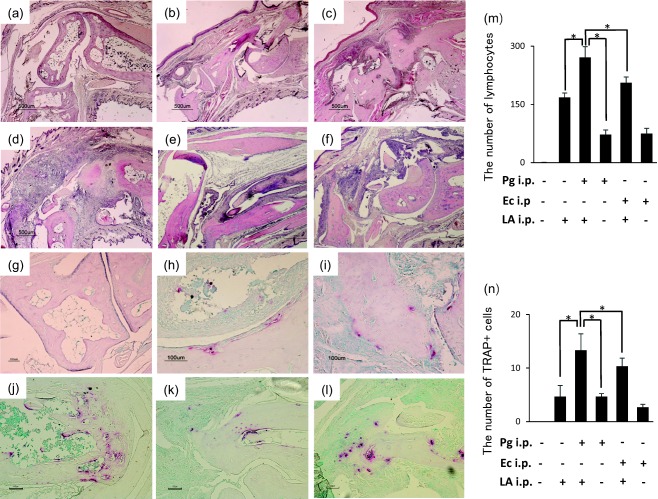
Microscopic features of joint tissue stained by haematoxylin and eosin (H&E) and tartrate‐resistant acid phosphatase kit (TRAP). (a–f) H&E staining. (a) Control group, (b) Porphyromonas gingivalis (Pg) group, (c) laminarin (LA) group, (d) Pg/LA group, (e) Escherichia coli (Ec) group, (f) Ec/LA group. Original magnification ×40; scale bar, 500 µm. (g–l) TRAP staining. (g) Control group, (h) Pg group, (i) LA group, (j) Pg/LA group, (k) Ec group, (l) Ec/LA group. Original magnification ×200; scale bar, 100 µm. The black arrowhead in (d) shows the pannus in the ankle joint. The number of lymphocytes and TRAP‐positive cells in the randomly selected diseased site (three sites/picture) were counted and compared among the different groups (m and n). A two‐way repeated‐measures analysis of variance (anova) was used to compare the number of infiltrated immune cells and TRAP‐positive cells. *P < 0·05.
Clinical parameters of RA in SKG mice
In order to assess the severity of RA, ACPA, anti‐Pg IgG and MMP‐3 levels in serum were measured by ELISA. ACPA levels were significantly higher in the Pg/LA group than in the 6‐week LA group (2·01 ± 0·57). This increase was the same as that observed in the LA group at 20 weeks. ACPA levels were increased slightly in the Pg group (0·82 ± 0·03) (Fig. 5a). ACPA levels in the Ec/LA group showed a slight increase (1·34 ± 0·20) (Fig. 5a). However, a single injection of Ec did not show an increase of ACPA (Fig. 5a). The anti‐Pg IgG and anti‐Ec IgG titres in serum were measured in order to confirm infections by bacteria in the six groups of SKG mice. The anti‐Pg IgG titre was elevated significantly in the Pg and Pg/LA groups (Fig. 5c). The anti‐Ec IgG titre was elevated significantly in the Ec and Ec/LA groups (Fig. 5d). The MMP‐3 level, which is a clinically important marker of RA, was also measured. MMP‐3 levels were markedly higher in the Pg and Pg/LA groups than in the control and LA groups (Pg/LA group: 1·65 ± 0·14 ng/ml) (Fig. 5b).
Figure 5.
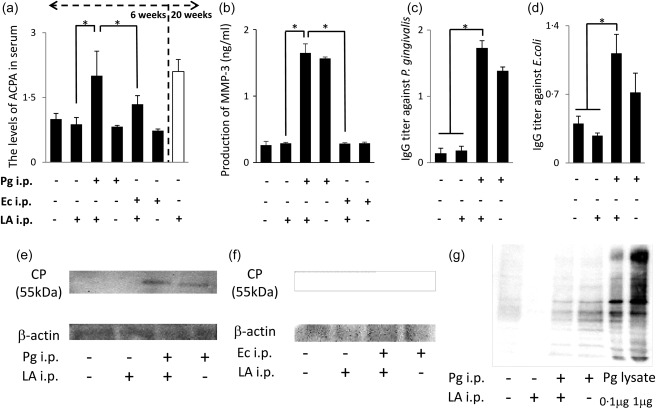
Clinical markers of serum in rheumatoid arthritis (RA)‐induced mice. (a) The anti‐cyclic citrullinated protein (CP) antibody (ACPA) titre in the serum of mice from each group was measured by enzyme‐linked immunosorbent assay (ELISA) (n = 7, *P < 0·05), Porphyromonas gingivalis (Pg)/laminarin (LA) versus LA or Escherichia coli (Ec)/LA). The group on the right represents the single injection of LA after 20 weeks as the positive controls of RA. (b) The mean production of matrix metalloproteinase‐3 (MMP‐3) in serum after 6 weeks (n = 6, *P < 0·05). (c) The mean immunoglobulin (Ig)G titre against Pg in serum after 6 weeks (n = 6, *P < 0·05). (d) The mean IgG titre against Ec in serum after 6 weeks (n = 6, *P < 0·05). (e–g) Detection of CP and Pg components in the soft tissue of the ankle by Western blotting. Each sample consisted of soft tissue from the ankle joint, which was homogenized after adjusting 5 mg.
Detection of CP and Pg components in the ankle joint
The connective tissue of the ankle joint was collected from six groups of SKG mice in order to assess the presence of CP and Pg components by Western blotting. CP was detected in the Pg and Pg/LA groups (Fig. 5e). In particular, CP levels were higher in the Pg/LA group than in the Pg group. However, CP was not detected in the Ec and Ec/LA groups (Fig. 5f). The presence of Pg components in the tissue of the ankle joint was confirmed in the Pg and Pg/LA groups (Fig. 5g).
Production of cytokines in serum
The levels of multiple cytokines in serum were measured in the six groups of SKG mice using the Bio‐Plex Pro mouse cytokine GI 23 plex panel (n = 6). The IL‐3 and IL‐4 levels were below the detection limit in all the samples examined. No significant differences between the six groups were observed in IL‐1α, IL‐5, IL‐9, IL‐13, IL‐17A, GM‐CSF, IFN‐γ, TNF‐α, MIP‐1β, eotaxin, MCP‐1 or RANTES. IL‐1β levels were higher in the LA, Pg, Ec, Ec/LA and Pg/LA groups than in the control group (141·3 ± 10·1, 250·8 ± 86·7, 307·9 ± 199·3, 176·4 ± 98·0 and 259·1 ± 122·5 pg/ml, respectively) (Fig. 6h). IL‐12 levels were higher in the Pg, Ec, Ec/LA and Pg/LA groups than in the control and LA groups (252·3 ± 36·6, 288·1 ± 76·5, 265·2 ± 39·2 and 202·3 ± 44·6 pg/ml, respectively) (Fig. 6f). IL‐10 levels were higher in the Pg/LA and Ec groups than in the other groups (53·8 ± 7·5 and 60·8 ± 27·7 pg/ml, respectively) (Fig. 6e). Most interestingly, serum levels of MIP‐1α, IL‐2, IL‐6 and CXCL1 were significantly higher in the Pg/LA group than in the other groups (411·3 ± 46·8, 95·5 ± 6·36, 375·5 ± 0·71, 405·8 ± 21·57, 53·8 ± 2·47 and 835 ± 45·25 pg/ml, respectively) (Fig. 6a–d). Although there was no statistical difference, G‐CSF production was highest in the Pg/LA group among the six groups of mice examined (149·5 ± 122·5 pg/ml) (Fig. 6g).
Figure 6.
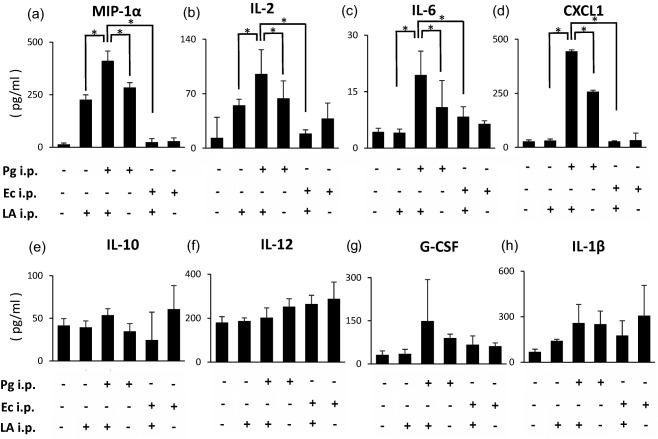
Comprehensive analysis of cytokine levels in serum from SKG mice. Cytokine levels were measured in comprehensively serum (n = 6). Serum from six groups of SKG mice was analysed by the Bio‐Plex system (Bio‐Plex Pro mouse 23‐plex assay kit). Cytokine levels in all serum samples used in this study were examined at the same time in duplicate. Distribution of serum molecules in the narcolepsy group was compared with that in the healthy control group using Student's t‐test (two‐tailed test).
Osteoclast differentiation from BMCs derived from SKG mice
The cellular source of cytokines induced in the Pg/LA group was mainly mononuclear cells, as shown in Fig. 6. Therefore, in order to clarify the mechanism responsible for severe bone resorption in the ankle joint, osteoclast differentiation from BMCs was determined in the six groups. The number of multi‐nuclear giant cells in BMCs derived from mice was markedly higher in the Pg/LA group than in the other groups (50·3 ± 4·51 cells/well) (Fig. 7g). As shown in Fig. 7e, BMCs derived from the Pg/LA group differentiated markedly into osteoclast. Furthermore, not only the numbers of osteoclasts, but also their sizes, was remarkably larger in the Pg/LA group than in the other groups. BMCs from the Ec and Ec/LA groups showed a slight osteoclast differentiation compared with the Pg/LA group (Fig. 7c,f).
Figure 7.
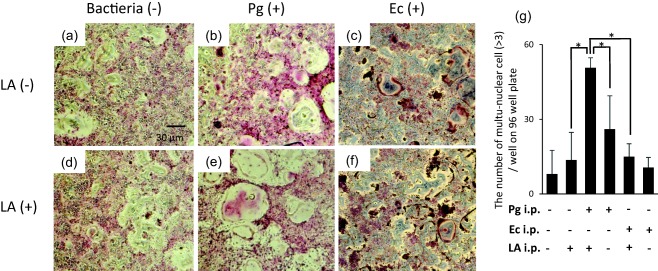
Osteoclast differentiation from bone marrow mononuclear cells (BMCs) of SKG mice. (a) After the separation of BMCs from each group of SKG mice using Histopaque 1083®, BMCs (2 × 10⁵ cells/well) were cultured on 96‐well plates in the presence of soluble nuclear factor kappa B ligand (sRANKL) (50 ng/ml) and macrophage colony‐stimulating factor (M‐CSF) (20 ng/ml) for 7 days. The number of osteoclasts with multiple nuclei (> 3) on 96‐well plates was counted. The data summarized are the results obtained from three independent experiments (in each group of n = 5 mice). *Significantly higher number of osteoclasts by Student's t‐test (*P < 0·05). (b) Representative tartrate‐resistant acid phosphatase kit (TRAP)‐stained images of multinuclear osteoclasts on 96‐well plates on day 7. Original magnification ×100; scale bar, 30 µm.
Expression of osteoclast differentiation‐related genes in BMCs
The mRNA expression levels of RANK, OSCAR, TRAF6, c‐Fos, NFAT1c, catK, MMP‐9 and DC‐STAMP, which have been correlated strongly with the osteoclastogenesis of BMCs in the presence of sRANKL and M‐CSF after 0 and 72 h, were determined by real‐time PCR (Fig. 8a–i). The induction of mRNA expression of osteoclast differentiation‐related genes in the LA, Pg, Ec and Ec/LA groups was slightly stronger than in the control group. Importantly, the induction of mRNA expression was highest in the Pg/LA group among the six groups tested. Furthermore, the basal mRNA expression of RANK (0 h) in BMCs was markedly stronger in the Pg/LA group than in the other groups (111·3‐fold higher than control) (Fig. 8i). Most interestingly, the mRNA expression of RANK of 0 and 72 h in BMCs did not show any statistical difference (Fig. 8j). Therefore, this primed induction of RANK in BMCs derived from the Pg/LA group may be one of the causes of severe swelling and the disruption of joint bone.
Figure 8.
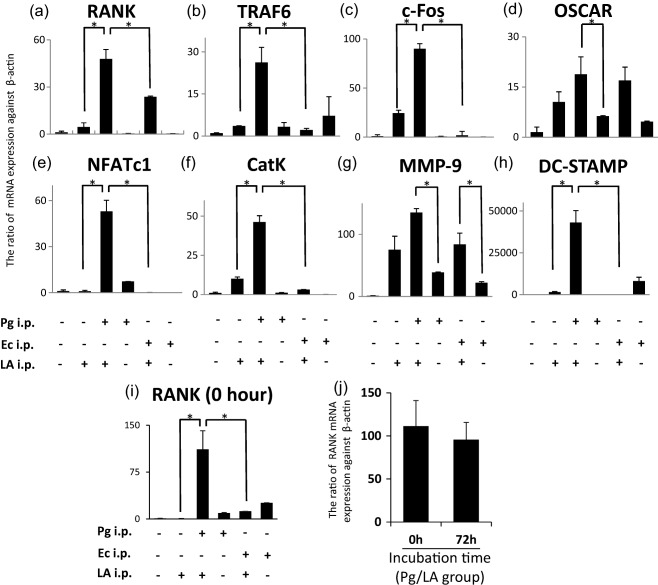
mRNA expression of osteoclastogenesis‐related gene in bone marrow mononuclear cells (BMCs) of SKG mice. In order to determine the mRNA expression levels of osteoclast differentiation‐related genes in BMCs by real‐time polymerase chain reaction (PCR), mononuclear cells separated from BMCs were cultured for 72 h and induced to osteoclasts by macrophage colony‐stimulating factor (M‐CSF) and soluble nuclear factor kappa B ligand (sRANKL). Cells were centrifuged in order to purify total RNA for the analysis of the mRNA expression levels. Values represent the means and standard deviations of triplicate experiments. The y‐axis shows the ratio against β‐actin mRNA expression levels in cultured cells. *Significantly higher mRNA expression of osteoclast differentiation‐related genes by Student's t‐test (*P < 0·05).
Discussion
Accumulated evidence has revealed that there is a strong epidemiological correlation between RA and periodontitis. However, the mechanistic link between periodontitis, particularly infections by Pg and RA, is still elusive. In the present study, we demonstrated that Pg infection exacerbated the clinical symptoms of RA in the SKG mouse model. Importantly, swelling of the ankle joint was more severe in the Pg/RA group than in the LA group during the early phase. Infection by Pg also induced osteoclastgenesis strongly in the LA group. Furthermore, Pg infection induced immune response and RA symptoms strongly, compared with Ec infection. Increases in IL‐6 and TNF‐α levels, the detection of RF and ACPA levels in serum were used previously as the diagnostic markers of RA patient 28. Pg infection has also been shown to up‐regulate cytokine levels in serum and periodontal tissue 29. This increase may be the main cause of the exacerbation of RA by Pg in the mouse model used in the present study. A previous study reported that the elimination of oral bacteria ameliorated the clinical symptoms of RA 30. Therefore, clarification of the effects of Pg infection on the progression of RA is needed. Regarding the systemic influence of Pg infection in RA, Pg directly induces inflammation by activating immune cells and also produces CP derived from α‐enolase, fibronectin and vimentin by PgPAD 14. Increases of CP levels may promote the progression of RA through the excessive production of ACPA. Most interestingly, our in‐vivo mouse model showed an increase in the production of CP in the ankle joint tissue following a systemic injection of Pg (Fig. 5d). However, increases in CP protein levels were not observed in serum. Therefore, systemic infection by Pg may affect the ankle joint locally, which is the diseased site. In CIA model, it is reported that the administration of Pg exacerbated RA in this model with CP elevations. Currently, however, it remains unclear whether the origin of CP in the joint tissue is derived from endogenous PAD or PgPAD. The different RA model used in the present study, the SKG mouse, was established as the RA model, which has a syndrome that shares similar features with human RA 24. SKG mouse have a single point mutation in ZAP‐70 gene. Autoimmune disease could be induced as a result of the mutation and abnormal immune response 25. Therefore, activation of the systemic immune response could be affected in the onset of RA. Taken together, use of the SKG mouse as a RA model has the advantage of systemic induction by LA. Although the cause of RA has been attributed to increases in CP levels by over‐expression of PAD and dysfunction of HLA‐DR, SLC22A3 and RUNX2 31, our results did not clarify which PAD (endogenous PADI4 or Pg‐derived PAD) is the candidate increasing CP level. The mRNA expression of PgPAD differed among the strains examined. The pathogenic strains of W83 (fim type IV) and HW24D1 (fim type II) showed stronger expression patterns of PgPAD than that of strain 33277 (fim type I) (data not shown). These results indicated that the attachment of bacteria to host cells influenced the progression of RA. Therefore, Pg knock‐out mutants and differences in the ability to construct CP with RA induction among Pg strains need to be analysed for future study. In order to determine the involvement of endogenous PAD (PADI4), mutations in which are major risk factors for RA, different Pg strains were used to infect Pg/LA mice 32. However, the production of PADI4 in the joint tissue and serum of Pg/LA mice did not vary among the Pg strains tested (data not shown). This result suggests that PgPAD is the major source of CP in the diseased site. The systemic injection of Pg and i.p. injection of LA induced RA strongly by 6 weeks (Fig. 2). Joint swelling and destruction (the RA symptoms) were detected previously at 20 weeks in SKG mice following a single injection of LA 27. This discrepancy is due to induction of the immune response by initiating Pg systemic injection. E. coli stimulation did not induce specific immune responses or joint swelling from those induced by the Pg infection in the mouse model (Figs 2, 3, 4, 5, 6, 7, 8). Therefore, one of the causative effects of Pg has been attributed to surface antigens that activate strong immune responses. In order to clarify differences in tissue destruction, cytokine levels were determined in serum and joint tissue. A comprehensive analysis of cytokines by the Bio‐Plex system showed that the production of IL‐2, IL‐6, CXCL1 and MIP‐1α in serum was highest among the six groups tested (Fig. 6). As the Bio‐Plex results showed monocyte‐related elevation in cytokines, the differentiation of immature monocytes occurred during osteoclastogenesis 33. As shown in the present study, the numbers of multi‐nuclear and giant cells with inducing osteoclast differentiation‐related mRNA in monocytes were observed in the Pg/LA group compared with the other groups. In each group, RANK and NFATc1 mRNA were induced significantly in the mouse model. RANKL induces the formation of osteoclast in the presence of M‐CSF as co‐stimulatory signals 34. RANKL induces the activation of TRAF6 and c‐Fos pathways, which leads to the autoamplification of NFATc1, the master transcription factor for osteoclast differentiation 35. NFATc1 has been identified as the master regulator of osteoclast differentiation in bone remodelling and diseased bone resorption 36. Induction of RANK in the Pg/LA group was also highest among the six groups tested. Although stimulation by Pg may not have affected monocytes derived from BMCs in the in‐vitro experiment directly, baseline of RANK expression was determined. Most importantly, the mRNA expression levels of RANK were higher than in the other groups at 0 h. This high baseline expression level of RANK may be the main reason for the existence of osteoclasts in the joint tissue and the in‐vitro experiment. Aggregatibacter actinomycetemcomitans (Aa) is also a periodontopathogenic bacterium that induces osteoclastogenesis by activating RANKL–RANK signalling, similar to our RA mouse model. Infection by Aa (not shown in this study) and E. coli induced RA symptoms weakly. The bacterial components affecting osteoclastogenesis have been identified as LPS and Omps 37. Interestingly, the target molecule of LPS differs between Pg and other bacteria. LPS derived from Pg is recognized mainly by TLR‐2 38. Conversely, LPS from E. coli is detected by TLR‐4 39. This difference also affects immune responses and the severity of clinical symptoms.
In the present study, mice were infected with Pg infection via an i.p. injection in order to simplify the systemic effects of Pg in the in‐vivo experiment. In our model, there is a possibility that acute inflammation by LPS derived from Pg induced RA as the result of the endotoxin shock. However, fewer than 109 bacterial cells/mouse show 100% survival after several injections. As an endotoxin shock mice model, pretreatment of mice by a low amount of LPS showed a prolonged survival rate 40. The cytokine levels in the early phase of our mice model did not show a dramatic increase. Therefore, we think that our model [108 colony‐forming units (CFU) Pg infection/mouse] is not severe acute inflammation. Although the major site of bacterial detection or penetration of the host barrier is the mucosal tissue surface, the mechanisms by which arthrogenic bacteria colonize and induce RA via systemic infection and reach the joint tissue currently remain unclear. In this mouse model, increases of cytokine levels were detected in serum following an i.p. injection of Pg. The localization of Pg‐derived proteins in joint tissue was also noted. Although the route of Pg infection is unclear, Pg bacterial cells or Pg‐derived protein might be moved to the joint tissue, as reported previously 41. An oral Pg infection model needs to be analysed in order to determine the effects of Pg infection physiologically. Orally applied bacteria are also known to influence bacterial flora. The administration of Pg resulted in increases in the proportion of the phylum Bacteroidetes, decreases in the proportion of the phylum Firmicutes and higher serum endotoxin levels in C57BL/6 mice. However, in this model, the colonization of Pg was not confirmed 42. Therefore, further studies are needed in order to clarify the molecular mechanisms underlying the involvement of Pg infection in the onset of RA.
Author contributions
M. Y., K. O., M. K. and S. M. established the animal experiments in this study. K. T. and N. M. performed the histological experiments. S. Y. and E. S. evaluated the R. A. symptoms in animal experiments. T. F. addressed the statistical analysis. H. K. co‐ordinated this study.
Disclosure
The authors declare no conflicts of interest associated with this manuscript.
Acknowledgments
This research was supported by a Grant‐in‐Aid for the Encouragement of Young Scientists (B) (25862051) and for Scientific Research (C) (15K11390) from the Japan Society for the Promotion of Science.
References
- 1. Socransky SS, Haffajee AD. Implications of periodontal microbiology for the treatment of periodontal infections. Compend Suppl 1994; 18:S684–5, 8–93; quiz S714–7. [PubMed] [Google Scholar]
- 2. Kadowaki T, Nakayama K, Okamoto K et al Porphyromonas gingivalis proteinases as virulence determinants in progression of periodontal diseases. J Biochem 2000; 128:153–9. [DOI] [PubMed] [Google Scholar]
- 3. Amano A, Nakagawa I, Okahashi N, Hamada N. Variations of Porphyromonas gingivalis fimbriae in relation to microbial pathogenesis. J Periodontol Res 2004; 39:136–42. [DOI] [PubMed] [Google Scholar]
- 4. Abe N, Baba A, Takii R et al Roles of Arg‐ and Lys‐gingipains in coaggregation of Porphyromonas gingivalis: identification of its responsible molecules in translation products of rgpA, kgp, and hagA genes. Biol Chem 2004; 385:1041–7. [DOI] [PubMed] [Google Scholar]
- 5. Barksby HE, Nile CJ, Jaedicke KM, Taylor JJ, Preshaw PM. Differential expression of immunoregulatory genes in monocytes in response to Porphyromonas gingivalis and Escherichia coli lipopolysaccharide. Clin Exp Immunol 2009; 156:479–87. [DOI] [PMC free article] [PubMed] [Google Scholar]
- 6. Rocchietta I, Nisand D. A review assessing the quality of reporting of risk factor research in implant dentistry using smoking, diabetes and periodontitis and implant loss as an outcome: critical aspects in design and outcome assessment. J Clin Periodontol 2012; 39:114–21. [DOI] [PubMed] [Google Scholar]
- 7. Scher JU, Bretz WA, Abramson SB. Periodontal disease and subgingival microbiota as contributors for rheumatoid arthritis pathogenesis: modifiable risk factors? Curr Opin Rheumatol 2014; 26:424–9. [DOI] [PMC free article] [PubMed] [Google Scholar]
- 8. Han YW, Wang X. Mobile microbiome: oral bacteria in extra‐oral infections and inflammation. J Dent Res 2013; 92:485–91. [DOI] [PMC free article] [PubMed] [Google Scholar]
- 9. Goronzy JJ, Weyand CM. Developments in the scientific understanding of rheumatoid arthritis. Arthritis Res Ther 2009; 11:249. [DOI] [PMC free article] [PubMed] [Google Scholar]
- 10. Karlson EW, Deane K. Environmental and gene–environment interactions and risk of rheumatoid arthritis. Rheum Dis Clin North Am 2012; 38:405–26. [DOI] [PMC free article] [PubMed] [Google Scholar]
- 11. Korczowska I. Rheumatoid arthritis susceptibility genes: an overview. World J Orthop 2014; 5:544–9. [DOI] [PMC free article] [PubMed] [Google Scholar]
- 12. Suwannalai P, Trouw LA, Toes RE, Huizinga TW. Anti‐citrullinated protein antibodies (ACPA) in early rheumatoid arthritis. Mod Rheumatol 2012; 22:15–20. [DOI] [PubMed] [Google Scholar]
- 13. Song YW, Kang EH. Autoantibodies in rheumatoid arthritis: rheumatoid factors and anticitrullinated protein antibodies. QJM 2010; 103:139–46. [DOI] [PMC free article] [PubMed] [Google Scholar]
- 14. Wegner N, Wait R, Sroka A et al Peptidylarginine deiminase from Porphyromonas gingivalis citrullinates human fibrinogen and alpha‐enolase: implications for autoimmunity in rheumatoid arthritis. Arthritis Rheum 2010; 62:2662–72. [DOI] [PMC free article] [PubMed] [Google Scholar]
- 15. Maresz KJ, Hellvard A, Sroka A et al Porphyromonas gingivalis facilitates the development and progression of destructive arthritis through its unique bacterial peptidylarginine deiminase (PAD). PLOS Pathog 2013; 9:e1003627 [DOI] [PMC free article] [PubMed] [Google Scholar]
- 16. Lundberg K, Wegner N, Yucel‐Lindberg T, Venables PJ. Periodontitis in RA‐the citrullinated enolase connection. Nat Rev Rheumatol 2010; 6:727–30. [DOI] [PubMed] [Google Scholar]
- 17. Ortiz P, Bissada NF, Palomo L et al Periodontal therapy reduces the severity of active rheumatoid arthritis in patients treated with or without tumor necrosis factor inhibitors. J Periodontol 2009; 80:535–40. [DOI] [PMC free article] [PubMed] [Google Scholar]
- 18. Niu X, Chen G. Clinical biomarkers and pathogenic‐related cytokines in rheumatoid arthritis. J Immunol Res 2014; 2014:698192. [DOI] [PMC free article] [PubMed] [Google Scholar]
- 19. Golub LM, Payne JB, Reinhardt RA, Nieman G. Can systemic diseases co‐induce (not just exacerbate) periodontitis? A hypothetical ‘two‐hit’ model. J Dent Res 2006; 85:102–5. [DOI] [PubMed] [Google Scholar]
- 20. Marchesan JT, Gerow EA, Schaff R et al Porphyromonas gingivalis oral infection exacerbates the development and severity of collagen‐induced arthritis. Arthritis Res Ther 2013; 15:R186. [DOI] [PMC free article] [PubMed] [Google Scholar]
- 21. de Aquino SG, Abdollahi‐Roodsaz S, Koenders MI et al Periodontal pathogens directly promote autoimmune experimental arthritis by inducing a TLR2‐ and IL‐1‐driven Th17 response. J Immunol 2014; 192:4103–11. [DOI] [PubMed] [Google Scholar]
- 22. Kinloch AJ, Ng K, Wright GP. Clinical applications of autoimmunity to citrullinated proteins in rheumatoid arthritis, from improving diagnostics to future therapies. Recent Pat Inflamm Allergy Drug Discov 2011; 5:108–27. [DOI] [PubMed] [Google Scholar]
- 23. Burkhardt H, Sehnert B, Bockermann R, Engstrom A, Kalden JR, Holmdahl R. Humoral immune response to citrullinated collagen type II determinants in early rheumatoid arthritis. Eur J Immunol 2005; 35:1643–52. [DOI] [PubMed] [Google Scholar]
- 24. Sakaguchi N, Takahashi T, Hata H et al Altered thymic T‐cell selection due to a mutation of the ZAP‐70 gene causes autoimmune arthritis in mice. Nature 2003; 426:454–60. [DOI] [PubMed] [Google Scholar]
- 25. Hata H, Sakaguchi N, Yoshitomi H et al Distinct contribution of IL‐6, TNF‐alpha, IL‐1, and IL‐10 to T cell‐mediated spontaneous autoimmune arthritis in mice. J Clin Invest 2004; 114:582–8. [DOI] [PMC free article] [PubMed] [Google Scholar]
- 26. Ouhara K, Kawai T, Silva MJ et al Expression levels of novel cytokine IL‐32 in periodontitis and its role in the suppression of IL‐8 production by human gingival fibroblasts stimulated with Porphyromonas gingivalis . J Oral Microbiol 2012; 4. [DOI] [PMC free article] [PubMed] [Google Scholar]
- 27. Yoshitomi H, Sakaguchi N, Kobayashi K et al A role for fungal {beta}‐glucans and their receptor Dectin‐1 in the induction of autoimmune arthritis in genetically susceptible mice. J Exp Med 2005; 201:949–60. [DOI] [PMC free article] [PubMed] [Google Scholar]
- 28. Saeki Y, Kudo‐Tanaka E, Ohshima S et al Baseline anti‐citrullinated peptide antibody (ACPA) titers and serum interleukin‐6 (IL‐6) levels possibly predict progression of bone destruction in early stages of rheumatoid arthritis (ERA). Rheumatol Int 2013; 33:451–6. [DOI] [PubMed] [Google Scholar]
- 29. D'Aiuto F, Parkar M, Andreou G et al Periodontitis and systemic inflammation: control of the local infection is associated with a reduction in serum inflammatory markers. J Dent Res 2004; 83:156–60. [DOI] [PubMed] [Google Scholar]
- 30. Okada M, Kobayashi T, Ito S et al Periodontal treatment decreases levels of antibodies to Porphyromonas gingivalis and citrulline in patients with rheumatoid arthritis and periodontitis. J Periodontol 2013; 84:e74–84. [DOI] [PubMed] [Google Scholar]
- 31. Karlson EW, Ding B, Keenan BT et al Association of environmental and genetic factors and gene‐environment interactions with risk of developing rheumatoid arthritis. Arthritis Care Res (Hoboken) 2013; 65:1147–56. [DOI] [PMC free article] [PubMed] [Google Scholar]
- 32. Lee YH, Rho YH, Choi SJ, Ji JD, Song GG. PADI4 polymorphisms and rheumatoid arthritis susceptibility: a meta‐analysis. Rheumatol Int 2007; 27:827–33. [DOI] [PubMed] [Google Scholar]
- 33. Rauner M, Stein N, Winzer M et al WNT5A is induced by inflammatory mediators in bone marrow stromal cells and regulates cytokine and chemokine production. J Bone Miner Res 2012; 27:575–85. [DOI] [PubMed] [Google Scholar]
- 34. Takahashi N, Udagawa N, Suda T. A new member of tumor necrosis factor ligand family, ODF/OPGL/TRANCE/RANKL, regulates osteoclast differentiation and function. Biochem Biophys Res Commun 1999; 256:449–55. [DOI] [PubMed] [Google Scholar]
- 35. Asagiri M, Takayanagi H. The molecular understanding of osteoclast differentiation. Bone 2007; 40:251–64. [DOI] [PubMed] [Google Scholar]
- 36. Takayanagi H. The role of NFAT in osteoclast formation. Ann NY Acad Sci 2007; 1116:227–37. [DOI] [PubMed] [Google Scholar]
- 37. Taubman MA, Valverde P, Han X, Kawai T. Immune response: the key to bone resorption in periodontal disease. J Periodontol 2005; 76:2033–41. [DOI] [PubMed] [Google Scholar]
- 38. Kassem A, Henning P, Lundberg P, Souza PP, Lindholm C, Lerner UH. Porphyromonas gingivalis stimulates bone resorption by enhancing RANKL (receptor activator of NF‐kappaB ligand) through activation of toll‐like receptor 2 in osteoblasts. J Biol Chem 2015; 290:20147–58. [DOI] [PMC free article] [PubMed] [Google Scholar]
- 39. Jiang J, Zuo J, Hurst IR, Holliday LS. The synergistic effect of peptidoglycan and lipopolysaccaride on osteoclast formation. Oral Surg Oral Med Oral Pathol Oral Radiol Endod 2003; 96:738–43. [DOI] [PubMed] [Google Scholar]
- 40. Kopanakis K, Tzepi IM, Pistiki A et al Pre‐treatment with low‐dose endotoxin prolongs survival from experimental lethal endotoxic shock: benefit for lethal peritonitis by Escherichia coli . Cytokine 2013; 62:382–8. [DOI] [PubMed] [Google Scholar]
- 41. Totaro MC, Cattani P, Ria F et al Porphyromonas gingivalis and the pathogenesis of rheumatoid arthritis: analysis of various compartments including the synovial tissue. Arthritis Res Ther 2013; 15:R66 [DOI] [PMC free article] [PubMed] [Google Scholar]
- 42. Nakajima M, Arimatsu K, Kato T et al Oral administration of P. gingivalis induces dysbiosis of gut microbiota and impaired barrier function leading to dissemination of enterobacteria to the liver. PLOS ONE 2015; 10:e0134234 [DOI] [PMC free article] [PubMed] [Google Scholar]


