Abstract
Degeneracy in the genetic code, which enables a single protein to be encoded by a multitude of synonymous gene sequences, has an important role in regulating protein expression, but substantial uncertainty exists concerning the details of this phenomenon. Here we analyze the sequence features influencing protein expression levels in 6,348 experiments using bacteriophage T7 polymerase to synthesize messenger RNA in Escherichia coli. Logistic regression yields a new codon-influence metric that correlates only weakly with genomic codon-usage frequency, but strongly with global physiological protein concentrations and also mRNA concentrations and lifetimes in vivo. Overall, the codon content influences protein expression more strongly than mRNA-folding parameters, although the latter dominate in the initial ~16 codons. Genes redesigned based on our analyses are transcribed with unaltered efficiency but translated with higher efficiency in vitro. The less efficiently translated native sequences show greatly reduced mRNA levels in vivo. Our results suggest that codon content modulates a kinetic competition between protein elongation and mRNA degradation that is a central feature of the physiology and also possibly the regulation of translation in E. coli.
Keywords: Protein synthesis, codon usage, RNA structure, translational regulation, translational efficiency, RNA degradation, structural genomics
Degenerate encoding of 20 amino acids by 61 triplet nucleotide codons enables the same protein sequence to be synthesized by a vast number of synonymous mRNAs. While variations between synonymous sequences play an important role in regulating protein expression in organisms from E. coli1-7 to humans8, many details remain unclear1,3-5,9-13, as summarized in the Supplementary Information. Uncertainty exists concerning the influence of synonymous codons on translation efficiency1,3,5,9,10,12-17, the mechanistic basis of such effects4,9-11,15-31, and their relationship to mRNA folding effects3-7,16,32. Much of the codon-usage literature focuses on inefficient translation of a set of rare codons in E. coli1,5,7,14,19,21, especially the AUA codon for Ile18,20 and the AGA, AGG, and CGG codons for Arg1,6,27. On this basis, it is widely assumed that genomic codon-usage frequency, which parallels tRNA levels19,23, tracks translation-elongation rate and that infrequently used codons are translated inefficiently9,14,16,18,19,21,24,25,27,28. However, this assumption has been challenged by ribosome-profiling studies that concluded that net translation-elongation rate is generally constant, irrespective of codon usage10,11,33.
Investigations of the influence of mRNA sequence on protein expression are complicated by the fact that synonymous sequence changes simultaneously influence multiple parameters including codon identity, codon homogeneity, and mRNA folding, as well as other local and global sequence features ranging from codon-pair effects34,35 to overall A/U/C/G content. Most previous studies have focused on individual parameters or pairs of parameters in a local mRNA region1-3,5-7,11,13. To address this limitation, we performed statistical analyses of a large-scale protein-expression dataset, focusing on simultaneous evaluation of the influence of a wide variety of local and global mRNA sequence properties, and we tested the resulting mechanistic inferences using biochemical experiments. These studies provide insight into the influence of mRNA sequence features on protein expression in E. coli, including a new codon-influence metric with significant differences from previously described metrics. This metric correlates strongly with physiological mRNA levels and lifetimes in vivo, suggesting the dynamics of the ribosomal elongation cycle exert a significant influence on mRNA degradation that contributes to the biological effects of variations in synonymous codon usage.
Large-scale protein-expression dataset
We evaluated expression of 6,348 genes from diverse phylogenetic sources (Extended Data Fig. 1), which provided broad sampling of codon-space due to variations in codon-usage frequency. To minimize effects from coupling of translation to transcription by E. coli RNA polymerase36,37, the genes were transcribed by bacteriophage T7 RNA polymerase from a pET plasmid38. Protein expression38 was induced overnight in defined medium at 18 °C in E. coli BL21(DE3) cells containing pMGK, a compatible plasmid carrying a copy of the argU gene encoding the tRNA cognate to the AGA codon for Arg1,27. The analyzed proteins, selected to have less than 60% pairwise sequence identity, were expressed with a C-terminal LEHHHHHH affinity tag that was omitted from computational analyses. Based on visual inspection of whole cell lysates in Coomassie-blue-stained SDS-PAGE gels, we scored protein expression level on an integer scale from 0 (none) to 5 (highest) from two isolates of each plasmid, which rarely varied by more than ±1 (Fig. S1 in ref. 39). In the analyzed dataset, 28% and 31% of the proteins have scores of 0 and 5, respectively, while 41% have intermediate scores.
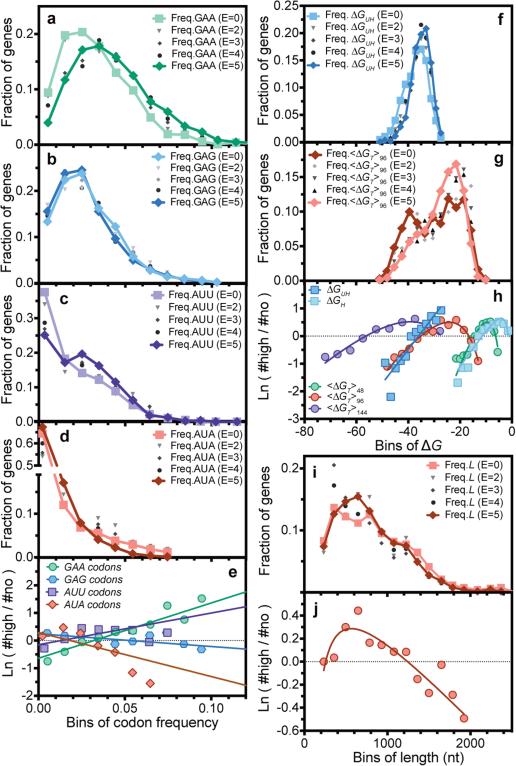
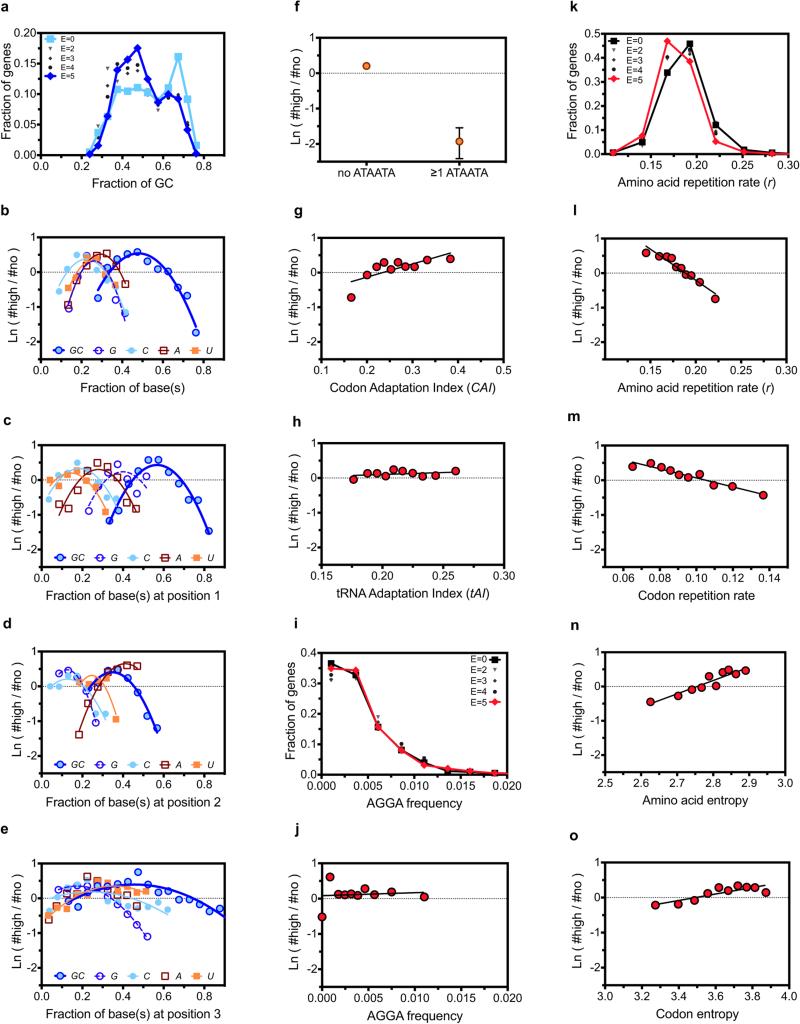
We evaluated distributions of a variety of mRNA sequence parameters, which revealed many differences between genes giving high vs. low protein expression (Fig. 1 and Extended Data Fig. 2). We examined histograms of the parameter distributions for the genes giving each score (Figs. 1a-d,f,g,i and Extended Data Fig. 2a,g,i), which show roughly monotonic changes with increasing score. We also examined “log-odds-ratio” plots of the natural logarithm of the ratio of the numbers of genes giving scores of 5 vs. 0 as a function of each parameter value (Fig. 1e,h,j and Extended Data Fig. 2b-f,h,j), which provide a graphical summary of the trends as well as guidance for mathematical modeling of the relationship between mRNA sequence parameters and protein expression. As described in the Supplementary Information, there are strong correlations between many individual mRNA sequence parameters and protein expression level (Fig. 1 and Extended Data Fig. 2), but they reflect both direct effects and indirect effects caused by parameter cross-correlations (Extended Data Fig. 3). Therefore, simultaneous multi-parameter modeling is required to estimate the actual influence of individual sequence parameters.
Figure 1. Distributions of representative RNA sequence parameters in protein-expression categories in the large-scale dataset.
(a-d, f, g and i) Histograms showing frequencies of GAA (panel a) and GAG (panel b) codons for Glu, AUU (panel c) and AUA (panel d) codons for Ile, partition-function free energy of folding41 of the 5’-UTR plus initial 16 codons or “Head” of each gene (ΔGUH, panel f), average partition-function free energy of folding in the remainder or “Tail” of each gene in 50% overlapping windows with width w (<ΔGT>w, panel g), and number of nucleotides in the protein-coding sequences (nts, panel i). Light colors, dark colors, and shades of gray show distributions in the E = 0, E = 5, and E = 1-4 categories, respectively. (e, h and j) Corresponding “log-odds” plots showing the logarithm of the ratio of the number of proteins in the E5 vs. E0 categories. Solid lines show single-variable binary generalized linear logistic regressions, i.e., fitting of log-odds ratio using a combination of the first and second powers and inverse of each individual parameter. Codon regressions were performed using exclusively the first power of frequency, yielding the dark gray codon slopes in Fig. 3a. P-values for regressions shown here other than GAA frequency are 3-45 orders of magnitude below the Bonferroni-corrected 5% confidence threshold of 2 × 10⁻⁴ (Supplementary File Boel2015LogisticRegressions.xlsx).
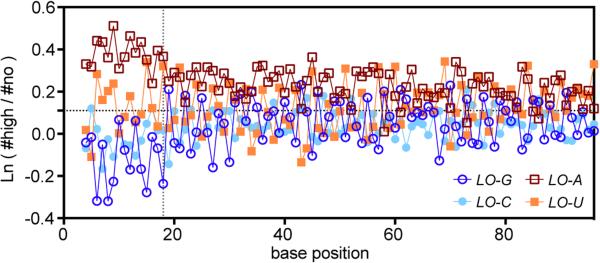
The first 18 nucleotides in the coding sequence, which are physically protected by the ribosome in the 70S initiation complex40, have a strong influence on expression (Fig. 2). In this region, G reduces and A increases probability of high expression6,7, while C/U have intermediate effects (Fig. 2). This rank-order matches the probability of base-pairing in ensembles of RNA structures (D.P. Aalberts, manuscript in preparation), suggesting the trend reflects a requirement for bases in this region to be unpaired for efficient ribosome docking6. (The periodicity of 3 in Fig. 2 comes from parameter cross-correlations in A/T-rich genes – see below.)
Figure 2. Log-odds ratio for E5 vs. E0 categories for proteins encoded by each nucleotide base at positions 4-96.
The gray dotted line approximates the region protected by the ribosome in the 70S initiation complex. Position 1 is A in the AUG initiation codon.
Logistic-regression analysis and modeling
We analyzed the influence of mRNA sequence parameters on protein expression in our large-scale dataset using logistic regression, which employs a generalized linear model to quantify the influence of continuous variables on binary or ordinal results. Binary modeling assumed the log-odds-ratio for 5 vs. 0 scores increases linearly with the value of some function of a continuous variable (e.g., codon frequency), whereas ordinal modeling assumed the logs-odds-ratio between successive integer scores increases in the same manner. The solid lines in Fig. 1e show the most probable slopes for a linear relationship between codon frequencies and the log-odds-ratio of 5 vs. 0 expression scores, which is the simplest form of binary logistic regression modeling. This simple linear model accurately describes the positive correlation of GAA (green in Fig. 1e). It is less accurate describing the negative correlation of AUA. Logistic regression can be performed using more complex mathematical functions of the continuous variable. Nonetheless, “codon slopes” from linear logistic-regressions provide a useful metric to quantify the influence of individual codons on protein expression.
We conducted such single-variable analyses on all 61 non-stop codons using binary or ordinal linear logistic regression (dark and light gray, respectively, in Fig. 3a). Relatively uniform variance in codon frequencies (Extended Data Fig. 4a) enables parameters for all codons to be determined with similar precision. Binary and ordinal regressions yield equivalent codon slopes, reinforcing our inference from parameter histograms (Figs. 1a-d,f,g,i and Extended Data Fig. 2a,i) that codon content has a roughly monotonic influence on expression. The equivalence of results comparing proteins with 0 vs. 5 scores to results including proteins with intermediate scores suggests features that partially attenuate expression can sometimes completely stop it, consistent with the data presented below linking features that impede translation to mRNA degradation.
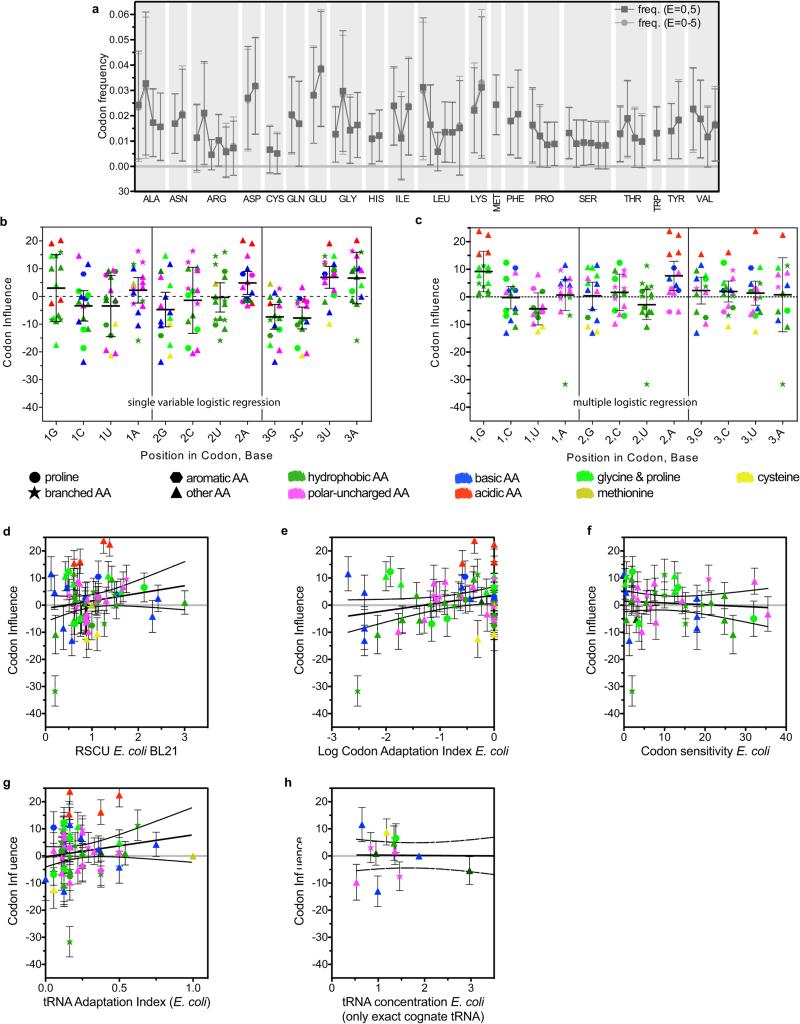
Figure 3. Codon influence on protein expression in the large-scale dataset.
(a) Slopes for every non-stop codon from single parameter binary logistic regression analyses of the E = 0 vs. E = 5 categories (dark gray), single parameter ordinal logistic regression analyses of the E = 0-5 categories (light gray), and simultaneous multi-parameter binary logistic regression analysis of the E = 0 vs. E = 5 categories (Model M in Table S1, colored symbols). Shapes and colors encode the structures and qualitative chemical characteristics of the sidechains, respectively. (b-c) Codon slopes from the multi-parameter binary logistic regression plotted against Kyte-Doolittle amino-acid hydrophobicity (panel b) or E. coli BL21 codon-usage frequency (panel c).
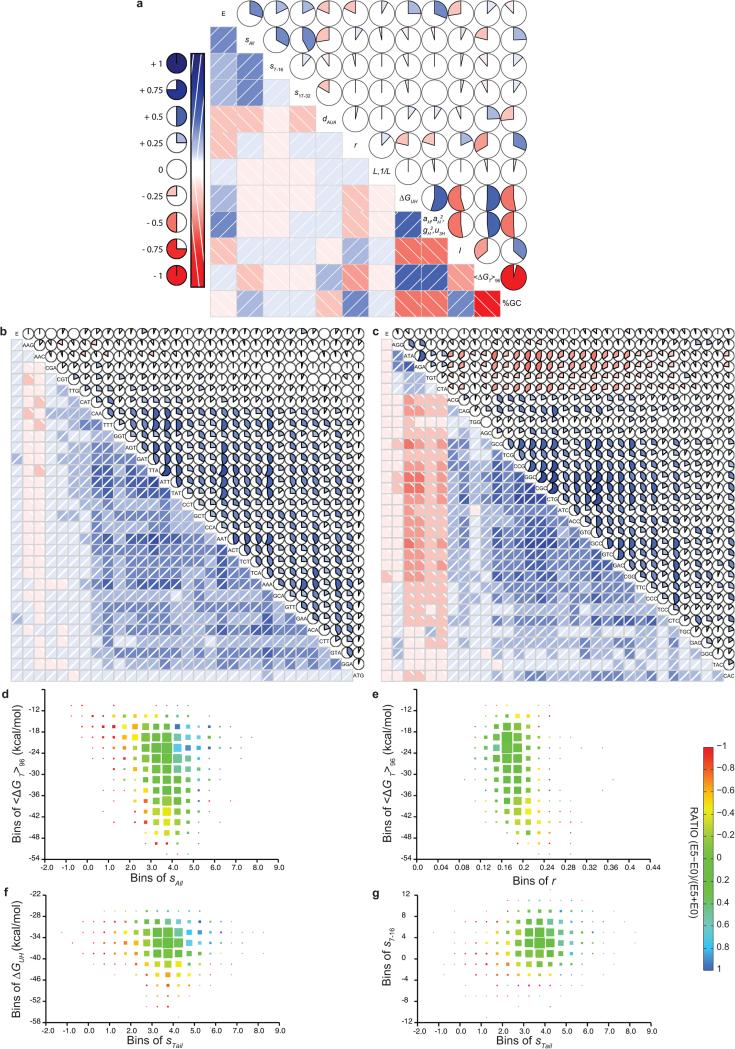
Single-parameter logistic regressions (Figs. 3a and Extended Data Fig. 4b) show codons ending in A/U are enriched in genes giving the highest expression, while synonymous codons ending in G/C are depleted. These results provide guidance for engineering genes that enhance protein expression by emulating the properties of our best-expressed genes, a strategy demonstrated below to be successful. However, these analyses do not provide reliable information on the influence of individual codons because the frequencies of codons ending in A and U are mutually correlated in genes in our dataset (Extended Data Fig. 3a-c), due at least in part to variations in A/T frequency in source organisms. Many parameters that vary systematically with expression level are mutually correlated (Extended Data Fig. 3). Parameters that do not directly influence outcome can appear influential in single-parameter regressions when their values are correlated with directly influential parameters.
Therefore, to dissect the mechanistic contributions of the parameters, we performed multi-parameter binary logistic-regression modeling, which simultaneously analyzes the influence of all parameters, although reliability in quantifying the influence of correlated parameters depends on the extent to which they vary independently in the dataset. Our final model (Model M in Extended Data Table 1) combines explanatory variables (Figs. 1-2 and Extended Data Fig. 2) after eliminating those redundant with correlated variables. The logarithm of the odds of observing 5 vs. 0 expression level is given by:
where ΔGUH is the predicted free energy of folding41 of the head plus 5’-UTR, I is a binary indicator that is 1 only if ΔGUH < −39 kcal and the GC content of codons 2-6 is greater than 62%, aH and gH are A and G frequencies in codons 2-6, u3H is U frequency at the 3rd position in codons 2-6, βc and fc are the slopes (colored symbols in Fig. 3a) and frequencies of each non-termination codon, s7-16 and s17-32 are the mean slopes for codons 7-16 and 17-32, dAUA is a binary variable that is 1 only if there is at least one AUA-AUA di-codon, r is the amino acid repetition rate, and L is the sequence length.
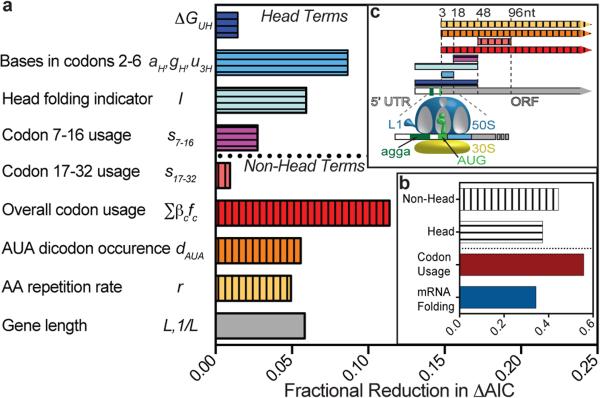
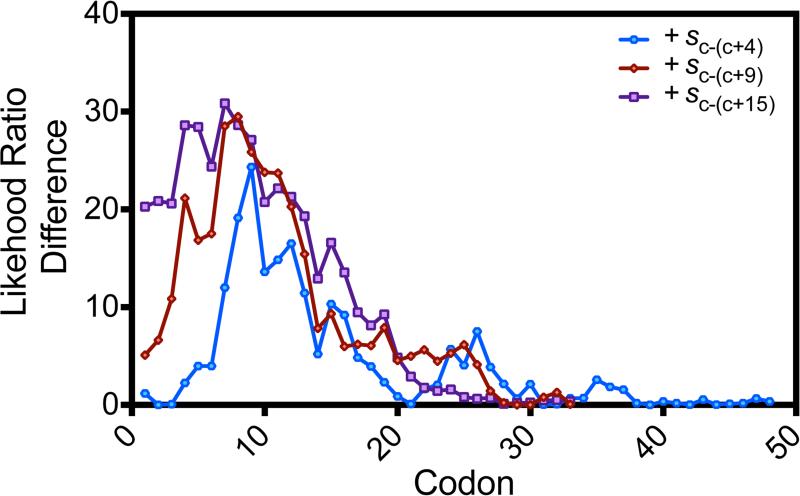
Calculating loss in predictive power when model terms are omitted gives the best estimate of the influence of sequence parameters (Fig. 4). The influence of the head is captured by the folding-energy and base-composition terms, which likely reflect accessibility of the translation initiation site for ribosome docking6,7,40, together with s7-16. The influence of the tail is captured by s17-32 together with the global terms (overall codon content, dAUA, r, and L). Our model indicates the influential mRNA-folding effects are restricted to the head and somewhat weaker than codon effects (Fig. 4b). The influence of individual codons is ~3 times stronger near the start of the gene and declines to a uniform level after codon ~32 (Extended Data Fig. 5), roughly matching the number of residues filling the ribosomal exit channel42. However, codon content in the tail is ~5 times more influential than the head because the tail is substantially longer. In-frame codon models are superior to out-of-frame and expanded models including adjacent 3’ or 5’ bases (Extended Data Table S1a and Methods.) Calculations also show the correlation between expression and the average predicted RNA folding energy in the tail (<GT>96) is attributable to its correlation with codon slopes and amino acid repetition rate (Extended Data Fig. 3d-e).
Figure 4. Contributions of physicochemical factors and regions of the coding sequence to protein-expression level.
(a-b) Bar graphs showing the fractional reduction in the magnitude of ΔAIC when omitting individual (panel a) or combinations (panel b) of terms prior to re-optimizing the remaining terms in Model M (Table S1). ΔAIC, the change in the Akaike Information Criterion, quantifies the predictive power of the model compared to random expectation. (c) Schematic illustrating the region of the protein-coding sequence included when calculating the term represented by the same color. Numbering starts at the first nucleotide (nt) in the start codon. Terms related to mRNA folding are shown in blue and cyan. Those related to codon usage are shown in red, orange, yellow, and magenta.
The codon slopes from our multi-parameter logistic-regression model (colored symbols in Fig. 3a) provide a new metric quantifying the influence of each codon on translation efficiency in E. coli. While some features of this codon-influence metric match previous conclusions, broad trends do not. The AUA codon for Ile, which is decoded by a non-cognate tRNA18,20, has the strongest expression-attenuating effect, and adjacent pairs have a significantly stronger effect than two non-adjacent AUAs (Extended Data Fig. 2f). The approximately neutral influence of the other codons for Ile indicates the expression-attenuating effect of AUA is not attributable to amino acid structure. Similarly, the CGG and CGA codons for Arg have strong expression-attenuating effects, while the four synonymous codons have weaker effects varying in direction. Among rare codons emphasized in the past to be deleterious1,18,19,24, four attenuate expression in our dataset (those cited above and CUA for Leu), whereas the other four do not (AGA and AGG for Arg, GGA for Gly, and CCC for Pro). The apparent influence of AGA and AGG, which have the lowest frequencies in E. coli, may be biased by overexpression in our experiments of the ArgU tRNA cognate to AGA1,27. The next three least frequent codons attenuate expression to widely varying extents, and codons with slightly higher frequencies do not (Fig. 3c and Extended Data Fig. 4d). There is no significant correlation between frequencies of the remaining 56 non-stop codons and their influence on expression (Fig. 3c and Extended Data Fig. 4d). Similarly, there is at most a weak correlation between our codon slopes and either the Codon Adaptation Index14, the Codon Sensitivity24, the tRNA Adaptation Index16, or estimated cognate tRNA concentrations23 (Extended Data Fig. 4e-h, respectively).
The most strongly expression-enhancing codons in Fig. 3a encode amino acids with sidechains that can act as general base catalysts (Glu, Asp, and His). Their codons ending A/U have stronger enhancing effects than synonymous codons ending G/C, indicating codon structure may modulate their translation efficiency. However, plotting codon slopes against amino acid hydrophobicity reveals a strong correlation (Fig. 3b), with charged residues having higher slopes than polar or hydrophobic residues, suggesting translation efficiency varies systematically with amino acid structure. Analyzing the slopes by the nucleotide at each codon position reveals trends (Extended Data Fig. 4c) likely to reflect conservation of physicochemical properties of amino acids among codons with the same bases at positions 1-2 rather than differences in translation efficiency attributable to base content.
Design and testing of efficiently translated genes
To test the predictive value of these analyses, we evaluated expression of synthetic genes designed using two methods emulating the codon-usage and mRNA-folding properties of genes giving the highest protein levels in our dataset (Figs. 5 and Extended Data Figs. 6-7). The “six amino acid” (6AA) method substitutes all Arg, Asp, Glu, Gln, His, and Ile codons with the synonymous codon having the highest single-variable logistic regression slope (dark gray in Fig. 3a). The resulting mRNAs are enriched in codons ending A/U, which give weaker folding energies than G/C. These mRNAs tend to have folding and other properties matching the genes giving the highest expression in our dataset, providing a concrete example of the parameter cross-correlations shown in Extended Data Fig. 3a-c. The “31 codon folding optimization” (31C-FO) method explicitly optimizes mRNA folding using just 31 codons with the highest single-variable logistic regression slopes for each amino acid; folding energy41 in the head (ΔGUH) was maximized (i.e., minimizing folding stability), whereas that in the tail (<ΔGT>48) was adjusted to be near −10 kcal/mol. Some genes were engineered in the head but not the tail, or vice versa, to evaluate our inferences concerning their relative contributions.
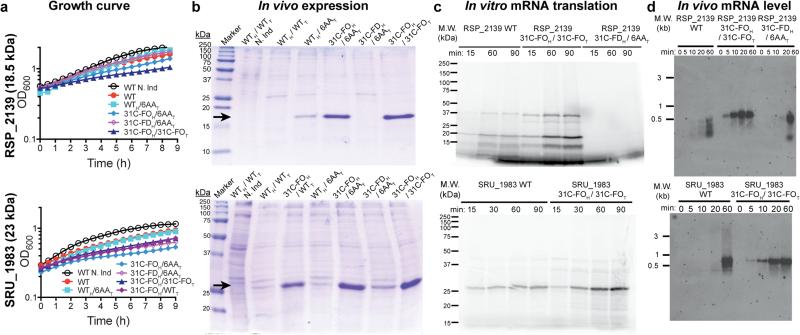
Figure 5. Analyses of synthetic genes designed to enhance protein expression.
Synonymous variants of inefficiently translated native (WT) genes were redesigned in the head or tail or both using the 6AA, 31C folding optimized (31C-FO), or 31C folding deoptimized (31C-FD) methods. The type of sequence in the head (subscript H) and tail (subscript T) is indicated separately. “N. Ind.” indicates non-induced control. (a) Growth curves at room temperature after induction at time zero in E. coli BL21(DE3). (b) Coomasie Blue stained SDS-PAGE gels of cells induced overnight at 18° C, with loads normalized to final OD600. Black arrows indicate the target proteins. (c) Autoradiographs of SDS-PAGE gels of in vitro translation reactions in the presence of [35S]-methionine using fully purified components to translate an equal amount of purified mRNA transcribed in vitro by T7 RNA polymerase. Higher molecular weight bands represent SDS-resistant oligomers. (d) Northern blots of equal amounts of total RNA isolated at the indicated times after induction, hybridized with a probe matching the 5’UTR.
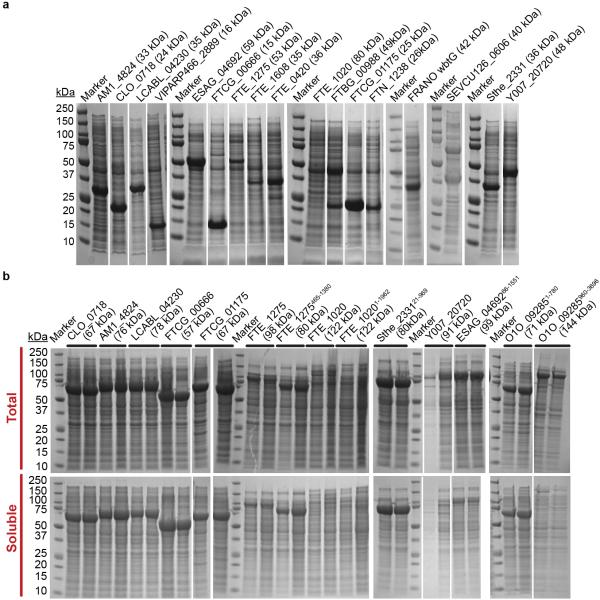
We synthesized 31C-FO genes for five proteins (Fig. 5 and Extended Data Fig. 6), including one from E. coli, that were poorly expressed using their native genes, and for 17 previously uncharacterized proteins (Extended Data Fig. 7a). These codon-optimized genes give uniformly high expression (scores of 4-5 for 18/19 proteins <450 amino acids in length). Equivalent improvements were observed for three native/31C-FO pairs transcribed at physiological levels from pBAD vectors by E. coli RNA polymerase (Extended Data Fig. 6e-f). While some 31C-FO genes yield insoluble proteins using our standard expression protocol, they uniformly yield high levels of soluble protein when fused to the C-terminus of E. coli maltose-binding protein (Extended Data Fig. 7b), a solubility-enhancing tag.
We retained native head sequences and optimized exclusively the tails of four genes using the 6AA method (WTH/6AAT in Fig. 5b and Extended Data Fig. 6), which consistently increased expression albeit to a varying extent. We also tested the relative influence of codon usage vs. mRNA folding in the head by constructing genes with identical tails but different codon-optimized 31C heads with folding energies either optimized (31C-FOH with ΔGUH maximized) or deoptimized (31C-FDH with ΔGUH minimized). These results (Fig. 5b), described in the Supplementary Information, demonstrate folding and codon usage in the head and codon usage in the tail all influence expression, consistent with our computational inferences (Fig. 4).
Biochemical analyses of optimized synthetic genes
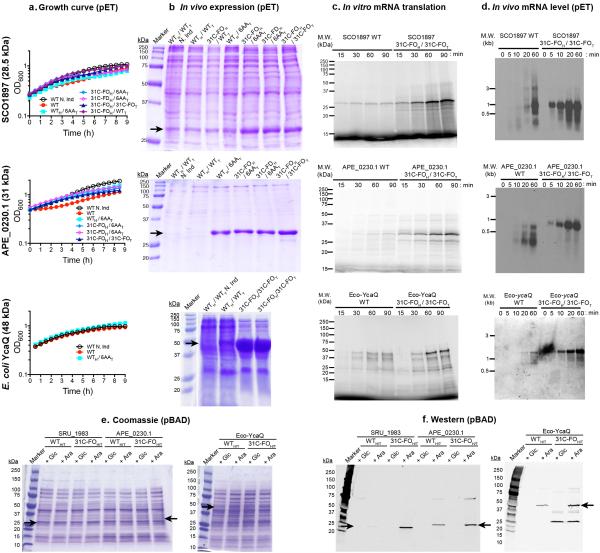
We compared cellular growth-rates (Fig. 5a and Extended Data Fig. 6a), protein expression (Fig. 5b and Extended Data Fig. 6b), and mRNA levels (Fig. 5b and Extended Data Fig. 6d) after induction of native vs. optimized genes in vivo in E. coli. We also compared in vitro transcription (Extended Data Fig. 8) and translation (Fig. 5c and Extended Data Fig. 6c) reactions. Inhibition of growth upon induction of the APE_0230.1 protein is eliminated by codon optimization even though expression increases greatly (Extended Data Fig. 6a-b), suggesting inefficient translation can cause toxicity. Native vs. optimized genes are transcribed in vitro by T7 RNA polymerase with equivalent rates and yields (Extended Data Fig. 8). However, in vitro translation of the resulting mRNAs yields more protein from the optimized sequences (Fig. 5c), and translational pausing sites are different for some synonymous pairs (e.g., APE_0230.1). Therefore, translation efficiency is improved by the codon-optimization methods derived from our computational analyses
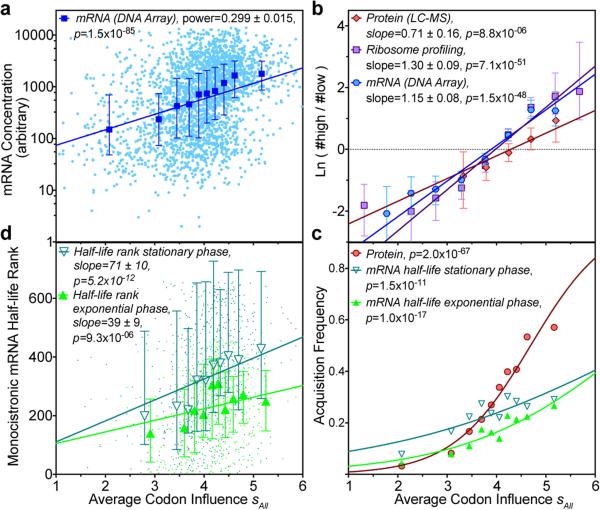
We observe lower mRNA levels in vivo after induction of the inefficiently translated native versus optimized genes (Fig. 5d and Extended Data Fig. 6d), suggesting that translational obstacles reduce the steady-state mRNA level. Notably, 5 min after induction, full-length mRNA is detected for all of the optimized genes, but none of the native genes. Because T7 polymerase transcribes them equivalently in vitro (Extended Data Fig. 8), these results suggest the inefficiently translated native mRNAs are rapidly degraded. We evaluated the physiological relevance of this inference by calculating sAll, the average codon slope from multi-parameter logistic-regression modeling (colored symbols in Fig. 3a), for all E. coli genes. Supporting the validity of our new codon-influence metric, this parameter derived from our expression dataset correlates strongly with in vivo protein concentrations measured using mass spectrometry43 (Fig. 6b) and with the probability of detecting a protein using this technique (Fig. 6c), which increases with concentration. Strikingly, sAll correlates as strongly with in vivo mRNA levels for all predicted cytoplasmic proteins (Fig. 6a-b), suggesting codon content influences steady-state mRNA concentration. Finally, sAll calculated in the proper reading frame is strongly positively correlated with the lifetimes of monocistronic mRNAs in E. coli44 (Fig. 6d), consistent with our inference that mRNAs encoded by better codons tend to be degraded more slowly. Acquisition of an mRNA lifetime, which is biased towards higher steady-state concentration and longer lifetime, also depends strongly on sAll (Fig. 6c). These global correlations suggest codon content exerts an important influence on not only translation efficiency but also mRNA stability.
Figure 6. Codon influence on protein expression correlates with endogenous E. coli protein levels and mRNA levels and lifetimes.
(a) Logarithm of mRNA level of predicted cytoplasmic proteins plotted vs. sAll, the average of our codon-influence metric (colored symbols in Fig. 3a). Cyan dots show individual genes in a microarray analysis. Blue symbols/bars show the corresponding decile plot (i.e., median/25th-75th percentiles in bins with equal population). P-value is from linear regression. (b) Log-odds plot of predicted cytoplasmic genes/proteins in top vs. bottom 30% of the population in genome-scale in vivo profiles of exponentially growing cells in defined medium. Cyan, red, and magenta represent data from, respectively, the microarray data (panel a, n = 2,817), a mass spectrometric analysis of protein concentration43 (n = 825), and a deep-sequencing analysis of ribosome distribution on mRNAs10 (n = 2,597). Bins contain equal numbers of genes/proteins in each dataset. Error bars show 95% bootstrapping confidence limits. P-values are from binary logistic regression. (c) Decile plot showing fraction of all predicted cytosolic genes/proteins acquired in the mass spectrometric analysis of protein concentration43 (red) and in deep-sequencing analyses of mRNA lifetimes44 in exponential (green) or early stationary (teal) phase in LB. P-values are from binary logistic regressions. (d) Decile plot showing rank-order of mRNA lifetimes44 as a function of sAll in the proper reading frame. P-values are from Spearman correlation analysis; equivalent analyses in frames +1/+2 give p-values of 0.9/0.007 and 0.6/0.4 for exponential and stationary phases, respectively.
Discussion
We used simultaneous multi-parameter computational modeling of results from 6,348 independent protein-expression experiments to dissect the mRNA sequence features controlling protein expression in E. coli (Figs. 1-4), and we verified these computational inferences using biochemical methods (Fig. 5). The average value (sAll) of the resulting codon-influence metric correlates strongly with endogenous in vivo protein concentrations (Fig. 6b-c) as well as mRNA concentrations (Fig. 6a-c) and lifetimes (Fig. 6d) in E. coli. These global correlations could derive in part from parallel evolutionary selection for efficient transcription and translation and high mRNA stability. However, in vivo and in vitro biochemical studies we conducted on synthetic codon-optimized genes support the hypothesis that codon content directly modulates both translation efficiency (Fig. 5c and Extended Data Fig. 6c) and mRNA stability in E. coli (Fig. 5d and Extended Data Figs. 6d and 8) and that these parameters are tightly coupled45, as previously shown for some individual genes2,36,46,47. Recent reports suggest similar coupling in yeast29,30. Several molecular mechanisms could explain this coupling27,36,37,47-50, as outlined in the Supplementary Information. Modulation of mRNA stability by codon usage would enable it to influence protein expression without altering net protein-elongation rate10,11. However, our in vitro translation assays (Fig. 5c and Extended Data Fig. 6c) suggest that codon content also directly affects translation efficiency.
Our new codon-influence metric (Fig. 3a) has significant differences compared to previous inferences. Amino-acid identity influences protein expression efficiency, but14,19,21 genomic codon-usage frequency14,19,21 is not broadly correlated with it (Figs. 3c and Extended Data Fig. 4d). Although the 3rd, 4th, and 5th least frequent E. coli codons have the most deleterious influence on expression in our dataset, they attenuate it to widely varying extents, and slightly more frequent codons have a neutral or expression-enhancing influence (Figs. 3c and Extended Data Fig. 4d). Codon-usage frequency correlates with the concentration of the cognate tRNA18-20,23, which can influence protein-elongation rate in vitro9,18,21,26 and protein yield in vivo1,2,27. Indeed, the ArgU tRNA was overexpressed in our experiments to promote higher expression of proteins enriched in AGA/AGG codons1,27, which may bias the influence of these codons in our dataset (Fig. 3a). Further research will be required to understand the factors determining when tRNA concentration influences translation efficiency. Nonetheless, our analyses suggest ribosomal elongation dynamics29,35 generally exert a stronger influence on protein expression than tRNA concentration. Therefore, translational regulatory effects could operate via modification of ribosomal elongation dynamics, mediated for example by covalent modification of tRNAs or the ribosome20. Complicating related studies2,36,45,46, our results also suggest such regulatory effects could be manifested via alterations in mRNA levels due to intimate coupling between mRNA stability and translation efficiency.
METHODS
Proteins in the large-scale expression dataset
The dataset analyzed in this paper was culled from that described in our previous paper analyzing correlations between amino acid sequence and protein expression/solubility levels39. In brief, proteins were selected from a wide variety of source organisms based on structural uniqueness, meaning that no sequence with greater than 30% amino acid identity had an experimentally determined structure deposited into the Protein Data Bank at the time of selection. We restricted the dataset used in this earlier paper to non-redundant proteins encoded by genes that do not contain any codons affected by an alternative translation table in the source organism and that were expressed with a C-terminal LEHHHHHH tag. Homologous sequences were culled by an iterative procedure that reduced the level of amino acid sequence identity between any pair to less than 60%, which results in a lower level of nucleic acid sequence identity. At each step, all pairs of proteins sharing at least 60% identical amino acid sequence identity were transitively grouped together into a set, and the shortest sequence was eliminated from each set before reinitiating the same set-assignment procedure on all remaining proteins. The resulting dataset included 6,348 genes from 171 organisms, as detailed in the cladogram in Extended Data Fig. 1 and Supplementary Data File Boel2015NESG6348ProteinDataset.csv. It contained 95 endogenous E. coli genes, including ycaQ that was examined in our follow-up biochemical experiments (Extended Data Fig. 6), and 6,253 genes from heterologous sources, including 47 from mammals, 809 from archaeabacteria, and the remainder from 151 different eubacterial organisms.
Scoring of protein expression in the large-scale dataset
The methods for the large-scale protein expression experiments were described in detail in previous papers38,57,58 and are similar to those described below for evaluation of protein expression in vivo except that induction was performed in 0.5 ml cultures in 96 well plates. In brief, native genes for the 6,348 proteins were cloned with a C-terminal LEHHHHHH affinity tag under the control of the bacteriophage T7 promoter in pET21, a 5.4 kb pBR322-derived plasmid harboring an ampicillin resistance marker38. Protein expression38 was induced overnight at 18 °C in E. coli strain BL21(DE3) growing in chemically defined medium containing glucose as a carbon source. The expression strain also contained pMGK, a 5.4 kb pACYC177-derived plasmid that harbors a kanamycin resistant gene, a single copy of the lacI gene, and a single copy of the argU gene encoding the tRNA cognate to the rare AGA codon for arg (GenBank accession number KT203761). As previously described, we scored protein expression level from two transformants of the same plasmid on an integer scale from 0 (no expression) to 5 (highest expression), based on visual inspection of whole cell lysates on Coomassie-blue-stained SDS-PAGE gels. There is an unmistakable difference between the 0 and 5 expression scores used for most of the analyses reported in this paper. A score of 5 indicates the target protein was the most abundant protein expressed in the cell, while a score of 0 indicates it was undetectable against the background of cellular proteins. Moreover, the reproducibility of the integer scores in our large-scale dataset was excellent, as analyzed in detail in a previously published paper39. There was no difference between all measurements for over 70% of the genes and a maximum difference of one unit between all measurements for over 80% of the genes. When replicates gave different scores, the maximum score was used, because most sources of experimental error tend to reduce expression score, and bell-weather analyses reported in our previously published paper39 showed a small increase in the significance of correlations when using maximum rather than mean score.
Computational modeling
Our binary multi-parameter logistic regression model gives θ, the logarithm of the ratio of the probabilities of obtaining the highest level of protein expression (pE5) vs. none (pE0) from an mRNA sequence in the large-scale dataset, as a linear function of generalized variables xi:
| (1) |
The probability of obtaining the highest level (E = 5) vs. no (E = 0) protein expression from a given sequence is therefore given by:
| (2) |
Note that, to capture non-linear relationships between mRNA sequence parameters and outcome, the generalized variables xi can represent mathematical functions of mRNA sequence parameters as well as those parameters themselves. We used the R statistics program55 to compute the most probable values of the model parameters (A,βi). Logistic-regression slopes βi > 0 indicate that the probability of expression increases as the associated variable increases in numerical value. (Note that, because ΔG increases in numerical value as folding stability decreases, a positive slope for free-energy terms indicates an increase in the probability of high expression as predicted folding stability decreases, while a negative slope for these terms indicates an increase in the probability of high expression as predicted folding stability increases.) Our final model, which we call Model M (Extended Data Table 1a and Fig. 4), is given in the main text, and the codon slopes βc from this model are depicted in Fig. 3a. In principle, the probability of high protein expression can be increased by manipulating mRNA sequence properties to maximize the value of θ and thus π in the equations above using the parameters (A,βi) from Model M.
Inclusion of parameters was guided by the Likelihood Ratio test in conjunction with the Akaike Information Criterion54 (AIC), a standard measure of whether an improvement in model quality exceeds that expected at random from increasing the number of degrees of freedom in the model. The Likelihood Ratio χ2 (LR χ2) is asymptotic to the χ2 distribution and defined as the reduction in the deviance D of the observed data from the predictions of the model compared to the null model containing just the constant term A (as defined above), while the AIC is given by the LR χ2 minus 2 times the number of degrees of freedom. The deviance is defined as:
| (3) |
This sum is conducted over the n = 3,727 proteins giving expression scores of 5 or 0 among the 6,348 in the large-scale protein expression dataset, and the logistic variable Ej assumes values of 1 or 0 if protein j is expressed at the E = 5 or E = 0 levels, respectively. The variable πj = π(θj) gives the predicted probability of obtaining expression of protein j at the E = 5 rather than E = 0 level according to the equations given above describing the multi-parameter binary logistic model. For the dataset analyzed in this paper, the deviance has values of 5,154 and 3,952 for the null model and our final Model M, respectively (Extended Data Table 1a). In addition to using the AIC, we ensured that the final model is not over-fit via bootstrapping with replacement 1,000 times using the RMS package56. This validation procedure is considered more robust than splitting the dataset into training and test sets, which requires very careful selection of the test set.
The sequence parameters explored in the course of model development (Extended Data Table 1 and additional data not shown) included the length of the gene, the individual codon frequencies in-frame or out-of-frame in the entire gene, the individual codon frequencies in-frame separately in the head and the tail or in the first and second halves of the coding sequence, di-codon frequencies, the statistical entropy of the codon sequence, the codon and amino acid repetition rates (defined below), the frequencies of the nucleotide bases at each codon position in the entire gene and in defined windows within its sequence, and a variety of predicted mRNA folding-energy parameters including those shown in Fig. 1 and Extended Data Fig. 2, which were evaluated individually and as statistical aggregates. The codon repetition rate rcodon and amino acid repetition rate r are defined as , where di is the distance at every position in the sequence to the next occurrence of the same species moving towards the 3’ end of the gene. The value of is set to zero if the codon or amino acid does not occur again, so the value of r for the protein sequence LRPRL is the average of (1/4, 1/2, 0, 0, 0), which is 0.15. The sequence of the C-terminal LEHHHHHH affinity tag was omitted from all computational analyses to avoid biasing statistics on its constituent amino acids and codons. Because this sequence is present in every gene included in our large-scale protein expression dataset, it cannot directly influence outcome on its own and can only have an influence via differential interaction with other sequence features. No evidence of such interactions was detected in bell-weather analyses including the tag sequence, so it was omitted in the final analyses reported in this paper.
The number of degrees of freedom for codon variables is one fewer than the number of non-stop codons because their frequencies fc in a sequence must sum to 1 (i.e., Σ fc = 1). Therefore, for the analyses shown in Figs. 3-4, we removed ATG, effectively constraining its slope to be zero (i.e., βATG = 0) and its contribution to the model to be absorbed into the constant A. The inclusion of mean codon-slope variables s7-16 and s17-32 in Model M uniformly reduces the individual codon slopes to βc to ~86% of their values when no mean-slope terms are included in the model, reflecting the disproportionate influence of codons near the 5’ terminus compared to those in the rest of the gene (Extended Data Fig. 6). We tested expanded codons models including the next base or the previous base in addition to the in-frame codon, but these were rejected based on the AIC and bootstrap validation criteria described above.
We also examined introducing additional variables into Model M (Extended Data Table 1b and additional data not shown). Adding the mean value of the predicted free energy of mRNA folding in the tail does not significantly improve the model, even though unstable folding in the tail correlates with reduced protein expression (Fig. 1g-h). This correlation as well as those of the overall A, T, G, and C content in the gene (Extended Data Fig. 2a-e) must be captured more effectively by the cross-correlated sequence parameters (Extended Data Figs. 3-4) that are included in the model, suggesting that these other parameters are more influential mechanistically. Adding the mean slope of codons 2-6 does not produce a statistically significant improvement, and using this term instead of the base-composition terms in this region yields inferior results, consistent with the analyses shown in Extended Data Fig. 5. Finally, adding the frequency of the Shine-Dalgarno consensus AGGA in any frame (fAGGA in Extended Data Fig. 2i-j) fails to produce a statistically significant improvement. We also used the Bindigo program (http://rna.williams.edu/) to compute the binding energy of all hexamer sequences in a gene with anti-Shine-Dalgarno sequence CACCUCCU, and neither the minimum nor the average value of the predicted free energy of hybridization to the anti-Shine-Dalgarno sequence has any correlation with protein expression level our large-scale dataset.
Design of synonymous mRNA sequences
In the 6AA method, codons for six amino acids were changed to the single codon specified in Extended Data Table 2, which has a larger slope than that of any synonymous codon in our single-parameter binary logistic regression analyses (dark gray symbols in Fig. 3a). Although no explicit free energy optimization was performed with the 6AA method, it produced genes in which the predicted free energies of mRNA folding were more favorable than those in the naturally occurring starting sequences. In the 31C-FO method, predicted mRNA folding energy was optimized while selecting codons from the 31 listed in Extended Data Table 2, which have slopes greater than zero in our single-parameter binary logistic regression analyses (dark gray symbols in Fig. 3a). The predicted free energy of folding of the head plus 5’ UTR (ΔGUH) was maximized numerically (i.e., to yield the least stable folding), while the predicted free energy of the folding in the tail was optimized to be near −10 kcal/mol in windows of 48 nucleotides. The 31C-FD used the same set of codons to produce genes in which the predicted free energy of folding was minimized numerically (i.e., to yield the most stable folding).
Bacterial strains and growth media
The E. coli strain DH5α was used for cloning. Expression experiments used E. coli strain BL21(DE3) pMGK38. Bacteria were cultivated in LB medium (Affymetrix/USB). Ampicillin was added at 100 μg/ml for cultures harboring pET21-based plasmids. Kanamycin was added at 25 μg/ml to maintain the pMGK plasmid. Bacterial growth for protein expression and Northern blot experiments were done in the same media and conditions that were use to generate the high-through protein-expression dataset38 (i.e., MJ9 minimum medium59 with 250 rpm agitation at 37 °C prior to induction at 17 °C).
Plasmids
The pET-21 clones of the genes APE_0230.1 (Aeropyrum pernix K1), RSP_2139 from (Rhodobacter sphaeroides), SRU_1983 (Salinibacter ruber), SCO1897 (Streptomyces coelicolor) and ycaQ (E. coli) were obtained from the protein-production laboratory of the Northeast Structural Genomics Consortium (www.NESG.org) at Rutgers University (NESG targets Xr92, RhR13, SrR141, RR162, and ER449, respectively). The 6AAT and 31C-FOH/31C-FOT variant of the genes were DNA synthetized by GenScript. The head variants 31C-FOH and 31C-FOH were generated by PCR amplification using long forward primers comprising an NcoI restriction site, the new head sequence, and a sequence complementary to the downstream region in the target gene. A plasmid containing the starting construct was used as DNA template for the PCR with the corresponding long forward primers and a reverse primer hybridizing at the 3’ end of the construct including the XhoI restriction site. The resulting PCR products were cloned using the In-Fusion kit (Clontech) into a pET-21 derivative linearized with NcoI and XhoI. The full protein-coding sequence in every plasmid was verified by DNA sequencing (Genewiz and Eton Bioscience) and corrected when necessary using the QuikChange II Site-Directed Mutagenesis kit (Agilent Technologies). The WT and 31C-FOH/31C-FOT (31C-FOH/T) genes for SRU_1983, APE_0230.1 and E. coli YcaQ were re-cloned into a pBAD expression plasmid (Life Technologies, Carlsbad, CA) with a C-terminal hexahistidine tag for transcription by the native E. coli RNA polymerase under control of an arabinose-inducible promoter; these experiments yielded similar results (Extended Data Fig 6e-f) to those shown for the same genes under T7 polymerase control in a pET plasmid in Fig. 5 and Extended Data Fig. 7a. DNA sequences of the final constructs are provided in the Supplementary Data File Boel2015OptimizedGenesModelM.xlsx.
E. coli growth curves
Overnight cell growth was measured by transferring 200 μl of each induced culture to a 96-well sterile plate (Greiner bio-one) and covered with 50 μl of sterile paraffin oil. A negative control non-induced sample was loaded for each target WT. Duplicates of each sample were loaded to allot for any natural or human variation. Plates were placed into a platereader (Biotek Synergy) at room temperature, and shaken for 30 seconds. A start OD600 reading was taken and then followed by 30 minutes of shaking until the next OD reading. Readings were repeated for a total of 9 hours of growth analysis.
Analysis of protein expression in vivo from IPTG-inducible pET vectors
Starting cultures from a single colony were inoculated into 6 ml of LB media containing 100 μg/ml of Ampicillin and 30 μg/ml Kanamycin. Cultures were grown at 37°C until highly turbid (4-6 hours). 40 μl of the turbid media was used to inoculate 2 ml of MJ9 chemically defined medium59. This MJ9 preculture was grown overnight at 37 °C. The following day, OD600 readings were taken of a 1:10 dilution of the turbid MJ9 preculture. This reading was used to calculate the volume of preculture necessary to normalize all cell samples to a starting culture reading of 0.1 in 6 ml of media. This calculated volume was inoculated into 6 ml of fresh MJ9 media and cells were grown at 37 °C until OD600 reached 0.5-0.7. Cells were then induced with 1mM IPTG, with one duplicate tube for each target WT left non-induced to act as a negative control. After induction, 200 μl × 2 of each culture was removed and placed into a sterile 96 well plate for growth curve monitoring (see above). The remaining 5.6 ml of induced samples were then transferred to 17 °C and shaken overnight. The following day, samples were removed from the shaker, placed on ice, and final OD600 was measured. Cells were centrifuged in 14 ml round-bottom Falcon tubes at 4,000 rpm for 10 minutes, and the pellet was resuspended in 1.2 ml of Lysis Buffer (30 mM NaCl, 10 mM 2-mercaptoethanol, 50 mM NaH2PO4 , pH 8.0) and then transferred to 1.5 ml Eppendorf tubes on ice. Lysis was accomplished by sonication on ice, using a 40 V setting (~12 Watt pulse) and pulsing 1 sec followed by a 2 sec rest, for a total of 40 pulses. 120 μl of each lysed sample was mixed with 40 μl of 4X Laemmli Buffer. Samples were then run on SDS-PAGE (Bio-Rad, Ready Gel, 15% Tris-HCl), with Bio-Rad Precision Plus All Blue Standard markers. Final OD600 measurements were used to calculate the load volume for each individual sample, normalizing all samples to the density of the least turbid of each unique target. We verified the integrity of the plasmids after growth and induction by DNA sequencing (Genewiz and Eton Bioscience). Each results were confirmed by repeating the experiment.
Analysis of protein expression in vivo from arabinose-inducible pBAD vectors
Conducting experiments at physiological protein expression levels (Extended Data Fig. 6e, f) required considerable changes in methods compared to the experiments conducted in pET vectors that were used to generate our large-scale protein- expression data set and the data shown in Fig. 5 and Extended Data Figs 6a, b and 7. Because mRNA expression from IPTG-controlled promoters tends to occur in an all-or-none fashion [Ref 51=Novik,52=Jensen], it is not practical to control the level of mRNA expressed from pET vectors. Therefore, we re-cloned three pairs of synonymous native and codon-optimized 31C-FOH/T genes with C-terminal hexahistidine tags under control of the arabinose-inducible promoter in a pBAD vector [Ref 53=Guzman], which provides a more gradual increase in expression as arabinose concentration is raised. This promoter drives transcription using the endogenous E. coli RNA polymerase rather than T7 RNA polymerase, which is employed by the pET vectors used for all other expression experiments reported in this paper. Because transcription from the arabinose promoter is repressed by glucose, which is the carbon source in the chemically defined MJ9 medium used for our pET experiments, we instead used LB as the growth medium for pBAD experiments, which were conducting in BL21 pMGK cells (that is, an isogenic E. coli strain except for the removal of the λ (DE3) prophage carrying the gene for T7 RNA polymerase). Furthermore, because the arabinose inducer can be depleted during long growth periods, we evaluated expression after relatively short 1–4 h induction times during log-phase growth rather than after overnight growth into stationary phase, which was used for our pET experiments. We also changed the growth temperature during induction from 17 °C for pET experiments to 37 °C for pBAD experiments. Non-induced controls were grown in medium containing 0.4% glucose (+Glc). When the A600 nm of the cultures reached 0.6, transcription of the target genes was induced for 1 h using final arabinose concentrations of 0.001% (w/v) for APE_0230.1 and 0.01% (w/v) for SRU_1983 and E. coli YcaQ (+Ara).
In vitro transcription
The pET21 plasmids containing the optimized or unoptimized insert were digested with BlpI, phenol-chloroform purified and concentrated by ethanol precipitation. Of the digested samples, 2 μg were added to the RiboMax kit (Promega) preparation, and in vitro transcription with bacteriophage T7 RNA polymerase was conducted according to the manufacturer's protocol. Upon completion of the reaction, samples were treated with DNAse (Promega), isopropanol precipitated, and resuspended in RNA Storage Solution (Ambion). Transcript size and purity were verified by agarose gel electrophoresis with ethidium bromide staining. For kinetic analyses, 20 μl reactions with T7 polymerase were assembled and started by addition of 1 μg of template DNA. A 4.5 μl sample of each reaction was removed at 0, 5, 10, and 30 minute time points for analysis on denaturing formaldehyde-agarose gels. Each experiment was repeated at least twice.
In vitro translation
In vitro translation assays of the purified mRNAs were performed with the PURExpress system (New England Biolabs) using L-[35S]methionine premium (PerkinElmer). Each 25 μl reaction contained 10 μl of solution A, 7.5 μl of solution B and 2 μl of [35S]methionine (10 μCi). The reactions were started by adding 2 μl of purified mRNA (4 μg/μl) and incubating at 37 °C. Aliquot of 5 μl were withheld from the reaction at 15, 30, 60 and 90 min, stopped by adding 10 μl of 2X Laemmli and heating for 2 min at 60 °C. Then 14 μl of each aliquot were run on a 4-20 % SDS-PAGE (Bio-Rad) with Bio-Rad Precision Plus All Blue Standard markers. The gel was dried on Whatman as well as subjected to autoradiography. Each reaction was repeated at least twice.
Northern blot analyses
Northern blotting probe was designed as the reverse complement of the 71nt of the 5’ UTR of the pET21 vector, and synthesized by Eurofins. The probe was labeled with biotin using the BrightStar Psoralen-Biotin Nonisotopic Labeling Kit. BL21(DE3) pMGK E. coli containing the plasmid of interest was grown overnight in LB at 37 °C with shaking. Cultures were diluted 1:50 into MJ9 media and grown overnight at 37 °C with shaking. Following day, the cultures were diluted to an OD600 of 0.15 into MJ9 media and allowed to grow to an OD600 of 0.6-0.7 prior to induction with 1 mM IPTG. Samples were taken at the indicated time points and RNAs were stabilized in 2 volumes of RNAProtect Bacteria Reagent. After pelleting, samples were lysozyme digested (15 mg/ml) for 15 minutes and RNAs were purified using the Direct-zol RNA Miniprep Kit and TRI-Reagent. Approximately 1-2 μg of total RNA per sample was separated on a 1.2% formaldahyde-agarose gel in MOPS-formaldahyde buffer. RNA integrity was verified by ethidium bromide staining. RNA was then transferred to a positively charged nylon membrane using downward capillary transfer with an alkaline transfer buffer (1 M NaCl, 10 mM NaOH, pH 9) for 2 h at room temperature. RNAs were crosslinked to the membrane using 1200 μJ UV (Stratalinker). Membranes were pre-hybridized in Ultrahyb hybridization buffer for 1h at 42°C in a hybridization oven. Heat-denatured, biotin-labeled probe was then added to 10-20 pM final concentration and hybridized overnight at 42°C. Membranes were washed twice in wash buffer (0.2X SSC, 0.5% SDS) and probe signal was detected using the BrightStar BioDetect kit, as per protocol, with exposure to film. Each Northern blot experiment was repeated at least twice.
RNA extraction and microarray analyses
E. coli MG1655 cells were cultured in M9 0.4 % glucose minimum media to a final OD600 of 1.0. Cells were treated with RNA Protect Bacteria Reagent (Qiagen), and RNA extracted using the RNeasy Mini Kit (Qiagen) was reverse transcribed using SuperScript II Reverse Transcriptase (Invitrogen) followed by treatment with RNaseH (Invitrogen) and RNaseA (EpiCentre). The resulting cDNA preparation was purified using the MinElute Purification Kit (Qiagen) and then fragmented into 50-200 bp fragments using DNaseI (EpiCentre). Biotinylation was performed with Terminal Deoxynucleotidyl Transferase (New England Biolabs) and Biotin-N6-ddATP (Enzo Life Sciences). Biotinylated cDNA was hybridized on Affymetrix E. coli 2.0 arrays by the Gene Expression Center at the University of Wisconsin Biotechnology Center. Raw data (.cel) files were analyzed using the RMA (Robust Multi-chip Average) algorithm in the Affymetrix Expression Console. The array data has been deposited in the GEO database with accession number: GSE73416
Classification of cytoplasmic proteins in E. coli MG1655
All predicted proteins in the version of the genome in the Ecocyc database60 were analyzed using the programs LipoP61 and TMHMM62, and those without a predicted transmembrane helix or a predicted signal peptide were classified as cytoplasmic proteins and included in the analyses in Fig. 6.
Analysis of mRNA lifetime datasets
We analyzed the datasets recently published by Chen et al.44 in which RNAseq was used to quantify global mRNA levels as a function of time following treatment of either exponential or early stationary phase cultures with the transcription-initiation inhibitor rifampicin. To avoid potential complications arising from the encoding of multiple proteins in polycistronic transcripts, we limited our analyses to monocistronic transcripts, which constituted 76% and 82% of the mRNAs for lifetimes were measured in exponential and stationary phase, respectively. The analyses presented in Fig. 6c-d were also limited to predicted cytoplasmic proteins to avoid possible biases from systematically lower expression of integral membrane proteins and secreted proteins. The set of genes for which Chen et al.44 were able to measure lifetime is strongly biased towards more abundant mRNAs, and the measured lifetimes in both the exponential and stationary phase datasets are also strongly correlated with steady-state concentrations (data not shown).
Extended Data
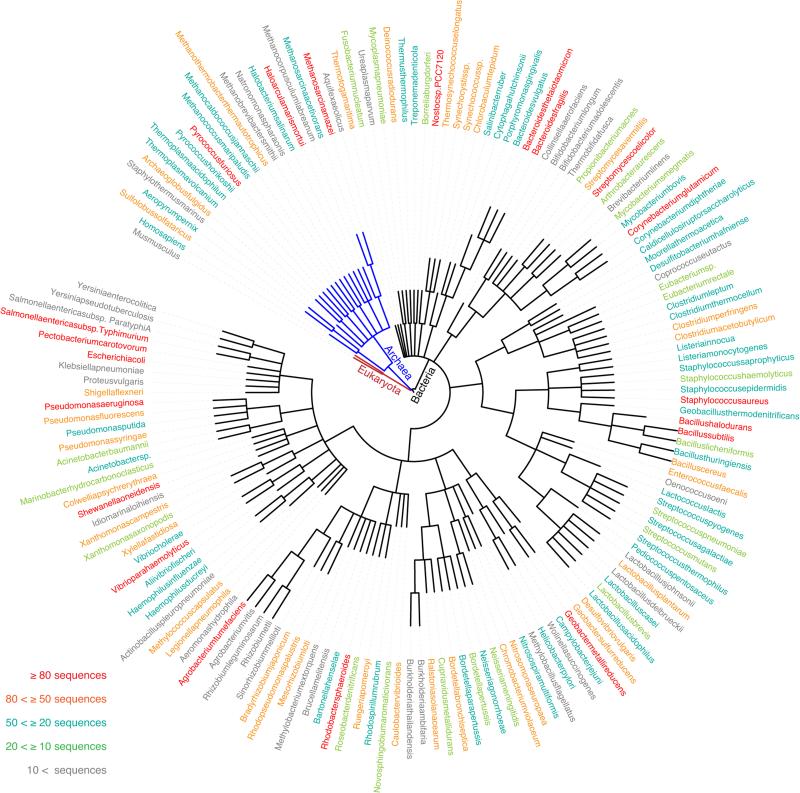
Extended Data Figure 1. Phylogenic distribution of the proteins in the large-scale protein expression data set.
The colors in the cladogram encode the number of proteins from each organism, as indicated by the legend. The data set includes 47 from eukaryotes (45 from humans and 2 from mouse), 809 from archaebacteria, and 96 from E. coli, with the remainder coming from other eubacteria. The organism contributing the largest number of proteins to the data set is the eubacterium Bacteroides thetaiotaomicron (150 proteins).
Extended Data Figure 2. Relationships between additional mRNA sequence parameters and results in the large-scale protein expression data set.
a, i, k, Histograms showing for each expression score the distribution of the overall G+C frequency (a), the frequency in all reading frames of the AGGA core sequence of the Shine–Dalgarno ribosome-binding sequence (i), and the amino acid repetition rate r (k; see Methods for definition). The parameter distributions in the E = 5 and E = 0 categories (n = 3,727) are shown in a in dark and light blue, respectively, and in i and k in red and black, respectively. The symbols used for the histograms for the intermediate expression scores (n = 2,621) are indicated in the legend for each panel. b–h, j, l–o, Plots showing the logarithm of the ratio of the number of proteins with E = 5 versus E = 0 scores as a function of parameter value. b, Data for the overall frequencies of the four individual nucleotide bases as well as the combined G+C frequency (labeled GC). c–e, The equivalent data separately for the first (c), second (d) and third (e) positions in the codons in the genes. f, Data for genes either not containing or containing at least one occurrence of the ATA–ATA di-codon (P = 2 × 10⁻³²). The error bars in this panel represent 95% confidence limits calculated from bootstrapping; the error bars for the genes without any occurrence of this di-codon are smaller than the size of the symbol. g, h, Data for the codon adaptation index14 (g) and tRNA adaptation index16 (h). j, Data for the frequency in all reading frames of the sequence AGGA. l, m, Data for the amino acid repetition rate r (l) and the codon repetition rate (m). n, o, Data for the statistical entropy of the amino acid (n) and codon sequences (o). The data in a–e, i and k are binned in equal ranges of the parameter value, while the data in g, h, j and l–o are binned in deciles containing equal populations.
Extended Data Figure 3. Correlations between sequence parameters in the genes included in the large-scale protein expression data set.
a–c, Corrgrams representing the signed Pearson correlations coefficients between different mRNA sequence parameters in the genes in the E = 0 and E = 5 categories in the data set (n = 3,727). The color-coding is defined schematically on the left in a, with blue being used for positively correlated variables, red for negatively correlated variables, and white for uncorrelated variables. In a, E represents the expression score in the binary categories (0, 5), sAll represents the mean value of our new codon-influence metric (colored symbols in Fig. 3a) over the entire gene (without the LEHHHHH tag), s7–16 and s17–32 represent the mean values of this metric for codons 7–16 and 17–32, respectively, ΔGUH represents the predicted free energy of mRNA folding for the 5′-UTR from the pET21 expression vector plus the first 48 nucleotides in the gene, <ΔGT>96 represents the mean value in the remainder of the gene of the predicted free energy of folding in 50% overlapping windows of 96 nucleotides, I represents an indicator variable that assumes a value of 0 or 1 if (ΔGUH < −39 kcal mol−1) and (%GC2–6 > 0.65), dAUA assumes a value of 0 or 1 if there is at least one occurrence of the ATA–ATA di-codon, r represents the codon repetition rate (see Methods), and %GC represents the percentage content of G plus C bases in the gene. The variables aH, aH2, gH2 and u3H represent monomial functions of the fractional content of A, G and U bases in codons 2–6; the correlation coefficient for these nucleotide-composition terms was calculated using their sum weighted by their optimized coefficients from model M (Fig. 4 and Extended Data Table 1a), as given in the equation in the main text. b, Data for the frequencies of the codons positively correlated with E. c, Data for the frequencies of the codons positively correlated with E. d–g, Two-dimensional histograms illustrating the dependence of results in the large-scale protein-expression data set on pairs of sequence parameters. The colors encode the fractional excess of proteins with E = 5 versus E = 0 scores (that is, (#E5 − #E0)/(#E5 + #E0)), as calibrated by the scale bar on the right. The area of each square is proportional to the number of proteins in that bin in the two-dimensional parameter space. The variables sAll, s7–16 and stail represent, respectively, the mean values of our new codon-influence metric for the entire gene, for codons 7–16, and for all of the remaining codons downstream in the gene. ΔGUH represents the predicted free energy of mRNA folding for the 5′-UTR from the pET21 expression vector plus the first 48 nucleotides in the gene, <ΔGT>96 represents the mean value in the remainder of the gene of the predicted free energy of folding in 50% overlapping windows of 96 nucleotides, and r represents the amino acid repetition rate (as defined in Methods).
Extended Data Figure 4. Relationship of the new codon-influence metric to parameters assumed to influence translation efficiency in previous literature.
a, Average frequency of each non-stop codon in the genes in just the E = 0 and E = 5 categories (dark grey) or in the E = 0 to E = 5 categories (light grey), with error bars representing the s.d. of the frequency among the genes in each set. b, Codon slopes from single-variable binary logistic regressions (dark grey symbols in Fig. 3a) segregated according to the identity of the nucleotide at each of the three positions in the codon. These slopes come from regressions that were performed separately for each of the individual 61 non-stop codons. c, Codon slopes from the simultaneous multi-parameter binary logistic regression model M (Extended Data Table 1a and colored symbols in Fig. 3a) segregated according to the identity of the nucleotide at each of the three positions in the codon. d–h, The codon slopes from model M plotted versus the relative synonymous codon usage (RSCU) in E. coli BL21 (e), the codon adaptation index14 in E. coli K12 (f), the codon sensitivity24 in E. coli K12 (d), the tRNA adaptation index16 in E. coli K12 (g), and the concentration of exactly cognate tRNAs23 in E. coli K12 (h). The shapes and color-coding of the symbols in b–h, which are the same as in Fig. 3, encode structural and qualitative chemical characteristics of the amino acids.
Extended Data Figure 5. Variation in codon influence as a function of position in the coding sequence.
Plots showing the reduction in the deviance of the computational model resulting from adding a term representing the average value of the codon slope (colored symbols in Fig. 3a) in a window 5, 10 or 16 codons wide starting at the position indicated on the abscissa (that is, c-(c+4) in blue, c-(c+9) in red, or c-(c+15) in purple, respectively). The reduction in deviance was calculated relative to a base model containing codon frequencies in the entire coding sequence, head nucleotide composition terms (and aH, aH2, u3H and gH2), the predicted free energy of RNA folding in the head plus the 5′-UTR (ΔGUH), the binary indicator variable for head folding effects I, the binary variable indicating the occurrence of an AUAAUA di-codon dAUA, and the codon repetition rate r (n = 3,727). The mean slope of codons 2–6 presumably does not improve the model because the head-composition terms rather than codon content dominate the influence of this region on protein-expression level. This effect also probably accounts for the peaks in the sc-(c+9) and sc-(c+15) plots for windows starting at codon 7. For reference, adding s7–16 and s16–32 terms to model M contributes 29.7 points (P = 5 × 10⁻⁸) and 12 points (P = 5 × 10⁻⁴) of model deviance, respectively (Extended Data Table 1 and Fig. 4a). Dropping out terms to measure their influence (Fig. 4a) shows every codon contributes on average (423.7/270) = 1.6 deviance units, while codons 7–16 each contribute on average an additional (29.6/10) = 3.0 deviance units. Therefore, individual codons at positions 7–16 are approximately three times more influential than those in the tail of the gene.
Extended Data Figure 6. Further experiments on synthetic genes designed to enhance protein expression.
a–d, Data for three additional proteins equivalent to that presented in Fig. 5. The in vivo and in vitro expression properties from pET vectors are compared for inefficiently translated native (WT) genes and synonymous genes redesigned in the head or the tail or both using the 6AA, 31C-FO or 31C-FD methods. The type of sequence in the head (H) is indicated separately from that in the tail (T), and the name of the target protein is indicated on the left on each row. a, E. coli BL21(DE3) host cell growth curves at room temperature after induction of the target gene at time zero in chemically defined MJ9 medium. b, Coomassie-blue-stained SDS–PAGE gels of whole cells after overnight induction at 18 °C, with the amount loaded in each lane normalized to the A600 nm of the culture at the time of harvest. Black arrow indicates the migration position of the target protein. c, Autoradiographs of SDS–PAGE gels of in vitro translation reactions using fully purified translation components in the presence of [35S]methionine. Each reaction contained an equal amount of purified mRNA that was transcribed in vitro using T7 RNA polymerase. d, Northern blot analyses of the mRNA for the target protein after induction of expression in vivo. An equal amount of total RNA was loaded in each lane, and blots were hybridized with a probe matching the 5′-UTR. e, f, Coomassie blue stained SDS–PAGE gels (e) and anti-tetrahistidine western blots (f) showing that gene optimization has equivalent effects at physiological protein expression levels. Pairs of synonymous native and codon-optimized 31C-FOH/T genes with C-terminal hexahistidine tags were re-cloned under control of the arabinose-inducible promoter in a pBAD vector53, and the concentration of arabinose in the growth medium was adjusted so the 31C-FOH/T genes yeilded protein expression in the physiological range as assessed from Coomassie blue stained SDS-PAGE gels of whole cell extracts. Black arrows indicate locations of the induced target proteins. Substantially lower protein expression from the WT genes compared to the synonymous 31C-FOH/T genes in these experiments demonstrates that equivalent codon-usage effects are observed when proteins are overexpressed using a pET vector or expressed at roughly phyiological level using a pBAD vector, despite changes explained in the Online Methods in the polymerase used to transcribe the genes, the medium used to grow the cells, and the timescale and temperature of the protein-induction process.The constitutively expressed ~25-kDa protein that reacts with the anti-tetrahistidine antibody in the cells containing the 31C-FOH/T gene for YcaQ is probably an amino-terminally truncated protein synthesized from a 5′-truncated mRNA transcribed from an internal promoter sequence fortuitously introduced into this synthetic gene. Uncropped scans of the gels shown here are included in Supplementary Fig. 1.
Extended Data Figure 7. In vivo expression of synthetic genes with sequences optimized using the 31C-FO method.
a, Coomassie-blue-stained SDS–PAGE gels of whole-cell extracts after overnight induction at 18 °C of synthetic genes designed using the 31C-FOH method for 17 different proteins. All genes were cloned in-frame with a C-terminal hexa-histidine tag in the same pET21 plasmid derivative used to generate our large-scale protein-expression data set38. Equal volumes of induced cultures were loaded in all lanes. b, Coomassie-blue-stained SDS–PAGE gels of whole-cell extracts (top) and the corresponding soluble fractions (bottom) after overnight induction at 18 °C of 14 of the same synthetic genes fused in-frame at the C terminus of the gene for the E. coli maltose-binding protein (MBP). The protein sequences come from the following source organisms: LCABL_04230 from Lactobacillus casei BL23; VIPARP466_2889 from Vibrio parahaemolyticus; AM1_4824 from Acaryochloris marina MBIC11017; CLO_0718 from Clostridium botulinum E1; ESAG_04692 from Escherichia sp. 3_2_53FAA; FTCG_00666 and FTCG_01175 from Francisella tularensis subsp. novicida GA99-3549; FTE_1275, FTE_1608, FTE_0420 and FTE_1020 from Francisella tularensis subsp. novicida FTE; FRANO wbtG and A1DS62_FRANO from Francisella novicidal; FTBG_00988 and A7JEH2_FRATL from Francisella tularensis subsp. tularensis FSC033; FTN_1238 from Francisella tularensis subsp. novicida U112; O1O_09285 from Pseudomonas aeruginosa MPAO1/P1; Sthe_2331 from Sphaerobacter thermophilus DSM20745/S6022; SEVCU126_0606 from Staphylococcus epidermidis VCU126; and Y007_20720 from Salmonella enterica subsp. enterica serovar Montevideo 507440-20.
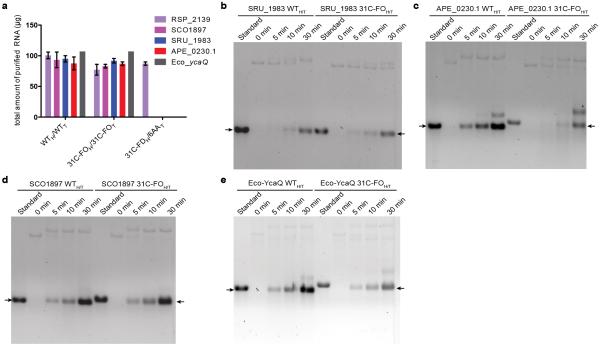
Extended Data Figure 8. Yield of mRNA from in vitro transcription using purified T7 RNA polymerase.
a, Final yield of mRNA purified from reactions conducted under identical conditions, as described in the Methods. The yields were calculated from the optical density at 260 nm. b–e, Kinetic analyses of in vitro transcription reactions using formaldehyde-agarose gel electrophoresis. Samples were taken at 0, 5, 10 and 30 min. The gels were stained with ethidium bromide. The ‘standard’ lane contains 1 μg of the same mRNA after purification to enable calibration for differences in the sensitivity of the molecules to staining. Reactions were started by addition of the wild-type or 31C-FOH/31C-FOT (31C-FOH/T) linearized plasmids encoding SRU_1983 (b), APE_0230.1 (c), SCO1897 (d),or Eco-YcaQ (e).
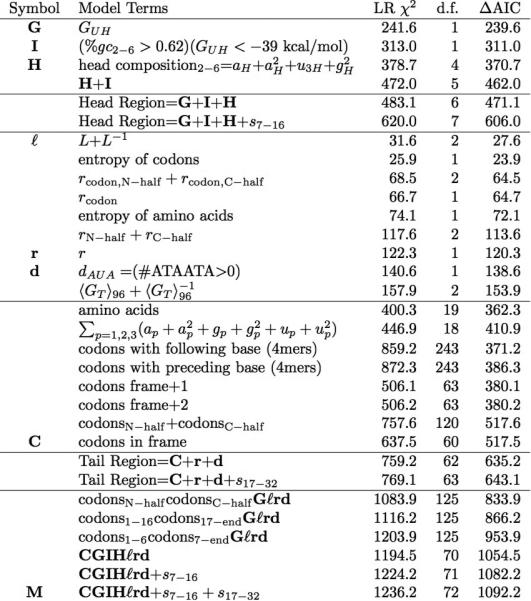
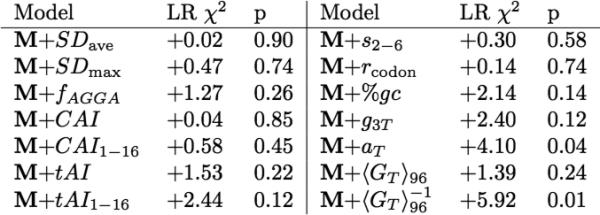
Extended Data Table 1.
Development and analysis of the simultaneous multi-parameter binary logistic regression model
|
|
a, Summary of model development calculations. The symbols defined in the left-most column represent single variables or combinations of variables that make a significant contribution to the final model M (bottom row). Inclusion of these symbols in the ‘model terms’ column indicates that the corresponding combination of variables is included in that model. The likelihood ratio (LR) c2 measures the difference in deviance relative to that of the null model (5153.8), using the formulae defined in the Methods (n = 3,727). The ΔAIC, which is equal to (LR c2 - 2*d.f.), is a standard measure of whether an improvement in model quality exceeds that expected at random from a model with a given number of degrees of freedom (d.f.)53–55. Because many compositional, free energy, and other terms were considered for inclusion in the model, a factor of 100 was used to correct for multiple-hypothesis testing, and parameters were only included in the final model M if significant at a Bonferroni-corrected false discovery rate of 5% (that is, P < 0.05/100 = 5 × 10⁻⁴). Most parameters are defined in the main text. The variables r and rcodon represent the amino acid and codon repetition rates, respectively, which were calculated as described in the Methods. The variables ap, gp and up indicate the fractional content of the respective base at the p position in codons throughout the gene. The subscripts 1–6, 1–16, 7-end, 7–16, 17–32, N-half and C-half indicate models in which the coefficients for the indicated parameter were optimized separately in the indicated range of codons or in the first or second halves of each gene, respectively. <GT>96 is the average value of the predicted energy of mRNA folding in 50% overlapping windows 96 nucleotides long in the tail of the gene; although this parameter is strongly correlated with outcome (Fig. 1h), it does not appear in the final model, indicating that its apparent influence probably derives from mechanistic effects exerted by cross-correlated parameters (for example, as shown in Extended Data Figs 3 and 4). ‘Codons’ indicates independent coefficients for the frequencies of each of the relevant 3-mers or 4-mers with one omitted to ensure proper normalization. The ‘codons in frame’ model excludes the three stop codons and AUG, effectively causing the contribution of this last codon to be absorbed into the constant term in the model. All calculations excluded the C-terminal LEHHHHHH tag carried by every protein. b, Effects of adding terms to the final computational model M. The LR χ2 column shows the change in this value if the indicated term is added to model M, which is defined in the final row in a. Parameters and subscripts appearing in that table have the same definition here. SDave and SDmax represent the average and the maximum of a Boltzmann-weighting term for hybridization of sub-sequences in any frame to the anti-Shine–Dalgarno sequence at the 5’ terminus of ribosomal 16S RNA, while fAGGA represents the frequency in any frame of this subsequence that is complementary to its core. CAI, codon adaptation index14; tAI, tRNA adaptation index16.
Extended Data Table 2.
Codons used for synonymous gene design
| Degeneracy | WT | 6AA | 31C |
|---|---|---|---|
| Ala | 4 | 4 | GCT, GCA |
| Arg | 6 | CGT | CGT, CGA |
| Asn | 2 | 2 | AAT |
| Asp | 2 | GAT | GAT |
| Cys | 2 | 2 | TGT |
| Gln | 2 | CAA | CAA, CAG |
| Glu | 2 | GAA | GAA |
| Gly | 4 | 4 | GGT |
| His | 2 | CAT | CAT, CAC |
| Ile | 3 | ATT | ATT, ATC |
| Leu | 6 | 6 | TTA, TTG, CTA |
| Lys | 3 | 3 | AAA |
| Met | 1 | 1 | ATG |
| Phe | 2 | 2 | TTT |
| Pro | 4 | 4 | CCT, CCA |
| Ser | 6 | 6 | AGT, TCA |
| Thr | 4 | 4 | ACA, ACT |
| Trp | 1 | 1 | TGG |
| Tyr | 2 | 2 | TAT |
| Val | 4 | 4 | GTT, GTA |
In our design of synonymous sequences, we reduced the native degeneracy of the genetic code to eliminate codons that correlate with reduced protein expression in single-variable logistic-regression analyses of our large-scale data set (dark grey symbols in Fig. 3a). In the 6AA approach, a single codon was used for 6 amino acids, while codons for the other 14 amino acids were not changed from the wild-type gene sequence. In the 31C-FO (and 31C-FD) approaches, the free energy was optimized (or de-optimized) using only the indicated subset of codons for each amino acid.
Supplementary Material
ACKNOWLEDGEMENTS
This work was supported by NIGMS Protein Structure Initiative grant U54-GM094597 to the Northeast Structural Genomics Consortium to JH and GTM, and NIH grant GM106372 to DPA. We thank B. Klingenberg, R. Gonzalez, M. Gottesman, and V. de Crécy-Lagard for advice.
Footnotes
AUTHOR CONTRIBUTIONS
TBA, RX, JKE, JFH, and GTM developed the protein-expression platform. TBA, RX, and GTM generated the expression dataset. WNP initiated and MS, MV, JDL, GB, JFH, and DPA completed the computational analyses. HN, KHW, and RX constructed genes that RL, KHW, and GB used for biochemical studies. GB, GTM, DPA, and JFH designed the research and wrote the paper.
REFERENCES
- 1.Chen GT, Inouye M. Role of the AGA/AGG codons, the rarest codons in global gene expression in Escherichia coli. Genes Dev. 1994;8:2641–2652. doi: 10.1101/gad.8.21.2641. [DOI] [PubMed] [Google Scholar]
- 2.Deana A, Ehrlich R, Reiss C. Synonymous codon selection controls in vivo turnover and amount of mRNA in Escherichia coli bla and ompA genes. J Bacteriol. 1996;178:2718–2720. doi: 10.1128/jb.178.9.2718-2720.1996. [DOI] [PMC free article] [PubMed] [Google Scholar]
- 3.Kudla G, Murray AW, Tollervey D, Plotkin JB. Coding-sequence determinants of gene expression in Escherichia coli. Science. 2009;324:255–258. doi: 10.1126/science.1170160. [DOI] [PMC free article] [PubMed] [Google Scholar]
- 4.Tuller T, Waldman YY, Kupiec M, Ruppin E. Translation efficiency is determined by both codon bias and folding energy. Proc Natl Acad Sci U S A. 2010;107:3645–3650. doi: 10.1073/pnas.0909910107. [DOI] [PMC free article] [PubMed] [Google Scholar]
- 5.Goodman DB, Church GM, Kosuri S. Causes and Effects of N-Terminal Codon Bias in Bacterial Genes. Science. 2013 doi: 10.1126/science.1241934. [DOI] [PubMed] [Google Scholar]
- 6.Castillo-Mendez MA, Jacinto-Loeza E, Olivares-Trejo JJ, Guarneros-Pena G, Hernandez-Sanchez J. Adenine-containing codons enhance protein synthesis by promoting mRNA binding to ribosomal 30S subunits provided that specific tRNAs are not exhausted. Biochimie. 2012;94:662–672. doi: 10.1016/j.biochi.2011.09.019. [DOI] [PubMed] [Google Scholar]
- 7.Bentele K, Saffert P, Rauscher R, Ignatova Z, Bluthgen N. Efficient translation initiation dictates codon usage at gene start. Mol Syst Biol. 2013;9:675. doi: 10.1038/msb.2013.32. [DOI] [PMC free article] [PubMed] [Google Scholar]
- 8.Hunt RC, Simhadri VL, Iandoli M, Sauna ZE, Kimchi-Sarfaty C. Exposing synonymous mutations. Trends Genet. 2014 doi: 10.1016/j.tig.2014.04.006. [DOI] [PubMed] [Google Scholar]
- 9.Spencer PS, Siller E, Anderson JF, Barral JM. Silent substitutions predictably alter translation elongation rates and protein folding efficiencies. J Mol Biol. 2012;422:328–335. doi: 10.1016/j.jmb.2012.06.010. [DOI] [PMC free article] [PubMed] [Google Scholar]
- 10.Li GW, Burkhardt D, Gross C, Weissman JS. Quantifying absolute protein synthesis rates reveals principles underlying allocation of cellular resources. Cell. 2014;157:624–635. doi: 10.1016/j.cell.2014.02.033. [DOI] [PMC free article] [PubMed] [Google Scholar]
- 11.Li G-W, Oh E, Weissman JS. The anti-Shine-Dalgarno sequence drives translational pausing and codon choice in bacteria. Nature. 2012;484:538–541. doi: 10.1038/nature10965. [DOI] [PMC free article] [PubMed] [Google Scholar]
- 12.Gingold H, Pilpel Y. Determinants of translation efficiency and accuracy. Mol Syst Biol. 2011;7:481. doi: 10.1038/msb.2011.14. [DOI] [PMC free article] [PubMed] [Google Scholar]
- 13.Cannarozzi G, et al. A role for codon order in translation dynamics. Cell. 2010;141:355–367. doi: 10.1016/j.cell.2010.02.036. [DOI] [PubMed] [Google Scholar]
- 14.Sharp PM, Li WH. The codon Adaptation Index--a measure of directional synonymous codon usage bias, and its potential applications. Nucleic Acids Res. 1987;15:1281–1295. doi: 10.1093/nar/15.3.1281. [DOI] [PMC free article] [PubMed] [Google Scholar]
- 15.Ninio J. Fine tuning of ribosomal accuracy. FEBS Lett. 1986;196:1–4. doi: 10.1016/0014-5793(86)80202-2. [DOI] [PubMed] [Google Scholar]
- 16.Tuller T, et al. An evolutionarily conserved mechanism for controlling the efficiency of protein translation. Cell. 2010;141:344–354. doi: 10.1016/j.cell.2010.03.031. [DOI] [PubMed] [Google Scholar]
- 17.Wallace EW, Airoldi EM, Drummond DA. Estimating selection on synonymous codon usage from noisy experimental data. Mol Biol Evol. 2013;30:1438–1453. doi: 10.1093/molbev/mst051. [DOI] [PMC free article] [PubMed] [Google Scholar]
- 18.Caskey CT, Beaudet A, Nirenberg M. RNA codons and protein synthesis. 15. Dissimilar responses of mammalian and bacterial transfer RNA fractions to messenger RNA codons. J Mol Biol. 1968;37:99–118. doi: 10.1016/0022-2836(68)90076-4. [DOI] [PubMed] [Google Scholar]
- 19.Ikemura T. Correlation between the abundance of Escherichia coli transfer RNAs and the occurrence of the respective codons in its protein genes: a proposal for a synonymous codon choice that is optimal for the E. coli translational system. J Mol Biol. 1981;151:389–409. doi: 10.1016/0022-2836(81)90003-6. [DOI] [PubMed] [Google Scholar]
- 20.Muramatsu T, et al. Codon and amino-acid specificities of a transfer RNA are both converted by a single post-transcriptional modification. Nature. 1988;336:179–181. doi: 10.1038/336179a0. [DOI] [PubMed] [Google Scholar]
- 21.Zhang SP, Zubay G, Goldman E. Low-usage codons in Escherichia coli, yeast, fruit fly and primates. Gene. 1991;105:61–72. doi: 10.1016/0378-1119(91)90514-c. [DOI] [PubMed] [Google Scholar]
- 22.Bulmer M. The selection-mutation-drift theory of synonymous codon usage. Genetics. 1991;129:897–907. doi: 10.1093/genetics/129.3.897. [DOI] [PMC free article] [PubMed] [Google Scholar]
- 23.Dong H, Nilsson L, Kurland CG. Co-variation of tRNA Abundance and Codon Usage inEscherichia coliat Different Growth Rates. Journal of Molecular Biology. 1996;260:649–663. doi: 10.1006/jmbi.1996.0428. [DOI] [PubMed] [Google Scholar]
- 24.Elf J, Nilsson D, Tenson T, Ehrenberg M. Selective charging of tRNA isoacceptors explains patterns of codon usage. Science. 2003;300:1718–1722. doi: 10.1126/science.1083811. [DOI] [PubMed] [Google Scholar]
- 25.Dittmar KA, Sorensen MA, Elf J, Ehrenberg M, Pan T. Selective charging of tRNA isoacceptors induced by amino-acid starvation. EMBO Rep. 2005;6:151–157. doi: 10.1038/sj.embor.7400341. [DOI] [PMC free article] [PubMed] [Google Scholar]
- 26.Zhang F, Saha S, Shabalina SA, Kashina A. Differential arginylation of actin isoforms is regulated by coding sequence-dependent degradation. Science. 2010;329:1534–1537. doi: 10.1126/science.1191701. [DOI] [PMC free article] [PubMed] [Google Scholar]
- 27.Vivanco-Dominguez S, et al. Protein synthesis factors (RF1, RF2, RF3, RRF, and tmRNA) and peptidyl-tRNA hydrolase rescue stalled ribosomes at sense codons. J Mol Biol. 2012;417:425–439. doi: 10.1016/j.jmb.2012.02.008. [DOI] [PubMed] [Google Scholar]
- 28.Dana A, Tuller T. The effect of tRNA levels on decoding times of mRNA codons. Nucleic Acids Res. 2014;42:9171–9181. doi: 10.1093/nar/gku646. [DOI] [PMC free article] [PubMed] [Google Scholar]
- 29.Pelechano V, Wei W, Steinmetz Lars M. Widespread Co-translational RNA Decay Reveals Ribosome Dynamics. Cell. 2015;161:1400–1412. doi: 10.1016/j.cell.2015.05.008. [DOI] [PMC free article] [PubMed] [Google Scholar]
- 30.Presnyak V, et al. Codon optimality is a major determinant of mRNA stability. Cell. 2015;160:1111–1124. doi: 10.1016/j.cell.2015.02.029. [DOI] [PMC free article] [PubMed] [Google Scholar]
- 31.Drummond DA, Wilke CO. Mistranslation-induced protein misfolding as a dominant constraint on coding-sequence evolution. Cell. 2008;134:341–352. doi: 10.1016/j.cell.2008.05.042. [DOI] [PMC free article] [PubMed] [Google Scholar]
- 32.Shakin-Eshleman SH, Liebhaber SA. Influence of duplexes 3' to the mRNA initiation codon on the efficiency of monosome formation. Biochemistry. 1988;27:3975–3982. doi: 10.1021/bi00411a013. [DOI] [PubMed] [Google Scholar]
- 33.Quax TE, et al. Differential translation tunes uneven production of operon-encoded proteins. Cell Rep. 2013;4:938–944. doi: 10.1016/j.celrep.2013.07.049. [DOI] [PubMed] [Google Scholar]
- 34.Letzring DP, Wolf AS, Brule CE, Grayhack EJ. Translation of CGA codon repeats in yeast involves quality control components and ribosomal protein L1. RNA. 2013;19:1208–1217. doi: 10.1261/rna.039446.113. [DOI] [PMC free article] [PubMed] [Google Scholar]
- 35.Ude S, et al. Translation elongation factor EF-P alleviates ribosome stalling at polyproline stretches. Science. 2013;339:82–85. doi: 10.1126/science.1228985. [DOI] [PubMed] [Google Scholar]
- 36.Iost I, Dreyfus M. The stability of Escherichia coli lacZ mRNA depends upon the simultaneity of its synthesis and translation. Embo j. 1995;14:3252–3261. doi: 10.1002/j.1460-2075.1995.tb07328.x. [DOI] [PMC free article] [PubMed] [Google Scholar]
- 37.Iost I, Guillerez J, Dreyfus M. Bacteriophage T7 RNA polymerase travels far ahead of ribosomes in vivo. J Bacteriol. 1992;174:619–622. doi: 10.1128/jb.174.2.619-622.1992. [DOI] [PMC free article] [PubMed] [Google Scholar]
- 38.Acton TB, et al. Robotic cloning and Protein Production Platform of the Northeast Structural Genomics Consortium. Methods Enzymol. 2005;394:210–243. doi: 10.1016/S0076-6879(05)94008-1. [DOI] [PubMed] [Google Scholar]
- 39.Price WN, et al. Large-scale experimental studies show unexpected amino acid effects on protein expression and solubility in vivo in E. coli. Microbial Informatics and Experimentation. 2011;1:6. doi: 10.1186/2042-5783-1-6. [DOI] [PMC free article] [PubMed] [Google Scholar]
- 40.Duval M, et al. Escherichia coli ribosomal protein S1 unfolds structured mRNAs onto the ribosome for active translation initiation. PLoS Biol. 2013;11:e1001731. doi: 10.1371/journal.pbio.1001731. [DOI] [PMC free article] [PubMed] [Google Scholar]
- 41.Reuter JS, Mathews DH. RNAstructure: software for RNA secondary structure prediction and analysis. BMC Bioinformatics. 2010;11:129. doi: 10.1186/1471-2105-11-129. [DOI] [PMC free article] [PubMed] [Google Scholar]
- 42.Lu J, Deutsch C. Electrostatics in the ribosomal tunnel modulate chain elongation rates. J Mol Biol. 2008;384:73–86. doi: 10.1016/j.jmb.2008.08.089. [DOI] [PMC free article] [PubMed] [Google Scholar]
- 43.Ishihama Y, et al. Protein abundance profiling of the Escherichia coli cytosol. BMC Genomics. 2008;9:102. doi: 10.1186/1471-2164-9-102. [DOI] [PMC free article] [PubMed] [Google Scholar]
- 44.Chen H, Shiroguchi K, Ge H, Xie XS. Genome-wide study of mRNA degradation and transcript elongation in Escherichia coli. Mol Syst Biol. 2015;11:781. doi: 10.15252/msb.20145794. [DOI] [PMC free article] [PubMed] [Google Scholar]
- 45.dos Reis M. Unexpected correlations between gene expression and codon usage bias from microarray data for the whole Escherichia coli K-12 genome. Nucleic Acids Research. 2003;31:6976–6985. doi: 10.1093/nar/gkg897. [DOI] [PMC free article] [PubMed] [Google Scholar]
- 46.Nogueira T, de Smit M, Graffe M, Springer M. The relationship between translational control and mRNA degradation for the Escherichia coli threonyl-tRNA synthetase gene. J Mol Biol. 2001;310:709–722. doi: 10.1006/jmbi.2001.4796. [DOI] [PubMed] [Google Scholar]
- 47.Richards J, Sundermeier T, Svetlanov A, Karzai AW. Quality control of bacterial mRNA decoding and decay. Biochim Biophys Acta. 2008;1779:574–582. doi: 10.1016/j.bbagrm.2008.02.008. [DOI] [PMC free article] [PubMed] [Google Scholar]
- 48.Ivanova N, Pavlov MY, Ehrenberg M. tmRNA-induced release of messenger RNA from stalled ribosomes. J Mol Biol. 2005;350:897–905. doi: 10.1016/j.jmb.2005.05.033. [DOI] [PubMed] [Google Scholar]
- 49.Shoemaker CJ, Eyler DE, Green R. Dom34:Hbs1 promotes subunit dissociation and peptidyl-tRNA drop-off to initiate no-go decay. Science. 2010;330:369–372. doi: 10.1126/science.1192430. [DOI] [PMC free article] [PubMed] [Google Scholar]
- 50.Chadani Y, Ono K, Kutsukake K, Abo T. Escherichia coli YaeJ protein mediates a novel ribosome-rescue pathway distinct from SsrA- and ArfA-mediated pathways. Mol Microbiol. 2011;80:772–785. doi: 10.1111/j.1365-2958.2011.07607.x. [DOI] [PubMed] [Google Scholar]
- 51.Novick A, Weiner M. Enzyme Induction as an All-or-None Phenomenon. Proc Natl Acad Sci U S A. 1957;43:553–566. doi: 10.1073/pnas.43.7.553. [DOI] [PMC free article] [PubMed] [Google Scholar]
- 52.Jensen PR, Westerhoff HV, Michelsen O. The use of lac-type promoters in control analysis. Eur J Biochem. 1993;211:181–191. doi: 10.1111/j.1432-1033.1993.tb19885.x. [DOI] [PubMed] [Google Scholar]
- 53.Guzman LM, Belin D, Carson MJ, Beckwith J. Tight regulation, modulation, and high-level expression by vectors containing the arabinose PBAD promoter. J Bacteriol. 1995;177:4121–4130. doi: 10.1128/jb.177.14.4121-4130.1995. [DOI] [PMC free article] [PubMed] [Google Scholar]
- 54.Akaike H. A new look at the statistical model identification. Automatic Control, IEEE Transactions on. 1974;19:716–723. [Google Scholar]
- 55.Team RC. R: A language and environment for statistical computing. 2012 http://www.r-project.org/
- 56.Harrell FE., Jr. R package version 4.2-0. 2014 http://CRAN.R-project.org/package=rms.
- 57.Xiao R, et al. The high-throughput protein sample production platform of the Northeast Structural Genomics Consortium. J Struct Biol. 2010;172:21–33. doi: 10.1016/j.jsb.2010.07.011. [DOI] [PMC free article] [PubMed] [Google Scholar]
- 58.Acton TB, et al. Preparation of protein samples for NMR structure, function, and small-molecule screening studies. Methods Enzymol. 2011;493:21–60. doi: 10.1016/B978-0-12-381274-2.00002-9. [DOI] [PMC free article] [PubMed] [Google Scholar]
- 59.Jansson M, et al. High-level production of uniformly 15N- and 13C-enriched fusion proteins in Escherichia coli. J Biomol NMR. 1996;7:131–141. doi: 10.1007/BF00203823. [DOI] [PubMed] [Google Scholar]
- 60.Keseler IM, et al. EcoCyc: fusing model organism databases with systems biology. Nucleic Acids Research. 2013;41:D605–D612. doi: 10.1093/nar/gks1027. [DOI] [PMC free article] [PubMed] [Google Scholar]
- 61.Juncker AS, et al. Prediction of lipoprotein signal peptides in Gram-negative bacteria. Protein Sci. 2003;12:1652–1662. doi: 10.1110/ps.0303703. [DOI] [PMC free article] [PubMed] [Google Scholar]
- 62.Krogh A, Larsson B, von Heijne G, Sonnhammer EL. Predicting transmembrane protein topology with a hidden Markov model: application to complete genomes. J Mol Biol. 2001;305:567–580. doi: 10.1006/jmbi.2000.4315. [DOI] [PubMed] [Google Scholar]
Associated Data
This section collects any data citations, data availability statements, or supplementary materials included in this article.


