Abstract
Purpose
The purpose of this study was to evaluate an automated algorithm for detecting avascular area (AA) in optical coherence tomography angiograms (OCTAs) separated into three individual plexuses using a projection-resolved technique.
Methods
A 3 × 3 mm macular OCTA was obtained in 13 healthy and 13 mild nonproliferative diabetic retinopathy (NPDR) participants. A projection-resolved algorithm segmented OCTA into three vascular plexuses: superficial, intermediate, and deep. An automated algorithm detected AA in each of the three plexuses that were segmented and in the combined inner-retinal angiograms. We assessed the diagnostic accuracy of extrafoveal and total AA using segmented and combined angiograms, the agreement between automated and manual detection of AA, and the within-visit repeatability.
Results
The sum of extrafoveal AA from the segmented angiograms was larger in the NPDR group by 0.17 mm2 (P < 0.001) and detected NPDR with 94.6% sensitivity (area under the receiver operating characteristic curve [AROC] = 0.99). In the combined inner-retinal angiograms, the extrafoveal AA was larger in the NPDR group by 0.01 mm2 (P = 0.168) and detected NPDR with 26.9% sensitivity (AROC = 0.62). The total AA, inclusive of the foveal avascular zone, in the segmented and combined angiograms, detected NPDR with 23.1% and 7.7% sensitivity, respectively. The agreement between the manual and automated detection of AA had a Jaccard index of >0.8. The pooled SDs of AA were small compared with the difference in mean for control and NPDR groups.
Conclusions
An algorithm to detect AA in OCTA separated into three individual plexuses using a projection-resolved algorithm accurately distinguishes mild NPDR from control eyes. Automatically detected AA agrees with manual delineation and is highly repeatable.
Keywords: optical coherence tomography angiography, diabetic retinopathy, avascular area
Diabetic retinopathy (DR), characterized by capillary nonperfusion, vascular hyperpermeability, and neovascularization, is a leading cause of blindness.1–3 Capillary nonperfusion is an early finding of DR and increases with severity of DR. The Early Treatment of Diabetic Retinopathy Study (ETDRS) qualitatively evaluated macular ischemia using fluorescein angiography (FA) and found it to have predictive value for progression of disease.4,5 Such rigorous grading of FA, however, is seldom done in clinical practice. Accurate, objective, and automated evaluation of macular ischemia could be a valuable biomarker for DR that is also practical clinically. With FA, dependence on early transit for macular capillary details, obscuration of details due to dye leakage, and variability of contrast have limited the clinicians' ability to assess nonperfusion objectively. Optical coherence tomography angiography (OCTA), which rapidly provides high-contrast capillary details without the need for dye injection, makes such an objective evaluation of the capillaries more practical.6–13
Previously, we reported that automatically quantified total avascular area (AA) quantified on a 6 × 6 mm2 inner retinal OCTA-detected DR with high sensitivity and specificity, and it agreed with AA seen on FA.7 In that study, however, most of the diabetic participants had proliferative DR. Whether AA would detect DR with similar accuracy in less severe disease was uncertain.
Recently, we also reported on projection-resolved (PR) OCTA, a new technique to visualize three distinct retinal plexuses by solving the problem of projection artifacts that blurred the plexuses together.14 In DR eyes, we found that individual plexuses revealed more areas of capillary dropout than combined inner retinal angiograms.15 Projection-resolved OCTA, by visualizing the three plexuses separately, increased the sensitivity of detecting capillary nonperfusion.
Taking advantage of these advances, this study evaluated the diagnostic accuracy and repeatability of a distance-transform map-based automated algorithm to quantify AA in three individual plexuses on 3 × 3 mm2 PR OCTA macular angiograms. By applying this technique to patients with mild nonproliferative diabetic retinopathy (NPDR), we assessed the value of automatic quantification of nonperfusion in early DR.16
Methods
Data Acquisition
Healthy volunteers and diabetic participants with mild NPDR were recruited from Casey Eye Institute of Oregon Health and Science University (OHSU). Eyes with nondiabetic macular pathology, media opacity, or other significant eye disease were excluded. Informed consent was obtained, and the study was approved by the Institutional Review Board of OHSU. The study complied with the Declaration of Helsinki and Health Insurance Portability and Accountability Act. Clinicians initially graded the severity of DR using International Clinical Diabetic Retinopathy Severity Scale.17 A masked grader examined ETDRS seven-field color photographs to confirm disease severity.
Two 3 × 3 mm scans with 2-mm depth were obtained in one eye of each participants within a visit using a commercial spectral-domain OCT system (RTVue-XR; Optovue, Fremont, CA, USA) with a center wavelength of 840 nm, a full-width half maximum bandwidth of 45 nm, and an axial scan rate of 70 kHz.7 In the fast transverse scanning direction, 304 axial scans were sampled to obtain a single 3-mm B-scan. Two repeated B-scans were captured at a fixed position before proceeding to the next location. A total of 304 locations along a 3-mm distance in the slow transverse direction were sampled to form a three-dimensional data cube. All 608 B-scans in each data cube were acquired in 2.9 seconds.
Based on the volumetric OCT reflectance signal, the scanning software computed a signal strength index (SSI), which is often used as an indicator of scan quality.
Data Processing
Blood flow was detected using the split-spectrum amplitude decorrelation (SSADA).18–20 Projection artifacts were suppressed by the PR OCTA algorithm.14 Optical coherence tomography structural images were obtained by averaging two repeated B-scans. The structural and angiography data were generated simultaneously on each scan. For each scan, one x-fast scan and one y-fast scan were registered and merged through an orthogonal registration algorithm to remove motion artifacts.21,22
A directional graph search algorithm identified structural boundaries23: the inner limiting membrane (ILM), inner plexiform layer (IPL), inner nuclear layer (INL), outer plexiform layer (OPL), and outer nuclear layer (ONL). The superficial plexus was defined as the slab within the inner 80% of the ganglion cell complex (GCC) and minimum thickness of 61 μm. The intermediate plexus was defined as vessels in the outer 20% of GCC and inner 50% of INL. The deep plexus was defined as vessels in the remaining slab internal to the OPL and minimum thickness of 37 μm. We chose a proportional rather than fixed segmentation scheme because the three plexuses merge at the edge of the foveal avascular zone (FAZ),24 and a fixed segmentation scheme can result in arbitrary and meaningless differences in FAZ size between the vascular plexuses. In the normal eye, this scheme shows each plexus reaching the edge of the FAZ and avoids differences in the measurement of FAZ of three plexuses caused solely by the segmentation method (Campbell JP, Zhang M, Hwang TS, et al., manuscript submitted, 2016).
These three plexuses have been well characterized histologically in nonhuman primates and recently in human cadaveric eyes.24,25–28 Top view, maximum decorrelation projection of each slab created en face OCTA of each plexus.23 A combined angiogram showing the more superficial plexuses placed on top with different color showed the relationship between the plexuses.18,23
The image processing strategy developed in this work for nonperfusion quantification is mainly composed of three steps: preprocessing; vessel distance transform; and morphologic operations. This is outlined in Figure 1.
Figure 1.
Overview of the proposed algorithm for quantification of capillary nonperfusion.
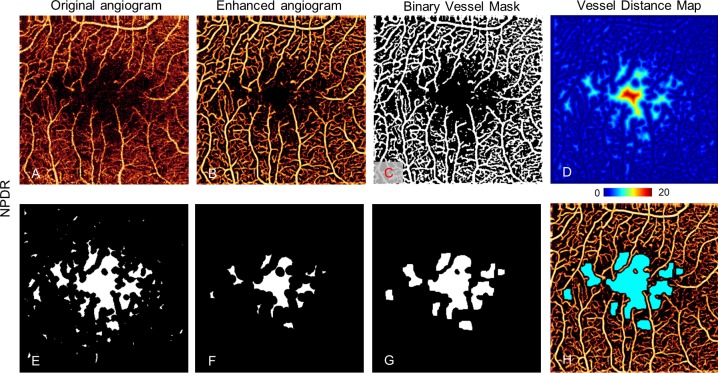
First, the original angiogram (Figs. 2A, 3A) was first enhanced using a two-scale (σ = 1 and 2 pixels) Frangi vesselness filter (step 1 in Figs. 1, 2B, 3B).29 This filter enhances vessels by obtaining vesselness measure on the basis of eigenvalues of the second-order local structure of the angiogram (Hessian) and suppresses background noise.30–32
Figure 2.
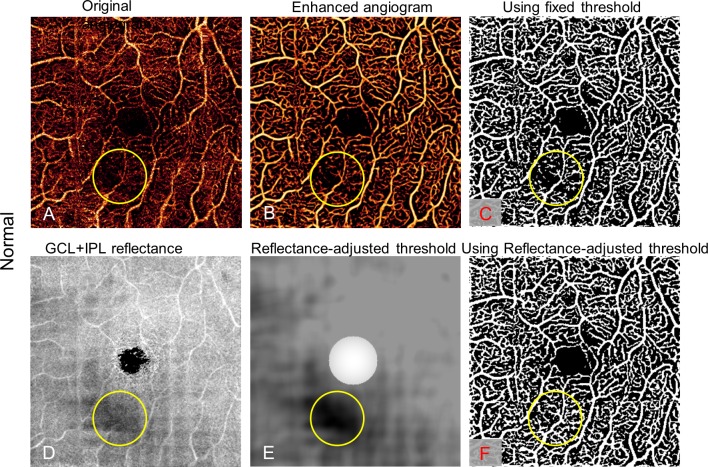
Reflectance-adjusted thresholding on a normal eye with a low signal strength region (yellow circle), caused by a vitreous opacity. The low signal region seen on the original angiogram (A) persists with vessel filter (B) and binary filter with fixed threshold (C), falsely simulating capillary dropout. An en face map of the GCL and IPL reflectance amplitude map (D) is filtered and scaled to create the reflectance-adjusted threshold (E). Applying this, the binary vessel mask (F) does not show an area of false capillary drop out in the low reflectance area.
Figure 3.
Nonperfusion detection in the superficial plexus of an NPDR eye. The original angiogram (A) is enhanced by a vesselness filter (B) and processed with a binary vessel mask with reflectance-adjusted thresholding (C), which is used to create a vessel distance map (D) by applying distance transform. Then morphologic operations removed regions with vessel distance less than four pixels (40 μm) (E) and then they eroded by a five-pixel-wide square kernel and threw away areas with minimum area smaller than eight pixels or a minor axis smaller than two pixels (F). Then remaining regions were dilated by seven-pixel-wide square kernel pixels (G). (H) Resulting avascular area (light blue) overlaid on the enhanced angiogram.
To distinguish flow signal from the background noise, we previously used a fixed threshold.7 However, the flow noise floor depends on the OCT reflectance signal,14,33,34 which may vary among scans and even within a single scan. Consequently, with the fixed cutoff, signal strength instability can cause within-visit variation, leading to false detection of capillary dropout from the locally reduced signal (e.g., by vitreous opacity; Fig. 2C). In this study, we established a reflectance-adjusted threshold using en face structural OCT of the ganglion cell layer (GCL) and IPL, which have moderate reflectance and are nearly free of cysts and exudates, making them good reference layers. The mean projection of reflectance between GCL and IPL (Fig. 2D) was taken as logarithm (S) and filtered with a 15 × 15 pixel Gaussian operator G, with an SD of 8 pixels and scaled (step 2 in Fig. 1) to generate a threshold image (Txy; Fig. 2E)
 |
The filter size and SD were set empirically. The scaling parameters a and b were trained from scans from two control eyes with in-scan signal variation and two NPDR eyes, identifying maximum avascular area in NPDR while only identifying the FAZ as an avascular area in control eyes. In this study, a was 8 × 10⁻⁵ and b was 8 × 10⁻². A relatively high threshold (maximum of T) was assigned to the 0.6-mm-diameter central area to facilitate a noise suppression in FAZ (Fig. 2E). The center of FAZ was identified manually.
This threshold image was then compared with the enhanced angiogram to determine capillary and static tissue from the enhanced angiogram, generating a binary vessel mask by thresholding the angiogram adaptively (step 3 in Figs. 1, 2F, 3C)
 |
Figure 2 shows that false detection of capillary nonperfusion can be avoided by this reflectance-adjusted threshold (Fig. 2F) over fixed thresholding (Fig. 2C).
Next, a vessel distance map was obtained by applying Euclidean distance transform to the binary vessel mask (Fig. 3D). Euclidean distance transforms of a binary image assign a number that is the distance between that pixel and the nearest nonzero pixel of the binary image35
 |
The value in the vessel distance map represents the distance of a given pixel (x, y) to its nearest vessel (x′, y′). This strategy does not give disproportionate value to larger vessels like the vessel density map, allowing more accurate detection of capillary nonperfusion. This method ignores the physiologic capillary-free area along the large vessels in normal eyes, which had been frequently detected as a nonperfusion area with our previous simple thresholding method.36
Finally, the nonperfusion map was acquired by thresholding the vessel distance map (DT > 4; Fig. 3E) and applying morphologic operations. The morphologic operations included (1) an erosion by a five-pixel-wide square kernel, (2) elimination of areas smaller than eight pixels or whose minor axis length was smaller than two pixels (Fig. 3F), and (3) dilation by a seven-pixel-wide square kernel (Fig. 3G). These parameters were empirically determined so that these operations limit AA to relatively large, smooth contiguous areas and avoid detecting nonphysiologic areas as AA. This procedure quantified each of the three plexuses and the total inner retinal angiogram. The total AA (TAA) and the extrafoveal AA (EAA), defined as the AA outside the 1-mm central circle, were separately tabulated to minimize the contribution of normal variations in foveal avascular zone size. These values were corrected for magnification variation associated with axial length variation as previously described.37
Data Analysis
The Mann-Whitney U-test was used to compare the detected AA between the patients with NPDR and the healthy controls. The diagnostic accuracy of each parameter was assessed by sensitivity with a fixed specificity and the area under the receiver operating characteristic curve (AROC). Repeatability of the detected AA was assessed by evaluating the pooled SD for eyes that had two scans with an SSI greater than 54. We also compared the detected AA in different plexuses in NPDR. All statistical tests were done using SPSS, version 20 (IBM, Armonk, NY, USA).
The AA in healthy controls identified by the automated procedure was compared with manual grading for detection accuracy. The manual results were delineated by using the free selection tool in GIMP 2.8 (https://www.gimp.org; provided in the public domain by The Gimp Team). The Jaccard coefficient, defined as the area of intersection divided by the area of union, measured the similarity between the automated result and manual result. The false-positive and -negative errors were also computed.
Results
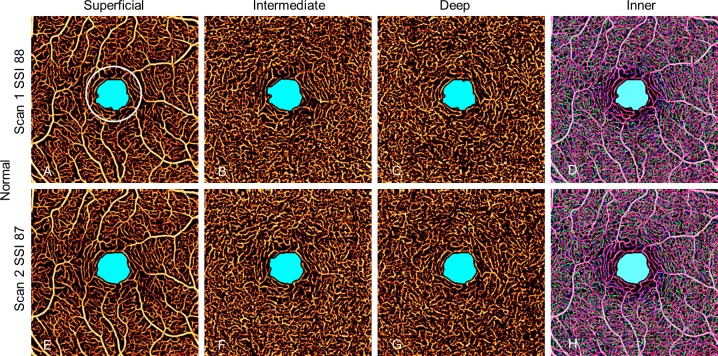
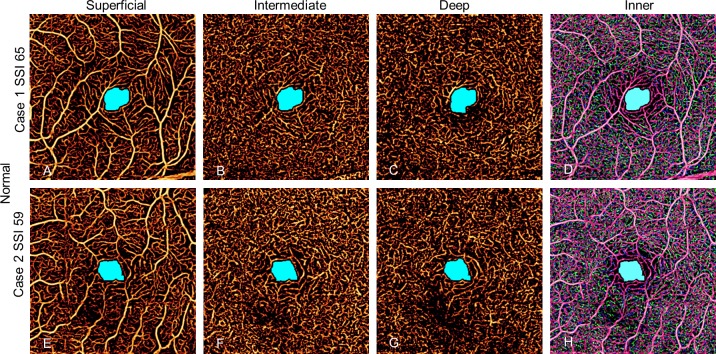
Eyes from 13 healthy volunteers (mean [SD] age: 43 [13] years, 10 women) and 13 participants with mild NPDR (mean [SD] age: 59 [8] years, 7 women) were imaged, and one eye from each participant was randomly chosen for inclusion in the study. The SSI of the control group ranged from 59 to 88 and in the NPDR group from 54 to 81. No eye in the study had cysts in the inner retina. In the control group, the automated algorithm detected AA only inside the central 1-mm circle in combined one-layer or three-layer angiograms (Fig. 4), with the exception of one eye that had an extrafoveal AA of 0.01 mm2. The AA in normal controls detected by automated algorithm agreed with manual grading with Jaccard indices of 0.85, 0.82, and 0.81 for superficial, intermediate, and deep angiograms, respectively (Table 1), and was independent of signal strength variation between or within scans (Fig. 5).
Figure 4.
Avascular area in two scans of a normal eye with high SSI. The AA is limited to the foveal avascular zone and is similar in size and shape in all scans whether in individual plexuses or combined inner retinal angiogram. The EAA is defined as AA outside the white 1-mm circle.
Table 1.
Agreement Between Automated Detection and Manual Delineation of the Macular AA in Normal Controls
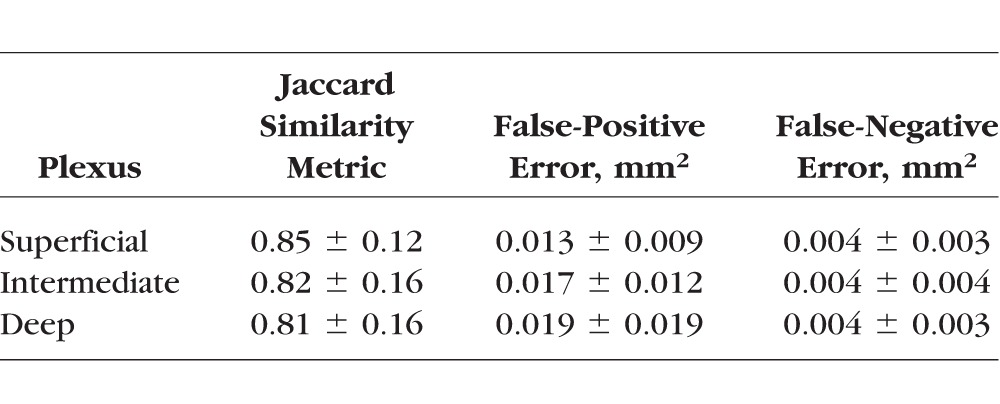
Figure 5.
Two normal control eyes with relatively low SSI scans in individual plexuses and combined inner retinal angiogram. No avascular area outside the foveal avascular zone is detected.
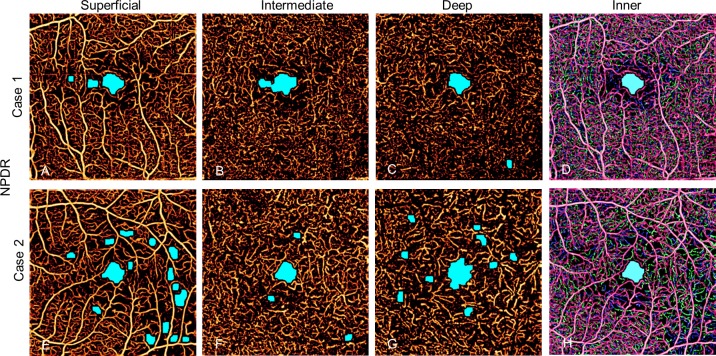
In the NPDR group, the automated algorithm identified AA that was frequently incongruent between the three plexuses. As a result, it sometimes failed to detect any AA outside the FAZ when applied to the combined inner retinal angiogram in eyes with AA in individual plexuses (Fig. 6). The AA in the superficial and deep plexuses tended to be larger than in the intermediate plexus (Table 2).
Figure 6.
Two eyes with mild NPDR. Individual plexuses show incongruent areas of capillary nonperfusion that are not detected with combined inner retinal angiogram.
Table 2.
Avascular Area in Diabetic Retinopathy and Control Eyes
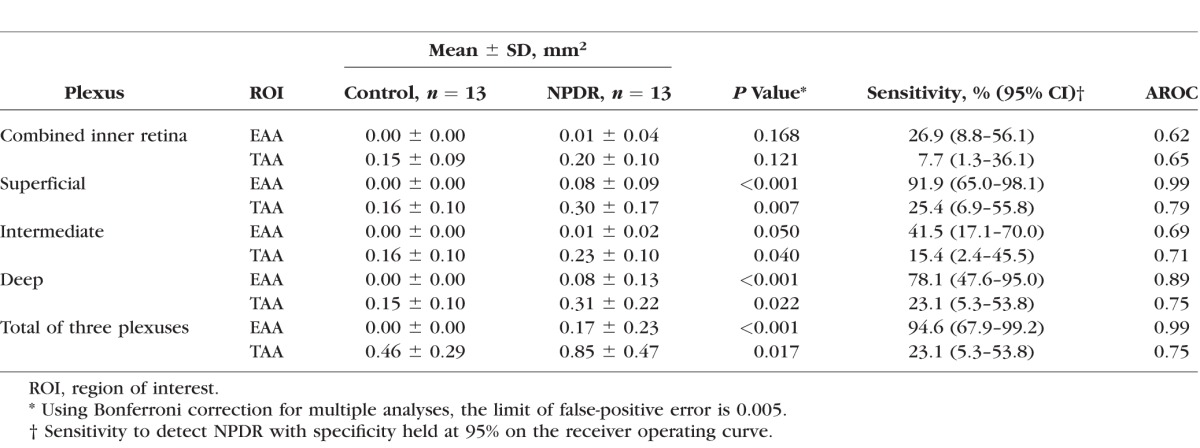
There was no significant difference in EAA or TAA between the control and NPDR groups when the algorithm was applied to the combined one-layer angiogram. When three plexuses were individually evaluated, the EAA and TAA in each of the three plexuses were significantly larger in the NPDR group compared with the control group (Table 2).
Holding the specificity at 95%, the three plexuses showed that the sum of EAA was the most sensitive with the best diagnostic accuracy at an AROC of 0.99 (Table 2). Total AA had lower sensitivity and diagnostic accuracy.
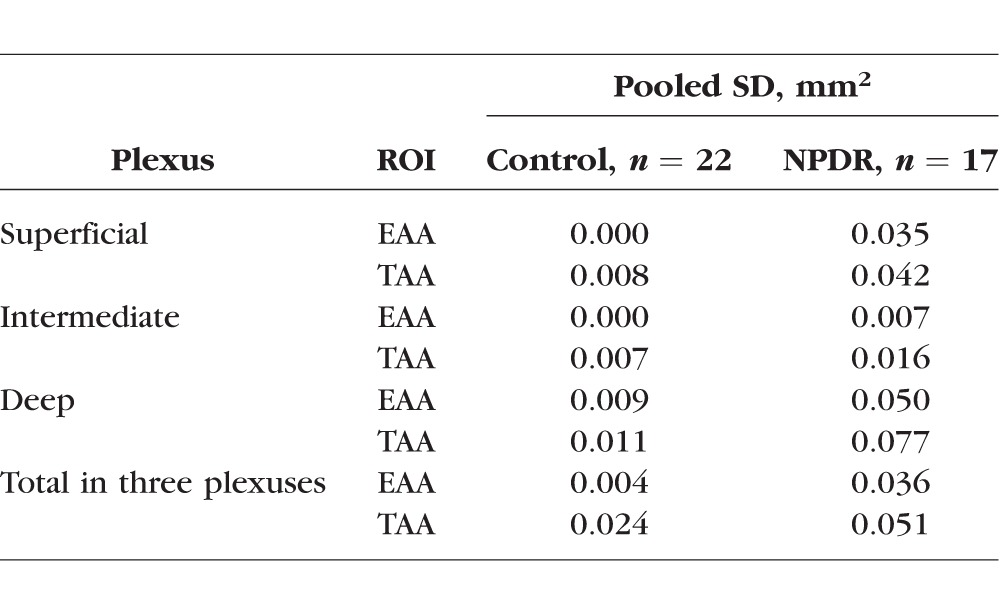
Within-visit repeatability was assessed using eyes with two scans in the same visit with an SSI greater than 54 (Table 3). Twenty-two eyes from control participants and 17 eyes from NPDR participants had two scans with adequate signal strength. The pooled SD of AA ranged from 0.000 to 0.024 mm2 in controls and from 0.035 to 0.051 mm2 in NPDR patients (Table 3). For parameters with a statistical difference between the NPDR and control group, the pooled SDs were smaller than the difference between the two groups. For all other parameters, the pooled SDs were smaller than the population SDs (comparing Table 2 and Table 3).
Table 3.
Within-Visit Repeatability of AA Measurements
The participants in the NPDR group were older than the control group. The possible relationship between age and AA was examined with a Pearson test. The correlation coefficients of superficial, intermediate, and deep plexuses for EAA and participant age were 0.129 (P = 0.674), 0.033 (P = 0.915), and 0.19 (P = 0.534), respectively. The correlation coefficients of superficial, intermediate, and deep plexuses for TAA were 0.179 (P = 0.558), 0.051 (P = 0.868), and 0.233 (P = 0.443).
Discussion
We improved the method for automated quantification of nonperfusion using OCTA by combining several image processing techniques. Projection-resolved OCTA allowed visualization of three distinct retinal plexuses and detection of capillary abnormalities not visible in combined inner retinal angiograms. A vesselness filter removed the spurious pixels that can interfere with the detection of actual gaps between vessels. The use of a vessel distance map minimized disproportionate contribution of large vessels in determining vessel density abnormality and eliminated the undesirable detection of a normal avascular area along large vessels of the superficial plexus as AA. By using local reflectance signal strength as a reference for separating flow signal and background noise, false-positive detection of nonperfusion is minimized, and the repeatability of measurement was improved. Morphologic operations further reduce false-positive detection of AA.
By applying these techniques to eyes with mild NPDR, the total nonperfusion area outside the central 1-mm circle could distinguish NPDR from control eyes with high diagnostic accuracy, even in eyes where the combined inner retinal angiogram did not reveal any nonperfusion. This study confirms the potential of automatically quantified AA using OCTA as a biomarker in DR, even in less severe disease.
The FAZ is known to have significant variability in normal and diabetic patients.38–40 With segmentation into individual plexuses, the FAZ size can be further affected by segmentation scheme. Exclusion of the central 1-mm circle factored out this normal variation of FAZ and allowed good diagnostic accuracy of AA quantification.
In this cohort of mild NPDR patients, the EAA was larger in superficial and deep plexuses compared with the intermediate plexus, suggesting that nonperfusion in the intermediate plexus may occur later in the disease process of DR. A prospective study with a larger cohort is needed to verify this.
This study is limited by small numbers and a cross-sectional design. The two groups were not age or sex matched. However, we did not observe a significant age effect in the measured AA in any vascular plexus. Furthermore, the DR group lacked eyes with significant macular edema. Large cysts and exudates may interfere with this approach of quantifying AA. More advanced techniques may be required to generalize this method to eyes with macular edema.
Also, the study had a limited field of view of 3 × 3 mm2 area. The significance of peripheral pathology in DR is well established.41 Although this approach had excellent sensitivity and specificity for detecting DR, a wider field of view with faster machines is likely necessary to further improve the utility of OCTA and its biomarkers in the management of DR.
Acknowledgments
Supported by Grants DP3 DK104397, R01 EY024544, R01 EY023285, and P30 EY010572 from the National Institutes of Health and unrestricted departmental funding from Research to Prevent Blindness.
Oregon Health & Science University (OHSU), David Huang, and Yali Jia have a significant financial interest in Optovue, Inc., a company that may have a commercial interest in the results of this research and technology. These potential conflicts of interest have been reviewed and managed by OHSU. David Huang receives royalties on an optical coherence tomography patent licensed by the Massachusetts Institute of Technology (MIT) to Carl Zeiss Meditec, Inc. Other authors do not have financial interest in the subject of this article.
Disclosure: M. Zhang, None; T.S. Hwang, None; C. Dongye, None; D.J. Wilson, None; D. Huang, Optovue, Inc. (F, I), Carl Zeiss Meditec, Inc., (R), P; Y. Jia, Optovue, Inc. (F) P
References
- 1. Congdon N, O'Colmain B, Klaver CC, et al. ; . for the Eye Diseases Prevalence Research Group. Causes and prevalence of visual impairment among adults in the United States. Arch Ophthalmol. 2004; 122: 477–485. [DOI] [PubMed] [Google Scholar]
- 2. Panel AR. Preferred Practice Pattern, Diabetic Retinopathy. San Francisco CA: American Academy of Ophthalmology; 2014: 1–65. [Google Scholar]
- 3. Antonetti DA,, Klein R,, Gardner TW. Diabetic retinopathy. N Engl J Med. 2012; 366: 1227–1239. [DOI] [PubMed] [Google Scholar]
- 4. Early Treatment Diabetic Retinopathy Study Research Group. Fluorescein angiographic risk factors for progression of diabetic retinopathy: ETDRS report number 13. Ophthalmology. 1991; 98: 834–840. [PubMed] [Google Scholar]
- 5. Early Treatment Diabetic Retinopathy Study Research Group. Classification of diabetic retinopathy from fluorescein angiograms: ETDRS report number 11. Ophthalmology. 1991; 98: 807–822. [PubMed] [Google Scholar]
- 6. Jia Y,, Bailey ST,, Hwang TS,, et al. Quantitative optical coherence tomography angiography of vascular abnormalities in the living human eye. Proc Natl Acad Sci U S A. 2015; 112: E2395–E2402. [DOI] [PMC free article] [PubMed] [Google Scholar]
- 7. Hwang TS,, Gao SS,, Liu L,, et al. Automated quantification of capillary nonperfusion using optical coherence tomography angiography in diabetic retinopathy. JAMA Ophthalmol. 2016; 134: 367–373. [DOI] [PMC free article] [PubMed] [Google Scholar]
- 8. Hwang TS,, Jia Y,, Gao SS,, et al. Optical coherence tomography angiography features of diabetic retinopathy. Retina (Philadelphia, Pa). 2015; 35: 2371–2376. [DOI] [PMC free article] [PubMed] [Google Scholar]
- 9. Kuehlewein L,, Tepelus TC,, An L,, Durbin MK,, Srinivas S,, Sadda SR. Noninvasive visualization and analysis of the human parafoveal capillary network using swept source OCT optical microangiography human parafoveal capillary network analysis. Invest Ophthalmol Vis Sci. 2015; 56: 3984–3988. [DOI] [PubMed] [Google Scholar]
- 10. Kim DY,, Fingler J,, Zawadzki RJ,, et al. Noninvasive imaging of the foveal avascular zone with high-speed, phase-variance optical coherence tomography. Invest Ophthalmol Vis Sci. 2012; 53: 85–92. [DOI] [PMC free article] [PubMed] [Google Scholar]
- 11. Ishibazawa A,, Nagaoka T,, Takahashi A,, et al. Optical coherence tomography angiography in diabetic retinopathy: a prospective pilot study. Am J Ophthalmol. 2015; 160: 35–44. [DOI] [PubMed] [Google Scholar]
- 12. Spaide RF. Volume-rendered optical coherence tomography of diabetic retinopathy pilot study. Am J Ophthalmol. 2015; 160: 1200–1210. [DOI] [PubMed] [Google Scholar]
- 13. Matsunaga DR,, Yi JJ,, Koo LOD,, Ameri H,, Puliafito CA,, Kashani AH. Optical coherence tomography angiography of diabetic retinopathy in human subjects. Ophthalmic Surg Lasers Imaging Retina. 2015; 46: 796–805. [DOI] [PubMed] [Google Scholar]
- 14. Zhang M,, Hwang TS,, Campbell JP,, et al. Projection-resolved optical coherence tomographic angiography. Biomed Optics Express. 2016; 7: 816–828. [DOI] [PMC free article] [PubMed] [Google Scholar]
- 15. Hwang TS,, Zhang M,, Bhavsar K,, et al. Projection-resolved optical coherence tomography angiography visualizes capillary nonperfusion in three distinct retinal plexuses in diabetic retinopathy. JAMA Ophthalmol. In press. [DOI] [PMC free article] [PubMed]
- 16. Kurokawa K,, Sasaki K,, Makita S,, Hong Y-J,, Yasuno Y. Three-dimensional retinal and choroidal capillary imaging by power Doppler optical coherence angiography with adaptive optics. Opt Express. 2012; 20: 22796–22812. [DOI] [PubMed] [Google Scholar]
- 17. Wilkinson CP,, Ferris FL, III,, Klein RE,, et al. Proposed international clinical diabetic retinopathy and diabetic macular edema disease severity scales. Ophthalmology. 2003; 110: 1677–1682. [DOI] [PubMed] [Google Scholar]
- 18. Jia Y,, Tan O,, Tokayer J,, et al. Split-spectrum amplitude-decorrelation angiography with optical coherence tomography. Optics Express. 2012; 20: 4710–4725. [DOI] [PMC free article] [PubMed] [Google Scholar]
- 19. Gao SS,, Liu G,, Huang D,, Jia Y. Optimization of the split-spectrum amplitude-decorrelation angiography algorithm on a spectral optical coherence tomography system. Optics Lett. 2015; 40: 2305–2308. [DOI] [PMC free article] [PubMed] [Google Scholar]
- 20. Liu L,, Jia Y,, Takusagawa HL,, et al. Optical coherence tomography angiography of the peripapillary retina in glaucoma. JAMA Ophthalmol. 2015; 133: 1045–1052. [DOI] [PMC free article] [PubMed] [Google Scholar]
- 21. Kraus MF,, Potsaid B,, Mayer MA,, et al. Motion correction in optical coherence tomography volumes on a per A-scan basis using orthogonal scan patterns. Biomed Optics Express. 2012; 3: 1182–1199. [DOI] [PMC free article] [PubMed] [Google Scholar]
- 22. Kraus MF,, Liu JJ,, Schottenhamml J,, et al. Quantitative 3D-OCT motion correction with tilt and illumination correction, robust similarity measure and regularization. Biomed Optics Express. 2014; 5: 2591–2613. [DOI] [PMC free article] [PubMed] [Google Scholar]
- 23. Zhang M,, Wang J,, Pechauer AD,, et al. Advanced image processing for optical coherence tomographic angiography of macular diseases. Biomed. Optics Express 2015; 6: 4661–4675. [DOI] [PMC free article] [PubMed] [Google Scholar]
- 24. Snodderly DM,, Weinhaus RS,, Choi J. Neural-vascular relationships in central retina of macaque monkeys (Macaca fascicularis). J Neurosci. 1992; 12: 1169–1193. [DOI] [PMC free article] [PubMed] [Google Scholar]
- 25. Snodderly DM,, Weinhaus RS. Retinal vasculature of the fovea of the squirrel monkey, Saimiri sciureus: three-dimensional architecture, visual screening and relationships to the neuronal layers. J Comp Neurol. 1990; 297: 145–163. [DOI] [PubMed] [Google Scholar]
- 26. Gariano RF,, Iruela-Arispe ML,, Hendrickson AE. Vascular development in primate retina: comparison of laminar plexus formation in monkey and human. Invest Ophthalmol Vis Sci. 1994; 35: 3442–3455. [PubMed] [Google Scholar]
- 27. Chan G,, Balaratnasingam C,, Yu PK,, et al. Quantitative morphometry of perifoveal capillary networks in the human retina. Invest Ophthalmol Vis Sci. 2012; 53: 5502–5514. [DOI] [PubMed] [Google Scholar]
- 28. Tan PEZ,, Yu PK,, Balaratnasingam C,, et al. Quantitative confocal imaging of the retinal microvasculature in the human retina. Invest Ophthalmol Vis Sci. 2012; 53: 5728–5736. [DOI] [PubMed] [Google Scholar]
- 29. Frangi AF,, Niessen WJ,, Vincken KL,, Viergever MA. Multiscale vessel enhancement filtering. : WM Wells,, Colchester A,, Delp S. Medical Image Computing and Computer-Assisted Interventation—MICCAI'98: First International Conference. Berlin: Springer; 1998: 130–137. [Google Scholar]
- 30. Fraz MM,, Remagnino P,, Hoppe A,, et al. Blood vessel segmentation methodologies in retinal images: a survey. Comput Methods Program Biomed. 2013; 108: 407–433. [DOI] [PubMed] [Google Scholar]
- 31. Sofka M,, Stewart CV. Retinal vessel centerline extraction using multiscale matched filters confidence and edge measures. IEEE Trans Med Imag. 2006; 25: 1531–1546. [DOI] [PubMed] [Google Scholar]
- 32. Zhang HF,, Maslov K,, Li M-L,, Stoica G,, Wang LV. In vivo volumetric imaging of subcutaneous microvasculature by photoacoustic microscopy. Optics Express. 2006; 14: 9317–9323. [DOI] [PubMed] [Google Scholar]
- 33. Zhang A,, Zhang Q,, Wang RK. Minimizing projection artifacts for accurate presentation of choroidal neovascularization in OCT micro-angiography. Biomed Optics Express. 2015; 6: 4130–4143. [DOI] [PMC free article] [PubMed] [Google Scholar]
- 34. Zhang A,, Wang RK. Feature space optical coherence tomography based micro-angiography. Biomed Optics Express. 2015; 6: 1919–1928. [DOI] [PMC free article] [PubMed] [Google Scholar]
- 35. Maurer CR,, Rensheng Q,, Raghavan V. A linear time algorithm for computing exact Euclidean distance transforms of binary images in arbitrary dimensions. IEEE Trans Pattern Anal Mach Intell. 2003; 25: 265–270. [Google Scholar]
- 36. Shimizu K,, Ujiie K. Structure of Ocular Vessels. Tokyo, Japan: Igaku-Shoin Medical Publishers; 1978. [Google Scholar]
- 37. Huang D,, Chopra V,, Lu AT-H,, Tan O,, Francis B,, Varma R. Does optic nerve head size variation affect circumpapillary retinal nerve fiber layer thickness measurement by optical coherence tomography? Disc size and RNFL layer thickness measurement by OCT. Invest Ophthalmol Vis Sci. 2012; 53: 4990–4997. [DOI] [PMC free article] [PubMed] [Google Scholar]
- 38. Mansour AM,, Schachat A,, Bodiford G,, Haymond R. Foveal avascular zone in diabetes mellitus. Retina. 1993; 13: 125–128. [DOI] [PubMed] [Google Scholar]
- 39. Bresnick GH,, Condit R,, Syrjala S,, Palta M,, Groo A,, Korth K. Abnormalities of the foveal avascular zone in diabetic retinopathy. Arch Ophthalmol. 1984; 102: 1286–1293. [DOI] [PubMed] [Google Scholar]
- 40. Yanni SE,, Wang J,, Chan M,, et al. Foveal avascular zone and foveal pit formation after preterm birth. Br J Ophthalmol. 2012; 96: 961–966. [DOI] [PubMed] [Google Scholar]
- 41. Silva PS,, Cavallerano JD,, Haddad NMN,, et al. Peripheral lesions identified on ultrawide field imaging predict increased risk of diabetic retinopathy progression over 40 years. Ophthalmology. 2015; 122: 949–956. [DOI] [PubMed] [Google Scholar]


