

Abstract
Piwi interacting (pi)RNAs repress diverse transposable elements in germ cells of Metazoa and are essential for fertility in both invertebrates and vertebrates. The precursors of piRNAs are transcribed from distinct genomic regions, the so-called piRNA clusters, however, how piRNA clusters are differentiated from the rest of the genome is not known. To address this question we studied piRNA biogenesis in two D. virilis strains that show differential ability to generate piRNAs from several genomic regions. We found that active piRNA biogenesis correlates with high levels of histone 3 lysine 9 trimethylation (H3K9me3) over genomic regions that give rise to piRNAs. Furthermore, piRNA biogenesis in the progeny requires the trans-generational inheritance of an epigenetic signal, presumably in the form of homologous piRNAs that are generated in the maternal germline and deposited into the oocyte. The inherited piRNAs enhance piRNA biogenesis through the installment of H3K9me3 on piRNA clusters.
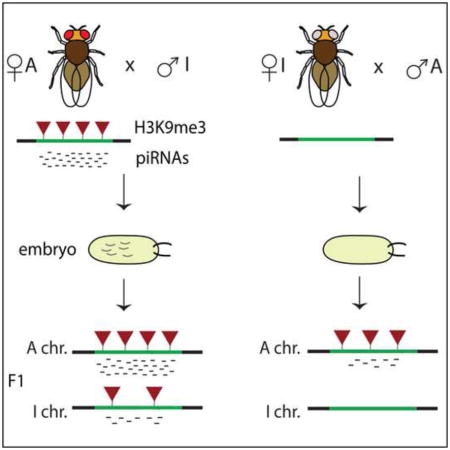
Graphical Abstract
INTRODUCTION
A distinct class of small RNAs called Piwi interacting RNAs or piRNAs provides sequence-specificity for the recognition and repression of a diverse set of invasive genetic elements in the germline of metazoans (Aravin et al., 2007, Siomi et al., 2011). piRNAs are loaded into members of the Piwi clade of Argonaute proteins. Piwi/piRNA complexes in Drosophila repress transposable elements through two different mechanisms. In the nucleus, piRNAs associated with PIWI are responsible for the deposition of the H3K9me3 on homologous transposon targets (Le Thomas et al., 2013, Rozhkov et al., 2013, Sienski et al., 2012). In the cytoplasm, two other Piwi proteins, AUB and AGO3, are guided by the associated piRNAs to cleave and destroy homologous transposon transcripts using their endonuclease activity. Simultaneously, the cleavage of complementary transcripts by AUB and AGO3 also leads to the biogenesis of new piRNAs (Brennecke et al., 2007).
The proper selection of RNA molecules to be processed into mature piRNAs is critical for generating the diverse repertoire of piRNAs that guide effective silencing of transposable elements. The genomic regions that give rise to piRNAs, the piRNA clusters, define the repertoire of elements that are recognized and silenced. However, how piRNA clusters are differentiated from the rest of the genome is not known. piRNAs are distinct from other classes of small RNAs, such as miRNA and siRNA, which are channeled into their respective biogenesis pathways by the distinct secondary structure of their precursors (Kim et al., 2009). In contrast, no structural or sequence motifs have been identified in piRNA precursors in Drosophila. In fact, any sequence inserted into piRNA clusters is processed into mature piRNAs (Muerdter et al., 2012, Todeschini et al., 2010). In a recent breakthrough study, de Vansay and colleagues showed that piRNAs derived from a transgenic locus are able to induce de novo piRNA biogenesis at a homologous locus originally incapable to generate piRNAs (de Vanssay et al., 2012), yet the mechanisms behind this phenomenon remained unclear.
Several studies have suggested that piRNA clusters in Drosophila possess a distinct chromatin structure that is important for piRNA biogenesis. Indeed, piRNA clusters expressed in D. melanogaster germ cells are enriched for H3K9me3 (Rangan et al., 2011). They are also enriched for heterochromatin protein 1 (HP1) (Moshkovich and Lei, 2010) and its germline specific paralog, Rhino (Klattenhoff et al., 2009), which have chromodomains capable of binding to H3K9me3 (Le Thomas et al., 2014). Furthermore, deficiency in the histone methyltransferase Eggless/SETDB1, which is responsible for deposition of the H3K9me3 mark, and Rhino leads to the loss of piRNAs in germ cells (Rangan et al., 2011, Klattenhoff et al., 2009).
Here we built upon our previous finding of two Drosophila virilis strains that show differential capacity to generate piRNAs from several genomic loci (Rozhkov et al., 2010) in order to understand the genetic and epigenetic requirements for piRNA biogenesis. We found that piRNA biogenesis positively correlates with the level of H3K9me3 on genomic loci. Furthermore, maternally inherited epigenetic factors, likely piRNAs, are necessary for the maintenance of high H3K9me3 levels on homologous loci in the progeny.
RESULTS
To understand the determinants of piRNA cluster activity and identify the features that discriminate piRNA-generating regions from other genomic loci we took advantage of our previous finding of piRNA clusters that are differentially active in two D. virilis strains (Rozhkov et al., 2010). Three genomic regions designated as clusters #1, #2, and #3 are present in the genomes of both strains 9 and 160, yet piRNAs are only generated from these clusters in strain 160 (we will refer to strain 160 as the Active or A strain) (Fig. 1, 2A). Strain 9 (the Inactive or I strain) does not have general defects in the piRNA pathway as piRNAs are generated from other genomic regions in this strain. The reason for the differential ability to generate piRNAs from certain genomic regions in the two strains is unknown.
Figure 1. Profiles of the H3K9me3 mark, piRNAs and long RNAs on differentially expressed piRNA clusters.

piRNA, H3K9me3, and long RNA-seq (rRNA-depleted total RNA) densities on cluster #1 in the two D. virilis strains. High H3K9me3 signal is present over the cluster sequence in strain A that generates abundant piRNAs from this region; low H3K9me3 signal and no piRNAs are present in strain I. Only uniquely mappable reads are shown, resulting in the gap in read-density over a recent and non-divergent repetitive element (LTR retrotransposon) insertion. Unique-mappability tracks for 25-bp and 50-bp long reads are shown in gray. piRNAs mapping to the forward (“+”) and reverse (“−”) strand are shown in green and red, respectively.
See also Table S4.
Figure 2. Enrichment of H3K9me3 on piRNA clusters correlates with increased transcription and piRNA generation.

(A) Differential expression of piRNA clusters in the two D. virilis strains. Clusters #1, #2, and #3 generate large numbers of piRNAs in strain A, but are inactive in strain I. Cluster #4 shows similar piRNA levels in both strains. Only the 5′ portion of cluster 1, which does not contain protein-coding sequences (marked on Fig. 1), was used for quantification (here and in subsequent analyses).
(B) Production of piRNAs correlates with H3K9me3 levels. Clusters #1, #2, and #3 have high levels of H3K9me3 in strain A and low levels in strain I; cluster #4 has similar levels of H3K9me3 in both strains as measured by ChIP-seq. An independent biological replicate for this experiment is shown in Figure S1A.
(C) RNA polymerase II density over piRNA clusters in the two strains as measured by ChIP-seq. Clusters #1, #2, and #3 have higher RNA Pol II density in strain A, while cluster #4 shows similar levels of RNA Pol II signal in both strains. As cluster #1 contains a protein-coding gene only sequences coming from the regions not overlapping with the gene were considered. An independent biological replicate for this experiment is shown in Figure S1B.
(D) Long RNA expression from piRNA clusters in the two strains as measured by RNA-seq on rRNA-depleted total RNA. Clusters #1, #2, and #3 generate more transcripts in strain A than in strain I; levels were similar in the two strains for cluster #4. For panels B–D cluster genomic regions were divided into 200 bp windows, a sequencing-depth normalized RPM (Reads Per Million) score was calculated for each window and the distribution of values was plotted. The Mann-Whitney U test was used to calculate the p-values and evaluate the significance of the observed differences.
See also Figures S1, and S2, and Table S4.
Recent studies revealed that two chromatin factors, SETDB1, a methyltransferase responsible for installation of H3K9me3, and the HP1 paralog Rhino that binds this mark are required for piRNA biogenesis in D. melanogaster (Klattenhoff et al., 2009, Rangan et al., 2011). We hypothesized that a difference in the chromatin state of the genomic regions in strains A and I might explain their differential ability to produce piRNAs. To determine whether chromatin state plays a role in the differential activity of the piRNA clusters, we profiled H3K9me3 in ovaries from flies of both strains. For each strain, ChIP-seq libraries from two independent biological samples were generated, sequenced and analyzed. Genomic regions that generate piRNAs exclusively in strain A (clusters #1-3) had significantly higher levels of H3K9me3 in this strain compared to strain I (Fig. 1, 2A, B, S1A). In contrast, cluster #4, which produced a similar amount of piRNAs in both strains, had comparable levels of H3K9me3 (Fig. 2A, B, S1A). The H3K9me3 profile on piRNA clusters in strain A closely parallels the profile of piRNA generation: both signals drop at the same genomic position (Fig. 1). Therefore, the activity of native piRNA-generating regions in D. virilis correlates with high levels of the H3K9me3 mark for all three differentially expressed clusters.
To understand how H3K9me3 affects the activity of piRNA-generating loci, we used ChIP-seq to profile genome-wide RNA polymerase II occupancy and RNA-seq to measure transcript levels in ovaries from strains A and I. We found that high H3K9me3 levels on differentially expressed clusters in strain A correlated with high occupancy of RNA polymerase II on these regions (Fig. 2C, S1B). Furthermore, the piRNA clusters gave rise to more precursor transcripts in strain A than in strain I, indicating that the enrichment of Pol II at these sites represents polymerase engaged in active transcription (Fig. 2D, S2). Together, these results suggest that high level of H3K9me3 on piRNA clusters correlates with the generation of precursor transcripts for piRNA processing.
To further understand the properties of genomic regions that generate piRNAs we studied the activity of piRNA clusters in the progeny of the cross between strains A and I. The cross between the two strains can be performed in two different directions: the progeny of the cross between strain A females and strain I males was designated as MD (for Maternal Deposition) as the A chromosomes and corresponding piRNAs are inherited from the mothers (Fig. 3A). In the progeny of the opposite cross, designated as NMD (for No Maternal Deposition), the A chromosomes are inherited from the fathers and no cognate piRNAs are inherited. Importantly, the genotypes of MD and NMD progeny are absolutely identical.
Figure 3. The effect of trans-generational epigenetic signal on the ping-pong piRNA processing.

(A) Scheme of the cross between A and I strains along with the chromatin status and piRNA levels at differentially expressed clusters in the parental strains. The level of H3K9me3 mark (red triangle) and piRNA abundance for the parental strains are shown in the gray box.
(B) Trans-generational inheritance of piRNAs from the mother leads to increased piRNA generation in the progeny. Expression of piRNAs in MD progeny (female A crossed to male I) that inherited piRNAs derived from clusters #1, #2, and #3 from their mothers and NMD progeny (female I crossed to male A) that did not inherit these piRNAs.
(C) The fraction of piRNAs in ping-pong pairs is higher in MD progeny than in NMD progeny. piRNA density on a 500-bp fragment of cluster #1 shows higher numbers of ping-pong pairs in the MD progeny than in the NMD progeny. Shown are individual piRNA reads with reads in ping-pong pairs on the forward and reverse strand in red and blue, respectively.
(D) Trans-generational epigenetic signal enhances the ping-pong amplification cycle in the progeny as indicated by the higher abundance of ping-pong pairs in MD compared to NMD progeny. To determine the fraction of piRNAs that participate in ping-pong pairs uniquely mapped piRNA reads that mapped to opposite strands of each other and have a 10 bp distance between their 5′ ends were counted. To account for variable sequencing depth and for the different number of reads over each cluster in different samples, we carried out the analysis by sampling reads to ~25% of the read counts in the library with the fewest reads in a region and repeating this 1000 times (see Material & Methods for details).
See also Table S4.
Profiling of piRNAs in ovaries of MD and NMD flies showed that similar amounts of piRNAs were generated from cluster #4, which is equally expressed in both parental strains (Fig. 3B). Surprisingly, ~3-fold more piRNAs were generated from the three differentially active clusters in MD compared to NMD progeny. As the genotypes of MD and NMD progeny are identical, this result indicates that the trans-generational inheritance of an epigenetic signal that is transmitted from the mothers to their progeny enhances the ability to generate piRNAs.
One mechanism of piRNA biogenesis involves the ping-pong amplification loop. In the ping-pong loop, piRNAs guide cleavage of complementary targets leading to the generation of new piRNAs from the cleaved product (Brennecke et al., 2007, Gunawardane et al., 2007, Olovnikov and Kalmykova, 2013). These secondary piRNAs belong to complementary piRNA pairs with a 10-nt overlap between their 5′ ends (so called ping-pong pairs). In the MD progeny, the majority of piRNA sequences coming from clusters 1-3 can form pairs with a 10-nt overlap between their 5′ ends (Fig. 3C). In contrast, only a small fraction of piRNAs form ping-pong pairs in the NMD progeny. It must be noted however that, because of limited sequencing depth, this fraction underestimates the real proportion of secondary piRNAs, especially for the piRNA pairs that produce few reads of one partner. In an attempt to account for the different number of sequences derived from differentially-expressed clusters in MD and NMD progenies, we sampled the same number of reads from each library and calculated the fraction of reads in ping-pong pairs a thousand times. A similar proportion of secondary piRNAs was detected in strain A and in the MD progeny; however, the fraction of piRNAs forming ping-pong pairs in clusters #1, #2, and #3 was dramatically reduced in the NMD progeny, compared to the fraction in the MD progeny (Fig. 3D). A similar fraction of piRNAs mapping to cluster #4 formed ping-pong pairs in strain A and in both the MD and the NMD progeny, indicating that the ping-pong machinery was intact in both progenies. These data suggest that an epigenetic signal inherited by MD progeny from their mothers eventually boosts the biogenesis of secondary piRNAs.
Next, we studied the chromatin state of differentially active clusters in MD and NMD progenies. We compared the levels of H3K9me3 using separate ChIP-qPCR and ChIP-seq experiments performed on two independent biological samples of MD and NMD ovaries (Fig. 4A, S4). In both progenies H3K9me3 levels over the clusters were intermediate between the strong and weak enrichment seen in strain A and strain I, respectively. Importantly, both methods show that H3K9me3 enrichment was higher in ovaries of MD compared to NMD flies indicating that the maternally supplied epigenetic signal affects chromatin of piRNA clusters in the progeny (Fig. 4A, S4).
Figure 4. The effect of trans-generational epigenetic signal on the activity and the chromatin state of piRNA clusters.

(A) Trans-generational epigenetic signal leads to increase in H3K9me3 levels on piRNA clusters in the progeny. The input-normalized H3K9me3 signal as measured by ChIP-qPCR is higher in the MD progeny compared to the NMD progeny. ChIP-qPCR signals were normalized to respective inputs and compared to signal at a control genomic region located inside cluster #4 (scaffold_12823:176535–176654). The levels of H3K9me3 on the same clusters measured by ChIP-seq performed on two independent biological samples are shown in Figure S4.
(B) Maternally inherited piRNAs lead to an increase in H3K9me3 levels on both the paternal and maternal alleles in the progeny. H3K9me3 ChIP-seq data was mapped to the heterozygous genome of the cross between A and I, considering only reads that could be unambiguously mapped to either the I or the A genome (see Methods for details). For each cluster the H3K9me3 levels are normalized to the signal on allele A in the MD cross. For both the I and the A chromosomes, H3K9me3 levels over the differentially expressed clusters increase when cognate piRNAs are inherited (MD vs. NMD progeny). At the same time each parental chromosome preserves its distinct chromatin state in the progeny: H3K9me3 levels are higher on the parental chromosome coming from strain A than on the one coming from strain I. The error bars represent the standard deviation of the mean between two independent biological replicates.
(C) Inheritance of piRNAs boosts piRNA production from both parental chromosomes in the progeny. piRNA density on each chromosome was determined by mapping reads to the heterozygous genome of the cross between A and I, considering only reads that could be unambiguously mapped to either the I or the A genome. For each cluster the number of piRNAs are normalized to the piRNA derived from allele A in MD cross. For each differentially expressed cluster, more piRNAs are produced from each allele when piRNAs are maternally inherited (MD vs. NMD progeny). Importantly, inheritance of piRNAs activates piRNA generation from clusters that were inactive in the parental I strain (solid light blue vs. dark blue bars).
(D) The profiles of piRNA derived from A and I chromosomes in MD and NMD progenies on cluster #1. Only reads that mapped to SNPs that are distinct between the genomes of strain A and I are shown. Note that chromosome I generates piRNAs in MD, but not NMD flies. The distribution of SNPs is shown below piRNA tracks.
(E) Scheme of the cross between A and I strains along with the chromatin status (the level of H3K9me3 mark, red triangles) and the piRNA levels of each chromosome in the progeny.
See also Figures S3, and S4, and Tables S1, S3, and S4.
The identical genomes of the MD and the NMD progenies each contain two alleles of differentially active piRNA clusters that have different H3K9me3 levels in their parents, the A and the I strains. To understand the impact of the maternally supplied epigenetic signal on individual alleles, it is critical to differentiate sequences derived from the A and I chromosomes. We therefore carried out whole-genome sequencing of the genomes of both strains and generated 82x and 71x coverage for strains A and I, respectively. Next, we identified single nucleotide polymorphisms (SNPs) for each strain relative to the D. virilis reference genome (see the Methods section for details). We found 326,026 and 1,086,963 SNPs in the genomes of A and I respectively, of which, 169,192 SNPs were shared. A total of 1,074,605 SNPs differed between the genomes of the two strains (average density of 5.19 such SNPs per Kb) allowing us to determine the allelic origin of piRNAs and ChIP-seq reads derived from polymorphic genomic regions. Importantly, we identified such SNPs in each of the differentially expressed piRNA clusters (Table S1). This allowed us to unambiguously map a fraction of the ChIP-seq and piRNA reads to each individual allele (Fig. 4B–D, S5).
We found that the two alleles of differentially expressed piRNA clusters maintained their distinct chromatin states in the hybrid progeny. Levels of H3K9me3 were higher on the A alleles compared to the I alleles in both the MD and the NMD ovaries (Fig. 4B, S5). However, MD progenies had higher levels of H3K9me3 mark on both the A and I alleles. This result indicates that maternally inherited epigenetic signal in MD flies causes an increase in H3K9 methylation on the I alleles. Importantly, the increase in H3K9me3 signal on the I alleles in the MD progeny correlated with the induction of piRNA generation from these alleles, whereas no piRNAs were generated from the I alleles in the NMD flies (Fig. 4C–D). Therefore, trans-generational inheritance of an epigenetic signal correlates with deposition of the H3K9me3 mark and induction of piRNA generation from previously inactive genomic loci (Fig. 4E).
DISCUSSION
Our results reveal an essential role for a trans-generationally inherited epigenetic factor in generation of piRNAs in germ cells of D. virilis. This maternally inherited factor is required to maintain the high level of piRNA generation from active piRNA clusters. Furthermore, it is able to activate previously naive loci on I chromosomes. These findings parallel the study by de Vanssay and colleagues who showed that a maternally inherited factor produced by a transgenic piRNA locus is able to activate piRNA generation from a previously inactive homologous locus in D. melanogaster (de Vanssay et al., 2012). Multiple lines of evidence point to piRNAs themselves as the carriers of the epigenetic signal that triggers piRNA generation from homologous loci in the progeny. First, in Drosophila both piRNAs and Piwi proteins are inherited from the maternal germline to the early embryos (Brennecke et al., 2008). Second, piRNAs can serve as sequence-specific guides to identify and activate homologous loci. Recent studies have shown that piRNAs and the nuclear Piwi protein trigger installation of the H3K9me3 mark on homologous targets providing a possible mechanism by which inherited piRNAs could lead to chromatin changes (Le Thomas et al., 2013, Rozhkov et al., 2013, Sienski et al., 2012, Wang and Elgin, 2011). Finally, the study of a similar phenomenon in D. melanogaster showed that the epigenetic signal produced by the transgenic piRNA locus does not require inheritance of the locus itself (de Vanssay et al., 2012). This result indicates that the epigenetic signal has a non-chromosomal nature and eliminates the possibility that it is carried by a chromatin mark linked to the active locus. Our results, together with these previous studies, strongly support the role of inherited piRNAs as a trans-generationally inherited epigenetic signal that activates piRNA generation from homologous loci in the progeny.
Trans-generationally inherited piRNAs activate piRNA generation in a nuclear process that is linked to the deposition of H3K9me3 on homologous genomic regions. We found that acquisition of the H3K9me3 mark by genomic regions that did not previously produce piRNAs correlates with initiation of piRNA biogenesis (Fig. 4). In contrast, absence of inherited piRNAs leads to a decrease in H3K9me3 levels on homologous regions and a concomitant decrease in the corresponding piRNAs (Fig. 4). These results suggest that modification of the chromatin structure of genomic regions homologous to inherited piRNAs induces piRNA biogenesis in the progeny. In agreement with our results, previous studies have shown that the biogenesis of piRNAs in D. melanogaster requires the activity of Eggless/SETDB1, one of the methyl-transferases carrying out the trimethylation of H3K9 (Rangan et al., 2011) and of Rhino, the HP1 homolog, that is enriched over piRNA clusters (Klattenhoff et al., 2009, Zhang et al., 2014). Rhino has a chromodomain that is similar to the chromodomain of HP1, and binds the H3K9me3 mark (Le Thomas et al., 2014, Mohn et al., 2014).
The exact molecular mechanism by which the H3K9me3 mark is linked to piRNA biogenesis in the nucleus remains to be elucidated, however, our results suggest that, counterintuitively, high levels of H3K9me3 correlate with elevated transcription in the context of piRNA clusters. Indeed we found that high levels of H3K9me3 on differentially expressed piRNA clusters in D. virilis correlated with increased Pol II occupancy and with the generation of more precursor transcripts (Fig. 1, 2). Therefore, we propose that changes in chromatin state associated with high levels of H3K9me3 lead to the recruitment of non-conventional readers of this mark such as Rhino, which subsequently affect transcription in these regions, providing more precursors for piRNA biogenesis. Overall, our data revealed that the determination of a piRNA producing loci in D. virilis is mediated by the process of the trans-generational epigenetic inheritance.
EXPERIMENTAL PROCEDURES
Drosophila stocks
D. virilis strain 160 (A) and strain 9 (I) were a generous gift from M. Evgeyev.
ChIP and RNA-seq
ChIP experiments were carried out using commercially available antibodies, anti-H3K9me3 (ab8898) and anti-RNA Pol II (ab5408). Ovaries were fixed for 10 min at room temperature using 1% paraformaldehyde (PFA) followed by 5 min quenching by directly adding glycine (final concentration 25mM). A detailed protocol is provided in the Supplemental Experimental Procedures. Quantitative ChIP-PCR (ChIP-qPCR) experiments were performed in at least two biological replicates with two technical replicates each. Error bars represent the standard error of the mean. Primer pairs used in the qPCR experiments are presented in Table S3. ChIP-seq and RNA-seq library construction and sequencing were carried out using standard protocols and sequenced on the Illumina HiSeq 2000 (50-bp reads). Publicly available datasets for piRNAs were extracted from the GEO Short Read Archive GSE22067 (Rozhkov et al., 2010).
Analysis of the ping-pong processing
To determine the fraction of piRNAs that participate in ping-pong pairs we counted uniquely mapped piRNA reads that map to opposite strands of each other, overlap and have a 10 bp distance between their 5′ ends. To account for different number of piRNAs in each sample, we carried out the analysis by sampling reads to ~25% of the read counts in the library with the fewest reads in a region and repeating this 1000-times.
D. virilis genome sequencing and allele-specific mapping
Genomic libraries were generated from each D. virilis strain and sequenced (as 2×100 reads) on an Illumina HiSeq 2000 platform. Sequencing coverage was ~82x for strain A and ~71x for strain I. A detailed protocol for allele-specific mapping is provided in the Supplemental Experimental Procedures. Detailed statistics on the number of SNPs identified genome-wide and in the particular piRNA clusters studied here can be found in Table S1.
Accession codes
High-throughput sequencing data for ChIP-seq and RNA-seq experiments are available through the Gene Expression Omnibus (accession no. GSE59965).
Supplementary Material
Figure S1. H3K9me3 and RNA pol II occupancy over piRNA clusters in parental strains and MD and NMD progenies, Related to Figure 2.
(A) H3K9me3 over piRNA clusters in strains A and I as measured by ChIP-seq (an independent biological replicate for the experiment is shown in Figure 2B). Clusters were divided into 200 bp windows, a sequencing-depth normalized RPM (Reads Per Million) score was calculated for each window, and the distribution of the values was plotted. The Mann-Whitney U test was used to calculate the p-values and evaluate the significance of the observed differences.
(B) RNA polymerase II density over piRNA clusters in the two strains as measured by ChIP-seq (an independent biological replicate for the experiment is shown in Figure 2C).
Figure S2. RNA-Seq profiles on the cdi gene present in cluster 1, Related to Figure 2.
Production of piRNAs in strain A correlates with a higher level of RNA-Seq signal in the intron regions (IR) as well as in downstream sequences (NGR) of the cdi gene. In contrast, RNA-Seq levels at exons (ER1-3) are higher in strain I that does not generate piRNAs from this region.
Figure S3. H3K9me3 over piRNA clusters in NM and NMD progenies, Related to Figure 4.
The levels of H3K9me3 over piRNA clusters were measured by ChIP-seq on two independent biological samples. The input-normalized H3K9me3 signal is higher in the MD progeny compared to the NMD progeny. H3K9me3 levels on cluster #4, which is equally active in the two strains, are unchanged in the progeny. Clusters were divided into 200 bp windows, a sequencing-depth normalized RPM (Reads Per Million) score was calculated for each window, and the distribution of the values was plotted. The Mann-Whitney U test was used to calculate the p-values and evaluate the significance of the observed differences.
Figure S4. piRNA and H3K9me3 density over SNPs in cluster #1 in MD and NMD progenies, Related to Figure 4.
A higher level of piRNAs and H3K9me3 density is observed over the cluster sequence in strain MD at each chromosome versus strain NMD. Only reads that mapped to SNPs that are distinct between the genomes of A and I strains are shown.
Table S1. SNPs identified in genomes of strains A and I, Related to Figure 4.
Table S2. Read mapping statistics, Related to Experimantal Procedures.
Table S3. qPCR primers, Related to Figure 4.
Table S4. piRNA cluster coordinates, Related to Figures 1, 2, 3 and 4.
Acknowledgments
We thank Katalin Fejes Toth and members of the Aravin lab for discussion. This work was supported by grants from the National Institutes of Health (R01 GM097363, and DP2 OD007371A) and by the Damon Runyon-Rachleff, the Searle Scholar and the Packard Fellowship Awards to A.A.A.
Footnotes
Author Contributions
A.L.T. performed the experiments, G.M. analyzed the data, and A.L.T, G.M. and A.A.A. interpreted the data and wrote the manuscript.
Publisher's Disclaimer: This is a PDF file of an unedited manuscript that has been accepted for publication. As a service to our customers we are providing this early version of the manuscript. The manuscript will undergo copyediting, typesetting, and review of the resulting proof before it is published in its final citable form. Please note that during the production process errors may be discovered which could affect the content, and all legal disclaimers that apply to the journal pertain.
References
- ARAVIN A, HANNON G, BRENNECKE J. The Piwi-piRNA pathway provides an adaptive defense in the transposon arms race. Science (New York, NY) 2007;318:761–764. doi: 10.1126/science.1146484. [DOI] [PubMed] [Google Scholar]
- BRENNECKE J, ARAVIN A, STARK A, DUS M, KELLIS M, SACHIDANANDAM R, HANNON G. Discrete small RNA-generating loci as master regulators of transposon activity in Drosophila. Cell. 2007;128:1089–1103. doi: 10.1016/j.cell.2007.01.043. [DOI] [PubMed] [Google Scholar]
- BRENNECKE J, MALONE C, ARAVIN A, SACHIDANANDAM R, STARK A, HANNON G. An epigenetic role for maternally inherited piRNAs in transposon silencing. Science (New York, NY) 2008;322:1387–1392. doi: 10.1126/science.1165171. [DOI] [PMC free article] [PubMed] [Google Scholar]
- DE VANSSAY A, BOUGÉ AL, BOIVIN A, HERMANT C, TEYSSET L, DELMARRE V, ANTONIEWSKI C, RONSSERAY S. Paramutation in Drosophila linked to emergence of a piRNA-producing locus. Nature. 2012;490:112–115. doi: 10.1038/nature11416. [DOI] [PubMed] [Google Scholar]
- GUNAWARDANE L, SAITO K, NISHIDA K, MIYOSHI K, KAWAMURA Y, NAGAMI T, SIOMI H, SIOMI M. A slicer-mediated mechanism for repeat-associated siRNA 5′ end formation in Drosophila. Science (New York, NY) 2007;315:1587–1590. doi: 10.1126/science.1140494. [DOI] [PubMed] [Google Scholar]
- KIM V, HAN J, SIOMI M. Biogenesis of small RNAs in animals. Nature reviews. Molecular cell biology. 2009;10:126–139. doi: 10.1038/nrm2632. [DOI] [PubMed] [Google Scholar]
- KLATTENHOFF C, XI H, LI C, LEE S, XU J, KHURANA J, ZHANG F, SCHULTZ N, KOPPETSCH B, NOWOSIELSKA A, SEITZ H, ZAMORE P, WENG Z, THEURKAUF W. The Drosophila HP1 homolog Rhino is required for transposon silencing and piRNA production by dual-strand clusters. Cell. 2009;138:1137–1149. doi: 10.1016/j.cell.2009.07.014. [DOI] [PMC free article] [PubMed] [Google Scholar]
- LE THOMAS A, ROGERS AK, WEBSTER A, MARINOV GK, LIAO SE, PERKINS EM, HUR JK, ARAVIN AA, TOTH KF. Piwi induces piRNA-guided transcriptional silencing and establishment of a repressive chromatin state. Genes Dev. 2013;27:390–9. doi: 10.1101/gad.209841.112. [DOI] [PMC free article] [PubMed] [Google Scholar]
- LE THOMAS A, STUWE E, LI S, DU J, MARINOV G, ROZHKOV N, CHEN Y-CA, LUO Y, SACHIDANANDAM R, FEJESTOTH K, PATEL D, ARAVIN AA. Transgenerationally inherited piRNAs trigger piRNA biogenesis by changing the chromatin of piRNA clusters and inducing precursor processing. Genes & development. 2014:28. doi: 10.1101/gad.245514.114. [DOI] [PMC free article] [PubMed] [Google Scholar]
- MOHN F, SIENSKI G, HANDLER D, BRENNECKE J. The rhino-deadlock-cutoff complex licenses noncanonical transcription of dual-strand piRNA clusters in Drosophila. Cell. 2014;157:1364–79. doi: 10.1016/j.cell.2014.04.031. [DOI] [PubMed] [Google Scholar]
- MOSHKOVICH N, LEI E. HP1 recruitment in the absence of argonaute proteins in Drosophila. PLoS genetics. 2010:6. doi: 10.1371/journal.pgen.1000880. [DOI] [PMC free article] [PubMed] [Google Scholar]
- MUERDTER F, OLOVNIKOV I, MOLARO A, ROZHKOV N, CZECH B, GORDON A, HANNON G, ARAVIN A. Production of artificial piRNAs in flies and mice. RNA (New York, NY) 2012;18:42–52. doi: 10.1261/rna.029769.111. [DOI] [PMC free article] [PubMed] [Google Scholar]
- OLOVNIKOV IA, KALMYKOVA AI. piRNA clusters as a main source of small RNAs in the animal germline. 2013;78:572–584. doi: 10.1134/S0006297913060035. [DOI] [PubMed] [Google Scholar]
- RANGAN P, MALONE C, NAVARRO C, NEWBOLD S, HAYES P, SACHIDANANDAM R, HANNON G, LEHMANN R. piRNA production requires heterochromatin formation in Drosophila. Current biology : CB. 2011;21:1373–1379. doi: 10.1016/j.cub.2011.06.057. [DOI] [PMC free article] [PubMed] [Google Scholar]
- ROZHKOV N, ARAVIN A, ZELENTSOVA E, SCHOSTAK N, SACHIDANANDAM R, MCCOMBIE W, HANNON G, EVGEN’EV M. Small RNA-based silencing strategies for transposons in the process of invading Drosophila species. RNA (New York, NY) 2010;16:1634–1645. doi: 10.1261/rna.2217810. [DOI] [PMC free article] [PubMed] [Google Scholar]
- ROZHKOV N, HAMMELL M, HANNON G. Multiple roles for Piwi in silencing Drosophila transposons. Genes & development. 2013;27:400–412. doi: 10.1101/gad.209767.112. [DOI] [PMC free article] [PubMed] [Google Scholar]
- SIENSKI G, DÖNERTAS D, BRENNECKE J. Transcriptional silencing of transposons by piwi and maelstrom and its impact on chromatin state and gene expression. Cell. 2012;151:964–980. doi: 10.1016/j.cell.2012.10.040. [DOI] [PMC free article] [PubMed] [Google Scholar]
- SIOMI MC, SATO K, PEZIC D, ARAVIN AA. PIWI-interacting small RNAs: the vanguard of genome defence. Nature reviews. Molecular cell biology. 2011;12:246–258. doi: 10.1038/nrm3089. [DOI] [PubMed] [Google Scholar]
- TODESCHINI A-LL, TEYSSET L, DELMARRE V, RONSSERAY S. The epigenetic trans-silencing effect in Drosophila involves maternally-transmitted small RNAs whose production depends on the piRNA pathway and HP1. PloS one. 2010:5. doi: 10.1371/journal.pone.0011032. [DOI] [PMC free article] [PubMed] [Google Scholar]
- WANG S, ELGIN S. Drosophila Piwi functions downstream of piRNA production mediating a chromatin-based transposon silencing mechanism in female germ line. Proceedings of the National Academy of Sciences of the United States of America. 2011;108:21164–21169. doi: 10.1073/pnas.1107892109. [DOI] [PMC free article] [PubMed] [Google Scholar]
- ZHANG Z, WANG J, SCHULTZ N, ZHANG F, PARHAD SS, TU S, VREVEN T, ZAMORE PD, WENG Z, THEURKAUF WE. The HP1 homolog rhino anchors a nuclear complex that suppresses piRNA precursor splicing. Cell. 2014;157:1353–63. doi: 10.1016/j.cell.2014.04.030. [DOI] [PMC free article] [PubMed] [Google Scholar]
Associated Data
This section collects any data citations, data availability statements, or supplementary materials included in this article.
Supplementary Materials
Figure S1. H3K9me3 and RNA pol II occupancy over piRNA clusters in parental strains and MD and NMD progenies, Related to Figure 2.
(A) H3K9me3 over piRNA clusters in strains A and I as measured by ChIP-seq (an independent biological replicate for the experiment is shown in Figure 2B). Clusters were divided into 200 bp windows, a sequencing-depth normalized RPM (Reads Per Million) score was calculated for each window, and the distribution of the values was plotted. The Mann-Whitney U test was used to calculate the p-values and evaluate the significance of the observed differences.
(B) RNA polymerase II density over piRNA clusters in the two strains as measured by ChIP-seq (an independent biological replicate for the experiment is shown in Figure 2C).
Figure S2. RNA-Seq profiles on the cdi gene present in cluster 1, Related to Figure 2.
Production of piRNAs in strain A correlates with a higher level of RNA-Seq signal in the intron regions (IR) as well as in downstream sequences (NGR) of the cdi gene. In contrast, RNA-Seq levels at exons (ER1-3) are higher in strain I that does not generate piRNAs from this region.
Figure S3. H3K9me3 over piRNA clusters in NM and NMD progenies, Related to Figure 4.
The levels of H3K9me3 over piRNA clusters were measured by ChIP-seq on two independent biological samples. The input-normalized H3K9me3 signal is higher in the MD progeny compared to the NMD progeny. H3K9me3 levels on cluster #4, which is equally active in the two strains, are unchanged in the progeny. Clusters were divided into 200 bp windows, a sequencing-depth normalized RPM (Reads Per Million) score was calculated for each window, and the distribution of the values was plotted. The Mann-Whitney U test was used to calculate the p-values and evaluate the significance of the observed differences.
Figure S4. piRNA and H3K9me3 density over SNPs in cluster #1 in MD and NMD progenies, Related to Figure 4.
A higher level of piRNAs and H3K9me3 density is observed over the cluster sequence in strain MD at each chromosome versus strain NMD. Only reads that mapped to SNPs that are distinct between the genomes of A and I strains are shown.
Table S1. SNPs identified in genomes of strains A and I, Related to Figure 4.
Table S2. Read mapping statistics, Related to Experimantal Procedures.
Table S3. qPCR primers, Related to Figure 4.
Table S4. piRNA cluster coordinates, Related to Figures 1, 2, 3 and 4.