Abstract
Purpose
We describe a novel fully automatic method capable of tracing the subbasal plexus nerves from human corneal confocal images.
Methods
Following an increasing interest in the automatic analysis of corneal nerves, a few approaches have been proposed. These, however, cannot cope with large images, such as mosaics, in due time. The rationale of the proposed method is to minimize required computing time while still providing accurate results. Our method consists of two sequential steps – a thresholding step followed by a supervised classification. For the classification we use a support vector machines (SVM) approach. Initially, a large set of features is computed, which is later reduced using a backward-elimination based on segmentation accuracy. To validate the obtained tracings, we evaluated the tracing accuracy and reliability of extracted clinical parameters (corneal nerves density and tortuosity).
Results
The proposed algorithm proved capable to correctly trace 0.89 ± 0.07 of the corneal nerves. The obtained performance level was comparable to a second human grader. Furthermore, the proposed approach compares favorably to other methods. For both evaluated clinical parameters the proposed approach performed well. An execution time of 0.61 ± 0.07 seconds per image was achieved. The proposed algorithm was applied successfully to mosaic images, with run times of the order of tens of seconds.
Conclusions
The achieved quality and processing time of the proposed method appear adequate for the application of this technique to clinical practice.
Translational Relevance
The automatic tracing of corneal nerves is an important step for the quantitative analysis of corneal nerves in daily clinical practice. The proposed fast technique allows features, such as corneal nerve density and tortuosity, to be computed in a few seconds. The application of nerve tracing to mosaics covering a large area can be a key component in clinical studies aimed at investigating neuropathy influence in various ocular or systemic diseases.
Keywords: corneal nerves, corneal mosaics, image analysis
Introduction
The cornea is known for being one of the most sensitive tissues in the body. Indeed, corneal nerve density is 300 to 400 times higher than in the normal human skin.1 Confocal microscopy is the method of choice to visualize corneal nerves in the subbasal nerve plexus (SNP). The ability to image these structures in vivo in a fast and noninvasive way has revolutionized our understanding of corneal innervation. The increasing interest in the analysis of corneal nerves can be explained by their correlation to possible damage from surgical interventions (e.g., laser-assisted in situ keratomileusis [LASIK] or photorefractive keratectomy [PRK]) or from prolonged wear of contact lens.2–4 Furthermore, it has been shown that some nerve properties, such as nerve density or tortuosity, are linked to systemic diseases, such as diabetes.3–9
The quantitative analysis of corneal nerves still is impractical in the daily clinical practice, due to the difficulty and execution time of manual or semiautomatic processes. A few automatic approaches have been proposed over the years. Scarpa et al.10 applied a fuzzy c-mean clustering technique to classify each pixel as belonging to a nerve or not. More recently, a new multiscale dual-model method to detect the corneal nerves was proposed by Dabbah et al.,7 while Poletti and Ruggeri11 proposed a new approach based on a sparse tracking scheme. Ziegler et al.9 used a minimum-error thresholding method in conjunction with log-Gabor filtering to trace corneal nerves from mosaic images. Studies already have shown the application of these fully automatic approaches.12–14
The main problem of existing corneal segmentation methods is their execution time (hundreds of seconds for single images). Recently, there has been a particular increase of interest in the analysis of mosaics covering a large area, instead of single corneal confocal images.8,14,15 Automatic mosaicking and nerve tracing could be the key to clinical studies aimed at investigating correlations to serious diseases. However, these larger images are computationally challenging and existing methods cannot cope with them in reasonable time. For instance, Ziegler et al.9 report a running time of almost 27 minutes to process a mosaic image with an area of 2.23 × 106 μm2. For these reasons, there is the need for a fast and accurate fully automatic approach to nerve tracing.
Materials and Methods
Throughout this section we describe a novel method for tracing the subbasal plexus nerves from human corneal confocal images and the data used in the validation process. Figure 1 shows the global workflow of the algorithm. Because an automatic approach to nerve tracing must provide accurate tracings and useful clinical parameters, the validation of the proposed algorithm deals with both issues.
Figure 1.
Flowchart representing the global workflow of the algorithm.
Materials
To evaluate the algorithm's performance, the nerve tracings obtained by the proposed automatic approach were compared with reference ground-truths. Furthermore, we evaluated the clinical descriptors of nerve tortuosity and density obtained from the automatic approach against manual measurements. Two different databases were used; both of them are described below.
A total of 246 confocal microscopy images of the subbasal corneal nerve plexus of healthy volunteer subjects were acquired using the Heidelberg Retina Tomograph (HRT-II) with the Rostock Cornea Module (Heidelberg Engineering GmbH, Heidelberg, Germany) at the Ophthalmology Department in the Linköping University, Sweden. The imaging instrument was outfitted with an Achroplan ×63/0.95 NA immersion objective lens (Carl Zeiss SMT GmbH, Oberkochen, Germany) to provide confocal images covering a field of 400 × 400 μm2 (384 × 384 pixels; Fig. 2a). To evaluate the algorithm's performance, the obtained nerve tracings were compared with reference ground-truths. All images from this dataset were segmented manually by two independent clinical graders (G1 and G2), who traced the centerlines of all visible nerves during several sessions over a 2-weeks period. Both graders used the NeuronJ16 tracing plugin for ImageJ (available in the public domain at http://www.imagescience.org/meijering/software/neuronj/; version 1.45s, Rasband, W.S., ImageJ; National Institutes of Health [NIH], Bethesda, MD) over the raw unprocessed images. The intersection between the tracing of G1 and G2 was used as the ground-truth tracing. For sake of convenience this set of images is from now on called database 1 (DB1). This dataset was split randomly into two different subsets, the training (N = 50) and testing (N = 196) subsets.
Figure 2.
From left to right: original (Ior), corrected (ITH), and log-Gabor filtered (I) confocal images, respectively. Scale bar: 30 μm.
To evaluate corneal nerve tortuosity, a publicly available database (database 2 [DB2]) was used (available in the public domain at http://bioimlab.dei.unipd.it/, Laboratory of Biomedical Imaging, University of Padova). The database is composed of a total of 30 confocal images of the subbasal corneal nerve plexus. Images were acquired from healthy (N = 6) and pathologic (N = 24) subjects, using the same protocol as described above. The pathologic group included subjects diagnosed with diabetes (N = 10), pseudoexfoliation syndrome (N = 8), and keratoconus (N = 6). A grader evaluated the corneal nerves tortuosity of each image into three different classes – High, Mid, and Low tortuosity.
Preprocessing
The cornea is a transparent, spherical structure. Typically, confocal corneal images present illumination artefacts of a low-frequency nature. Furthermore, nerves also may appear dimmed due to focus problems, or even appear and disappear along their path (in and out of the focus plane). Other objects, such as bright elongated structures (e.g., cells), also are normally present and may cause false-positives. For these reasons, image and nerve enhancement are essential steps in the process of recovering the corneal nerve tree. In this work, we resort to top-hat filtering and a bank of log-Gabor filters to correct for the aforementioned issues.
The original image (Ior) undergoes first top-hat filtering. This is a simple and effective morphologic operation, commonly used to correct for uneven illumination. It is computed as the difference between image Ior and the result of its morphologic opening. The resulting images (ITH) then are filtered with a bank of 2-D log-Gabor even and odd kernels. Each value in the final enhanced image (I) is defined as the difference between the even and odd maximal filter responses (Ieven and Iodd, respectively).
Log-Gabor filters have been used extensively to enhance and trace line-like structures, for example, blood vessels.17 Each of these filters results from the combination between a radial and an angular component, which limit the filter's frequency (scale) and orientation, respectively. As such, each log-Gabor filter in the bank has an exclusive orientation-scale pairing. Both components are first computed and then multiplied in the frequency space to obtain the frequency domain log-Gabor filter. In the time domain, we obtained the even and the odd kernels as the real and imaginary parts of this filter, respectively.
Figure 2 shows the results of the preprocessing step. As shown, this procedure normalizes the luminosity and greatly improves the contrast of corneal nerves against background.
Nerve Recognition
The recognition of the corneal nerves in the enhanced images is performed in two sequential steps – image I is first thresholded to obtain candidate nerve segments, which then are classified using a supervised classifier. The rationale behind the use of the two sequential steps is to minimize computing time while still aiming at high accuracy.
First, we apply a hysteresis threshold – a popular method for edge detection. The centerline of each resulting thresholded region is considered as a nerve segment. In this way, we obtained candidate nerve segments, which corresponded to linear structures that could be found in the image, but that may or may not be nerves. To distinguish between true or false nerve segments, these were classified using a support vector machines (SVM) approach.
Support vector machines are a widely used supervised-learning method, extensively described in the literature.18,19 In this work, we resorted to a C-support vector classification with a radial–basis–function kernel. The best SVM model and parameters are derived from training. A large set of features is computed to be used by the classification algorithm. The final feature set was selected using a backward-elimination approach, based on the accuracy of the segmentation. This set is described below. Two groups of features can be distinguished, morphologic and intensity-based features.
The SVM classifier was trained using the training subset from DB1 with the ground-truths as reference. The obtained SVM model was used for all the tests.
Morphologic Features
Morphologic features are extracted directly from the binary image, and are related to the shape and size of the candidate nerve segment. The final morphologic features included are the cumulative distance along the segment's path (Length) and the total number of pixels (Area).
Intensity-Based Features
Intensity-based features are computed using filters applied to the confocal images. The features are computed as the average (AVG) and standard deviation (SD) intensity values along each candidate nerve segment's path. The final intensity-based feature set comprises:
Average (AVG) and standard deviation (SD) of Ior, ITH, I, and Ieven;
AVG of Iodd;
AVG and SD of the Laplacian of Gaussian (ILoG) and of the gradient magnitude (IG).
The Laplacian of Gaussian (LoG) filter is a commonly used edge detector. It is computed as the Laplacian of a low-pass filtered image (Gaussian). In this work a multiscale approach was used by convoluting image ITH with several Gaussian filters with different standard deviations. Similarly, the gradient magnitude also was computed at multiple scales as the norm of the gradient of a Gaussian low-pass filtered image ITH. For each of these features, the maximum value across scales weighted by the respective standard deviation of the used Gaussian filters then is selected to obtain ILoG and IG, respectively.
Postprocessing
After nerve recognition by classification, some nerve segments appeared disconnected from the main nerve tree. As a postprocessing step, these segments were connected over small gaps. This step is especially important if one aims to compute clinical parameters, such as tortuosity. For the connection, only the distance, angle, and intensity along the path between the two candidates for connection are considered. Although this is a very simple approach, our tests revealed that the gain obtained by more complex methodologies does not compensate for the additional computational time required.
Results
As aforementioned, an automatic approach to nerve tracing must provide an accurate and robust nerve segmentation, but also reliable and useful clinical parameters. The validation of the proposed approach considers both these issues.
Nerve Tracing
To evaluate the system performance, the obtained nerve tracings were compared to the reference ground-truths for the testing subset of DB1. Nerve tracings are compared pixel by pixel to the respective reference ground-truth. However, the graders were asked to trace the centerlines of the nerves. As such, it is unlikely that different specialists chose exactly the same path to trace a given nerve. For this reason, a tolerance must be set. A true positive is considered as such only if it is within three pixels from the reference ground-truth. Sensitivity (Sen) and false discovery rate (FDR) then were computed. Sensitivity gives the proportion of correctly identified nerves (the higher the better), while FDR gives the proportion of nerves wrongly identified as such (the lower the better). As in a typical image, the vast majority of pixels do not belong to corneal nerves, specificity does not provide useful information.
To allow the comparison to previous approaches, the algorithm proposed by Scarpa et al.10 also was applied to the testing subset and compared to the reference ground-truths. Furthermore, G1 and G2 tracings also were compared between them to establish intergrader variability.
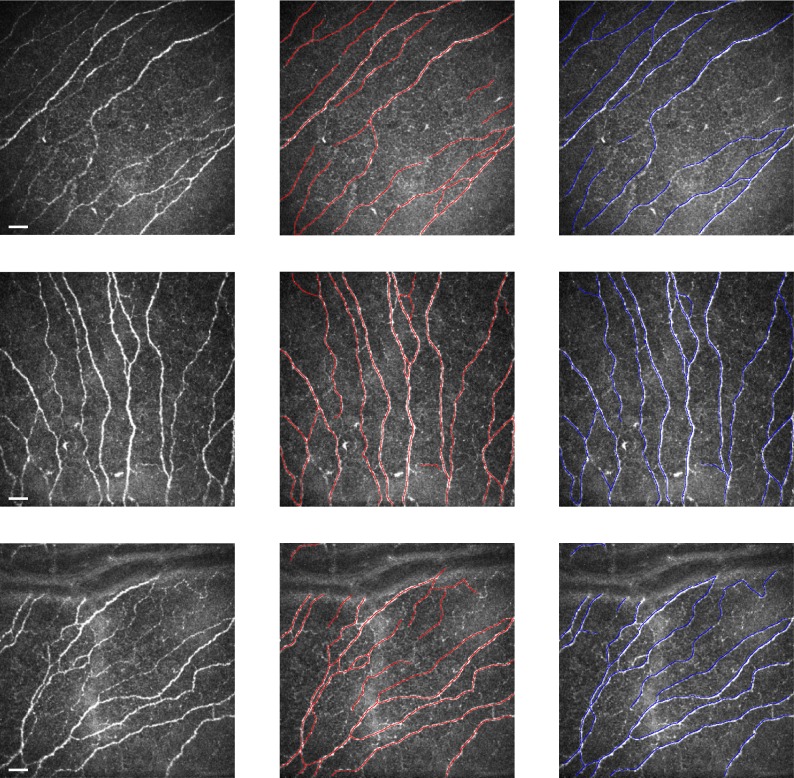
Figure 3 shows some examples for visual inspection. The Table shows the obtained results. Differences between the different tracing approaches were investigated using Student's t-test.
Figure 3.
From left to right: original corneal confocal images, automatic tracing (in red), and ground-truth reference (in blue), respectively, for three representative images. Scale bar: 30 μm.
Table.
Sen and FDR Results (AVG ± SD, N = 196)
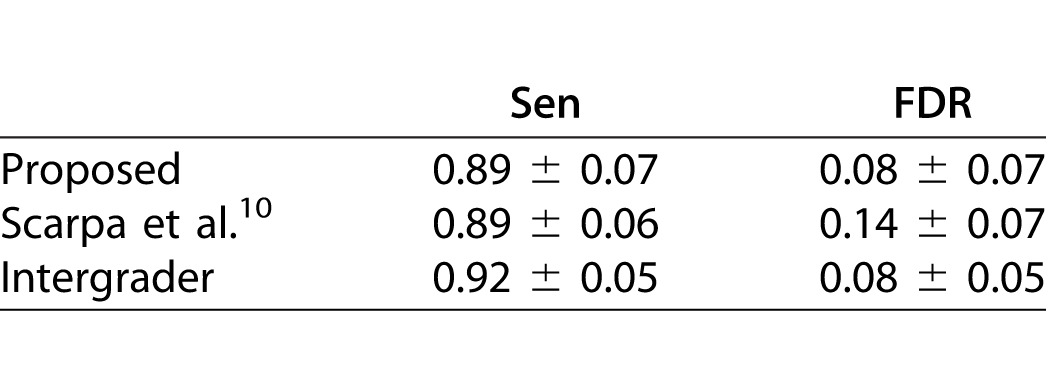
Regarding the sensitivity, when compared to the intergrader variability, the proposed approach and the approach by Scarpa et al.10 achieved a significantly lower value (P < 0.0001). No significant differences were found between the two automatic approaches (P ≫ 0.05). As for the FDR, the proposed approach is not significantly different from a human grader (P ≫ 0.05). On the other hand, the approach by Scarpa et al.10 achieves a FDR significantly higher (P < 0.0001) when compared to a human grader or the proposed approach.
The time required to analyze a single image, using a single core MATLAB (MathWorks, Inc., Natick, MA) implementation, was 0.61 ± 0.07 seconds (AVG ± SD) on an Intel Core i7-4770 CPU (Intel Corporation, Santa Clara, CA) at 3.4 GHz. Using the same computer, the approach by Scarpa et al.10 requires 145.56 ± 26.42 seconds.
Nerve Density
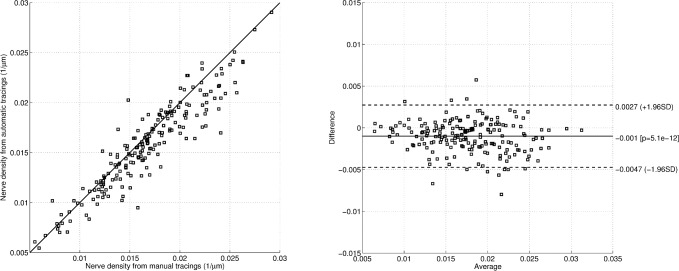
Corneal nerve density (the cumulative length of the subbasal nerves per unit of area of the cornea) was computed for the automatic and ground-truth tracings of the testing subset of DB1. This measure is an important clinical parameter to evaluate the cornea health status. Figure 4a shows the nerve density computed from the automatic tracings against the one computed from the ground-truth (manual) tracings. The correlation coefficient between the two is 0.93 (P < 0.0001). Figure 4b shows the Bland-Altman plot of the same results.
Figure 4.
Corneal nerve density (N = 196). (a) Automatic against manual tracings. (b) Bland-Altman plot.
Tortuosity
Corneal nerve tortuosity is an important feature of corneal nerves. To investigate the clinical usefulness of the proposed algorithm, it is essential to evaluate nerve tortuosity as computed from the automatic segmentation. The tortuosity was evaluated on the DB2 set of 30 images. First, the corneal nerves were traced for each image using the proposed algorithm. Then, corneal nerve tortuosity was computed as proposed previously.20 Shortly, each nerve segment (s) is divided into smaller subsegments called turn curves. A turn curve is a portion of the segment located between two consecutive twists, that is, between changes in the curvature sign. As such, each nerve segment is partitioned into n subsegments si as: s = s1 ⊕ s2 ⊕ ⋯ ⊕ sn. The tortuosity index τ for the nerve segment s then is computed as:
 |
where  and
and  are the curve length (cumulative Euclidean distance over the segment's path) and chord length (Euclidean distance between the first and last point) of segment s, respectively.
Figure 5 shows a sample image for each tortuosity class. Marked in these images are the automatic traced corneal nerves. Figure 6 shows the resulting corneal nerve tortuosity against the grader tortuosity classes – High, Mid, and Low tortuosity. A Spearman's rank correlation coefficient of 0.95 is achieved (P < 0.0001). If one sets two thresholds to distinguish between the three classes (as shown in the Figure), 28 of the 30 images would be correctly classified (93.3%).
Figure 5.
From left to right: automatic tracing (in red) of Low, Mid, and High tortuosity images (as classified by the expert grader), respectively. Scale bar: 30 μm.
Figure 6.
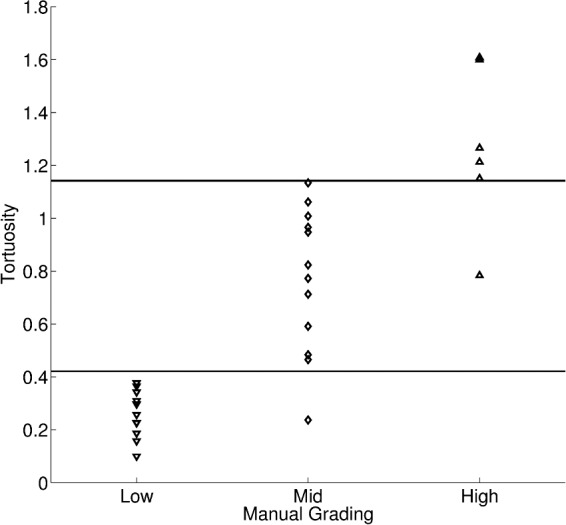
Automatic tortuosity against manual grading (N = 30).
Mosaics
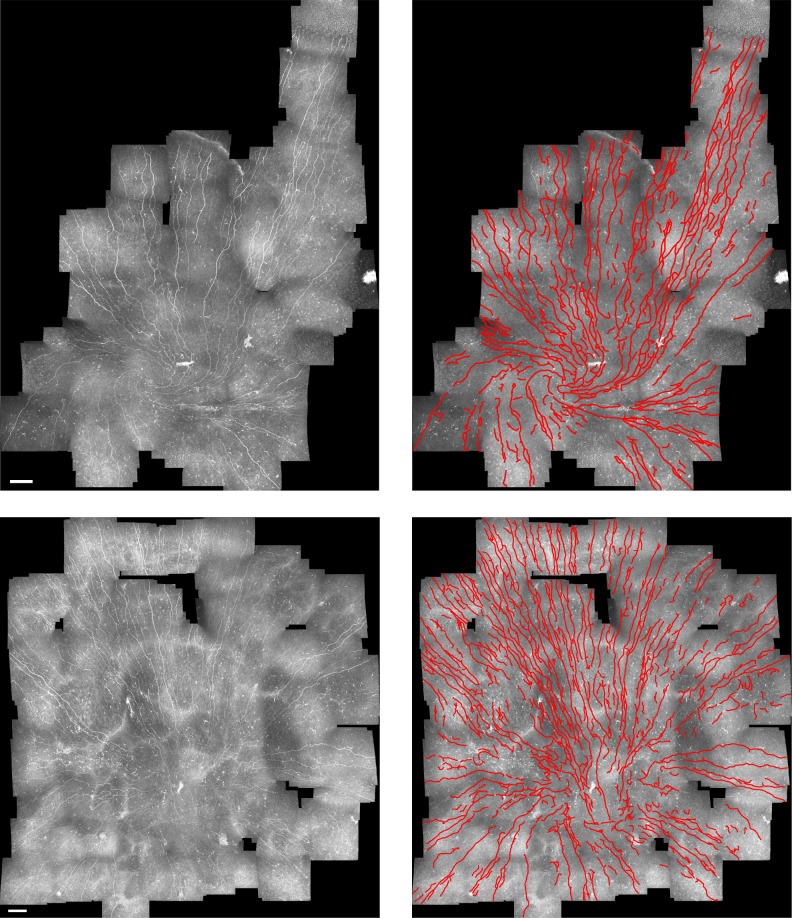
The same confocal microscope used before was used to acquire multiple single images. Raster scanning is achieved by manual x/y translation to sweep the visible area of the nerve plexus. Manual adaptive depth correction then is implemented when the examiner feels visibility or contrast of the nerves is reduced. Cornea mosaics were created using the approach described previously.20 No changes were made to the tracing algorithm to adapt it for mosaics. Figure 7 shows some examples of mosaic automatic nerve tracing. The execution time to trace each mosaic is in general directly proportional to its area. For instance, the proposed algorithm took 32.2 seconds for a mosaic with a total area of 4.9 × 106 μm2 (or 30.6 times the area of a conventional single image).
Figure 7.
From left to right: original corneal mosaic images and automated nerve tracing (in red). Scale bar: 120 μm.
Discussion
The use of confocal microscopy to image the human cornea has led to a revolution in the diagnosis and monitoring of this important structure. Furthermore, several studies have shown that the cornea may be regarded as a window to the study of some systemic diseases, such as diabetic neuropathy.3–7
The analysis of the corneal nerves seems to be pivotal in these studies. However, the availability of manual or semiautomatic analysis limits the widespread use of this technique. Therefore, a fully automatic robust algorithm, capable of tracing nerves from confocal microscopy images of the subbasal corneal nerve plexus is needed, as it can provide robust corneal nerve descriptors, such as nerve density or tortuosity, and consequently the possibility of an improved diagnosis.
The proposed algorithm proved capable to correctly trace almost 90% of the corneal nerves. When compared to the approach by Scarpa et al.,10 the proposed approach achieves better results (similar Sen, lower FDR). Furthermore, the FDR level achieved by the proposed approach is comparable to a human grader. However, the proposed approach still is significantly less sensitive. These results were achieved with an execution time of only 0.61 ± 0.07 seconds per image (compared to the 145.56 ± 26.42 seconds per image of the previous approach). Dabbah et al.7 also proposed an automatic classification system to detect nerve fibers in corneal confocal microscopy images. In their study, they reported an average sensitivity of 84.8%. Although the images were captured with the same system, the datasets are different, and as such, the results are not directly comparable. Run time was not reported. Dehghani et al.,12 using the same tracing software as Dabbah et al.,7 compared diabetic neuropathy detection rates between manual, semiautomated, and automated methods. They showed that the fully automated approach was comparable to the manual and semiautomated ones.12 The average time reported to obtain corneal nerve fiber length per image was of 13 ± 2 seconds. Ziegler et al.9 reported no validation results for the automatic nerve tracing.
The achieved quality and processing time of the proposed approach to trace the corneal nerves appeared adequate for the possible application of this technique to clinical practice. The clinical usefulness of the proposed method also was assessed. The clinical parameters of nerve density and tortuosity of the corneal nerves were evaluated. For both parameters the proposed approach performed well. The nerve density computed from the automatic tracings was highly correlated with the one computed from the manual ones. Regarding tortuosity, approximately 93% of the cases were classified correctly, compared to the manual grading. A high correlation to the rank also was achieved.
In the future, we believe that corneal mosaics will become more and more common in clinical settings. These composed images may greatly enhance the information on disease progression, as they allowed us to study complete nerve patterns and take global metrics. If manual tracing of corneal nerves from an image with 400 × 400 μm2 (384 × 384 pixels) is difficult, performing this task in a large mosaic image is nearly impossible.
The proposed algorithm also was applied successfully to mosaic images of the cornea, with run times in the order of tens of seconds. This means that one can trace the corneal nerves in a very short time and as such enable the automatic and objective analysis of these images. Previous methods, although capable of tracing corneal nerves, had as a main setback their execution time. Fully automated corneal nerve tracing algorithms previously have been applied successfully to cornea mosaics.8,14 The reported running time was of tens of minutes.8
These results showed the clinical applicability of the proposed approach for automated nerve tracing and clinical parameter estimation. However, further tests are needed to confirm this on larger datasets.
Acknowledgments
The authors thank Neil Lagali for the confocal images and manual nerve tracings.
Supported by a Marie Curie grant from the European Commission in the framework of the REVAMMAD ITN (Initial Training Research network), Project number 316990.
Disclosure: P. Guimarães, None; J. Wigdahl, None; A. Ruggeri, None
References
- 1. Marfurt CF,, Cox J,, Deek S,, Dvorscak L. Anatomy of the human corneal innervation. Exp Eye Res. 2010; 90: 478–492. [DOI] [PubMed] [Google Scholar]
- 2. Patel SV,, McLaren JW,, Hodge DO,, Bourne WM. Confocal microscopy in vivo in corneas of long-term contact lens wearers. Invest Ophthalmol Vis Sci. 2002; 43: 995–1003. [PubMed] [Google Scholar]
- 3. Patel DV,, McGhee CN. In vivo confocal microscopy of human corneal nerves in health, in ocular and systemic disease, and following corneal surgery: a review. Br J Ophthalmol. 2009; 93: 853–860. [DOI] [PubMed] [Google Scholar]
- 4. Cruzat A,, Pavan-Langston D,, Hamrah P. In vivo confocal microscopy of corneal nerves: analysis and clinical correlation. Semin Ophthalmol. 2010; 25: 171–177. [DOI] [PMC free article] [PubMed] [Google Scholar]
- 5. Müller LJ,, Marfurt CF,, Kruse F,, Tervo TM. Corneal nerves: structure, contents and function. Exp Eye Res. 2003; 76: 521–542. [DOI] [PubMed] [Google Scholar]
- 6. Kallinikos P,, Berhanu M,, ODonnell C,, Boulton AJ,, Efron N,, Malik RA. Corneal nerve tortuosity in diabetic patients with neuropathy. Invest Ophthalmol Vis Sci. 2004; 45: 418–422. [DOI] [PubMed] [Google Scholar]
- 7. Dabbah M,, Graham J,, Petropoulos I,, Tavakoli M,, Malik R. Automatic analysis of diabetic peripheral neuropathy using multi-scale quantitative morphology of nerve fibres in corneal confocal microscopy imaging. Med Image Anal. 2011; 15: 738–747. [DOI] [PubMed] [Google Scholar]
- 8. Zhivov A,, Winter K,, Hovakimyan M,, et al. Imaging and quantification of subbasal nerve plexus in healthy volunteers and diabetic patients with or without retinopathy. PloS One. 2013; 8: e52157. [DOI] [PMC free article] [PubMed] [Google Scholar]
- 9. Ziegler D,, Papanas N,, Zhivov A,, et al. Early detection of nerve fiber loss by corneal confocal microscopy and skin biopsy in recently diagnosed type 2 diabetes. Diabetes. 2014; 63: 2454–2463. [DOI] [PubMed] [Google Scholar]
- 10. Scarpa F,, Grisan E,, Ruggeri A. Automatic recognition of corneal nerve structures in images from confocal microscopy. Invest Ophthalmol Vis Sci. 2008; 49: 4801–4807. [DOI] [PubMed] [Google Scholar]
- 11. Poletti E,, Ruggeri A. Automatic nerve tracking in confocal images of corneal subbasal epithelium. In: 2013 IEEE 26th International Symposium on Computer-Based Medical Systems (CBMS). New York: IEEE; 2013: 119–124. [Google Scholar]
- 12. Dehghani C,, Pritchard N,, Edwards K,, Russell AW,, Malik RA,, Efron N. Fully automated, semiautomated, and manual morphometric analysis of corneal subbasal nerve plexus in individuals with and without diabetes. Cornea. 2014; 33: 696–702. [DOI] [PubMed] [Google Scholar]
- 13. Petropoulos IN,, Alam U,, Fadavi H,, et al. Rapid automated diagnosis of diabetic peripheral neuropathy with in vivo corneal confocal microscopy automated detection of diabetic neuropathy. Invest Ophthalmol Vis Sci. 2014; 55: 2071–2078. [DOI] [PMC free article] [PubMed] [Google Scholar]
- 14. Winter K,, Scheibe P,, Köhler BK,, Allgeier S,, Guthoff RF,, Stachs O. Local variability of parameters for characterization of the corneal subbasal nerve plexus. Curr Eye Res. 2015; 41: 185–198. [DOI] [PubMed] [Google Scholar]
- 15. Parissi M,, Randjelovic S,, Poletti E,, et al. Corneal nerve regeneration after collagen cross-linking treatment of keratoconus: a 5-year longitudinal study. JAMA Ophthalmol. 2015; 134: 70–78. [DOI] [PubMed] [Google Scholar]
- 16. Meijering E,, Jacob M,, Sarria J-C,, Steiner P,, Hirling H,, Unser M. Design and validation of a tool for neurite tracing and analysis in fluorescence microscopy images. Cytometry Part A. 2004; 58: 167–176. [DOI] [PubMed] [Google Scholar]
- 17. Soares J,, Leandro J,, Cesar RJ,, Jelinek H,, Cree M. Retinal vessel segmentation using the 2-d Gabor wavelet and supervisedclassification. IEEE Trans Med Imaging. 2006; 25: 1214–1222. [DOI] [PubMed] [Google Scholar]
- 18. Duda RO,, Hart PE,, Stork DG. Pattern Classification. New York: John Wiley & Sons; 2012. [Google Scholar]
- 19. Chang C-C,, Lin C-J. LIBSVM: a library for support vector machines. ACM Trans Intell Syst Technol. 2011; 27:27:1–27. :27. Software available at https://www.csie.ntu.edu.tw/~cjlin/libsvm/.
- 20. Scarpa F,, Zheng X,, Ohashi Y,, Ruggeri A. Automatic evaluation of corneal nerve tortuosity in images from in vivo confocal microscopy. Invest Ophthalmol Vis Sci. 2011; 52: 6404–6408. [DOI] [PubMed] [Google Scholar]
- 21. Poletti E,, Wigdahl J,, Guimarães P,, Ruggeri A. Automatic montaging of corneal sub-basal nerve images for the composition of a wide-range mosaic. Conf Proc IEEE Eng Med Biol Soc. 2014; 2014: 5426–5429. [DOI] [PubMed] [Google Scholar]


