

Abstract
Drug‐coated balloons (DCBs) have now emerged as a promising approach to treat peripheral artery disease. However, a significant amount of drug from the balloon surface is lost during balloon tracking and results in delivering only a subtherapeutic dose of drug at the diseased site. Hence, in this study, the use of dextran sulfate (DS) polymer was investigated as a platform to control the drug release from balloons. An antiproliferative drug, paclitaxel (PAT), was incorporated into DS films (PAT‐DS). The characterizations using SEM, FT‐IR, and DSC showed that the films prepared were smooth and homogenous with PAT molecularly dispersed in the bulk of DS matrix in amorphous form. An investigation on the interaction of smooth muscle cells (SMCs) with control‐DS and PAT‐DS films showed that both films inhibited SMC growth, with a superior inhibitory effect observed for PAT‐DS films. PAT‐DS coatings were then produced on balloon catheters. The integrity of coatings was well‐maintained when the balloons were either deflated or inflated. In this study, up to 2.2 µg/mm2 of PAT was loaded on the balloons using the DS platform. Drug elution studies showed that only 10 to 20% of the total PAT loaded was released from the PAT‐DS coated balloons during the typical time period of balloon tracking (1 min) and then ∼80% of the total PAT loaded was released during the typical time period of balloon inflation and treatment (from 1 min to 4 min). Thus, this study demonstrated the use of DS as a platform to control drug delivery from balloons. © 2015 The Authors Journal of Biomedical Materials Research Part B: Applied Biomaterials Published by Wiley Periodicals, Inc. J Biomed Mater Res Part B: Appl Biomater, 104B: 1416–1430, 2016.
Keywords: drug‐coated balloons, dextran sulfate, peripheral artery disease, restenosis, smooth muscle cells
INTRODUCTION
Drug‐coated balloons (DCBs) and drug‐eluting stents (DES) are currently used for treating peripheral artery disease.1 The main advantages of DCBs over DES are (a) DCBs are preferred for treating small diameter vessels, tortuous vessels, and vessels with complicated lesions, where stents are generally not preferred due to increased risk of stent fracture; (b) homogenous transfer of drug to the vessel wall; (c) reduction in the chance of chronic inflammation; (d) reduction in the chance of late thrombosis; (e) avoid the use of long‐term antiplatelet therapy.2, 3, 4 Although DCBs can provide such significant advantages, the major technical limitations of currently used DCBs include the loss of drug from the balloon surface during tracking and the inability to deliver a therapeutic dose of drug at the treatment site.2, 3, 4
In DCBs, previously, the antiproliferative drug paclitaxel was directly coated on the balloon surfaces without any carriers.2, 3, 4 However, the drug was not effectively transferred from the balloon surface to the tissue at the treatment site. Hence, the different types of hydrophilic excipients such as urea, iopromide, polysorbate, butyryl‐tri‐hexyl citrate, and shellac were used to coat paclitaxel on the balloon surface to aid in delivering the drug to the treatment site.2, 3, 4 Most of these excipients were chosen mainly for improving the drug penetration into the tissue after it is delivered. However, the use of hydrophilic excipients in most cases (not all) prompted the drug to be released too soon often before the balloon is tracked to the treatment site. This has resulted in the loss of up to 80% of the drug in the blood stream.2 This not only results in the delivery of a subtherapeutic level of drug at the treatment site but also may cause systemic toxicity.2, 3, 4 Some DCBs such as SeQuent Please, which uses iopromide contrast medium to coat PAT on balloons, have shown promising results in patients even at long‐term follow up.5 However, there is still a great need for a carrier on the balloon surface to control the drug release in such a way that drug loss is avoided during balloon tracking, and then a therapeutic dose of drug is delivered at the diseased site during the short time of balloon inflation and treatment.
In this study, we have developed dextran sulfate coatings as a drug delivery platform for balloons to avoid significant drug loss during the typical time period of balloon tracking (1 min), and then to immediately deliver a clinically relevant dose of drug during the typical time period of balloon inflation and treatment (from 1 min to 4 min).
MATERIALS AND METHODS
Materials
Dextran sulfate sodium salt, M W >500,000 was purchased from Alfa Aesar (USA). Absolute ethanol (200 proof), dimethyl sulfoxide (DMSO), glycerol (≥99.5%), HPLC‐grade water and acetonitrile, phosphate buffered saline with 0.05% Tween‐20 (PBS/T‐20), and fluorescein diacetate (FDA) were all purchased from Sigma‐Aldrich (USA). Paclitaxel was purchased from Chemietek (Indianapolis, IN). All the chemicals were used as received.
Preparation of paclitaxel‐loaded dextran sulfate films
Paclitaxel (PAT)‐loaded dextran sulfate (DS) films (PAT‐DS) were prepared by a solvent‐casting method. A polymer‐drug solution was prepared with 25 w/v % of DS, 0.27 w/w % of paclitaxel (PAT), and 10 w/w % of glycerol (plasticizer) in a solvent mixture of deionized water (di‐H2O) and ethanol or DMSO. For example, to prepare a typical PAT‐DS film, 7.5 g of DS and 750 µg of glycerol were initially dissolved in 27 mL of di‐H2O and stirred at 400 rpm for 3 h. In parallel, a solution of PAT was prepared by sonicating 20 mg of PAT in 3 mL of ethanol or DMSO for 15 min. Thus prepared PAT solution was added to the DS solution and the polymer‐drug mixture was stirred at 400 rpm for 18 h. After that, the solution was heated at 50°C for 1 h with continuous stirring. The solution was then poured into a glass petri‐dish (9 cm in diameter) and immediately transferred to a vacuum oven, which was preheated at 50°C, and maintained under vacuum at a pressure of −20 in mmHg. The films prepared using ethanol as a solvent was taken out after 30 h while the films prepared using DMSO was taken out after 48 h. The PAT‐DS films were peeled off from the petri‐dish and cut into specimens of appropriate sizes for different characterizations. The PAT‐DS films prepared using the solvents ethanol and DMSO are denoted in this study as PAT‐DS‐1 and PAT‐DS‐2, respectively. Control DS films (Ctrl‐DS) were also prepared using the same method without incorporating PAT. The Ctrl‐DS films prepared using the solvents ethanol and DMSO are denoted in this study as Ctrl‐DS‐1 and Ctrl‐DS‐2, respectively.
Characterizations
Both the Ctrl‐DS and PAT‐DS films prepared in this study were characterized using scanning electron microscopy (SEM), Fourier transform infrared (FT‐IR) spectroscopy, and differential scanning calorimetry (DSC).
A Quanta 450 SEM (FEI, USA) was used to observe the surface morphology as well as the cross‐sectional morphology of the films at an accelerating electron voltage of 30 kV. Before SEM imaging, all the samples were sputter‐coated with a 15‐nm thick layer of gold‐palladium. A Nicolet 6700 FT‐IR spectroscopy (Thermo Scientific) equipped with an attenuated total reflection (ATR) accessory was used to characterize the film surfaces. All the IR spectra presented here were collected at 512 scans with a spectral resolution of 4 cm−1. A DSC Q200 (TA Instruments) was used to characterize the thermal properties of all the films prepared in this study. For this characterization, the film samples weighing 8 to 10 mg were sealed in an aluminum pan and heated from 0 to 350°C at a scanning rate of 10°C/min. All the measurements were carried out in a chamber purged with nitrogen gas at a flow rate of 40 mL/min.
Mechanical properties
A MTS insight electromechanical apparatus (MTS Systems Corp., Eden Prairie, MN) equipped with a 100 N load cell was used to carry out the tensile test for Ctrl‐DS and PAT‐DS films (n = 3 each) prepared in this study. For this characterization, the films were cut into rectangular specimens of 5 cm × 1 cm. A length of 1 cm from each end of the specimen was gripped to obtain a stressed region of 3 cm × 1 cm. The specimens were then pulled at a rate of 50 mm/min until they break. A plot of tensile stress (MPa) versus strain (%) was obtained for each specimen using TestWorks 4 software.
Drug release studies of PAT‐DS films
For the drug release studies, the PAT‐DS films (1 cm × 1 cm, n = 6) were immersed in 40 mL of PBS/T‐20 solution in a circulating water bath at 37°C by holding the specimen carefully using a tweezer. As a standard procedure, tween‐20 was added to PBS to maintain sink conditions by increasing the solubility of PAT in PBS.6, 7 The specimens were taken out of the solution at several pre‐determined time points (15 s, 30 s, 1 min, 2 min, and 5 min) and transferred to a fresh PBS/T‐20 solution until the next time point. After 5 min, the tweezer used for holding the specimens was immersed in the solution for two more minutes (5–7 min), and manually shaken well to transfer any of the undissolved films attached to the tweezer into the solution. Before HPLC analysis, as a standard procedure, 2 mL of EtOH was added to the PBS/T‐20 solutions collected in the polypropylene tubes to remove any PAT adsorbed on the surfaces of tubes during drug‐elution studies.6, 7 The high performance liquid chromatography (HPLC) protocol for determining PAT was followed as we reported previously.6, 7
Smooth muscle cell (SMC) culture
Human aortic smooth muscle cells (HASMCs, catalog no. 354‐05a) and SMC growth medium (catalog no. 311‐500) were purchased from Cell Applications (San Diego, CA). The SMCs in passage 4 to 6 were cultured in the growth medium in a humidified incubator supplied with 5% CO2 and maintained at 37°C. The following experiment was carried out to study the interaction of SMCs with the Ctrl‐DS and PAT‐DS films prepared in this study. A density of 15 × 103 cells (in 1 mL of growth medium) was allowed to grow in the wells of a 24‐well tissue culture plate. After 24 h, the used medium was removed from each well and 1 mL of fresh medium was added. Then, the Ctrl‐DS and PAT‐DS films were added individually to the cells grown in the wells. On day 1 (after 24 h of adding films to the cells), the used media were removed and 1 mL of fresh growth media was added to the wells. After that, the media were changed on days 3 and 5. For the control experiment, the cells were allowed to grow in the wells without adding any films. Also, to evaluate the dose responses of Ctrl‐DS and PAT‐DS films on the growth of SMCs, two different sizes (0.5 cm × 0.5 cm and 1 cm × 1 cm) of films were used in this experiment.
SMC viability, proliferation, morphology, and phenotype studies
The viability and proliferation of SMCs were measured using resazurin fluorometric assay as we reported previously.8, 9 For observing cell morphology, the SMCs were stained with fluorescein diacetate and imaged using fluorescence microscopy as we reported previously.8, 9 The phenotype of SMCs was studied by immunofluorescence using smooth muscle α‐actin primary antibody, goat anti‐mouse IgG‐FITC secondary antibody, and propidium iodide for staining the nucleus. The immunofluorescence protocol was carried out as we reported previously.8
Preparation of PAT‐DS coatings on balloons
Three different PAT‐DS coating solutions were prepared with low, medium, and high doses of PAT. Each of these solutions was prepared with 75 w/v% of DS and 10 w/w% of glycerol (plasticizer) in a solvent mixture of di‐H2O and ethanol. The w/w% of PAT was 0.27, 0.54, and 0.81 for low, medium, and high doses. To prepare each of the coating solution, DS was initially dissolved in 9 mL of di‐H2O and stirred at 100 rpm for 3 h. After that, the solution of PAT in 1 mL of ethanol was added to the DS solution, and the drug‐polymer mixture was allowed to stir at 100 rpm for 18 h.
Angioplasty balloon catheters (ev3 Inc.) of 4 mm in diameter × 20 mm in length were used in these experiments. Initially, the balloons were inflated with a pressure of 6 to 8 atm. Then, the inflated balloons were dipped in the coating solutions for 30 s. After that, the coated balloon was slowly taken out of the solution and immediately dipped into 100% ethanol for 1 min for dehydration. This procedure of dipping in ethanol for 1 min was repeated thrice more with fresh ethanol used each time. Then, the coated and dehydrated balloon was dipped in a solution mixture of ethanol and glycerol (9:1, v/v) for 1 min twice with fresh solution mixture used each time. After that, the balloons were dried in a laminar airflow hood for 30 min.
SEM imaging of PAT‐DS coated balloons
The SEM images of PAT‐DS coated balloons were taken at three different stages: as‐coated, deflated, and inflated positions. An accelerated electron voltage of 1 kV was used to obtain SEM images at several different areas of the balloons. For determining the thickness of PAT‐DS coating on balloons, the coated balloons were carefully cut for cross‐section, and sputter‐coated with a 15‐nm thick gold palladium coating. The cross‐sectional images were obtained using an accelerated electron voltage of 15 kV.
Drug elution studies of PAT‐DS coated balloons
The coated balloons were deflated before drug elution studies. Then, the balloons were immersed in 40 mL of PBS/T‐20 solution in a circulating water bath at 37°C. The balloons were taken out of the solution at time points 30 s and 1 min, and transferred to a fresh PBS/T‐20 solution until the next time point. After 1 min time point, when the balloon was transferred to the fresh PBS/T‐20 solution, it was inflated with a pressure of 6 to 8 atm in PBS/T‐20 solution. Then, the balloons were taken out of the solution at other time points 2 min, 3 min, 4 min, 5 min, and 7 min, and transferred to fresh PBS/T‐20 solution for every time point used in this study. After 5 min time point and until 7 min, the balloon was manually shaken well to completely retrieve the residual PAT‐DS present on the balloon.
Statistical analysis
The experimental data collected are reported as mean ± standard deviation. A one‐way analysis of variance (ANOVA) was used to determine the statistical significance at p < 0.05. Unless otherwise mentioned, three samples were used for each sample group at each time point in every cell‐based experiment used in this study.
RESULTS
Characterization of Ctrl‐DS and PAT‐DS films
Figure 1 shows the SEM images of surfaces and cross‐sections of Ctrl‐DS and PAT‐DS films. Both the surfaces and the cross‐sections of the films were carefully examined for their smoothness, homogeneity, and presence of any defects. The Ctrl‐DS films were transparent in appearance. The surfaces of Ctrl‐DS‐1 [Figure 1(A)] and Ctrl‐DS‐2 [Figure 1(B)] were smooth and homogeneous with no surface defects observed. The cross‐section of Ctrl‐DS‐1 [Figure 1(E)] predominantly showed a fibrous‐like morphology while the cross‐section of Ctrl‐DS‐2 [Figure 1(F)] showed a relatively flat morphology with few fibrous‐like protrusions. The PAT‐DS films were whitish in appearance due to the incorporation of PAT. The surfaces of PAT‐DS‐1 [Figure 1(C)] and PAT‐DS‐2 [Figure 1(D)] were also smooth, homogeneous, and defect‐free. The cross‐sections of both PAT‐DS‐1 [Figure 1(G)] and PAT‐DS‐2 [Figure 1(H)] films appeared much smoother when compared with that of their respective control DS films. Unlike Ctrl‐DS films, no fibrous‐like morphology was observed in the cross‐sections of PAT loaded DS films [Figure 1(G,H)]. This could suggest that the PAT loaded act as a filler between DS polymer molecules to provide a smoother morphology. Also, no PAT crystals (typically exists in needle or plate‐like morphologies) were observed in the cross‐sections of PAT‐DS films [Figure 1(G,H)]. This suggested that the PAT was molecularly dispersed in the DS matrix.
Figure 1.
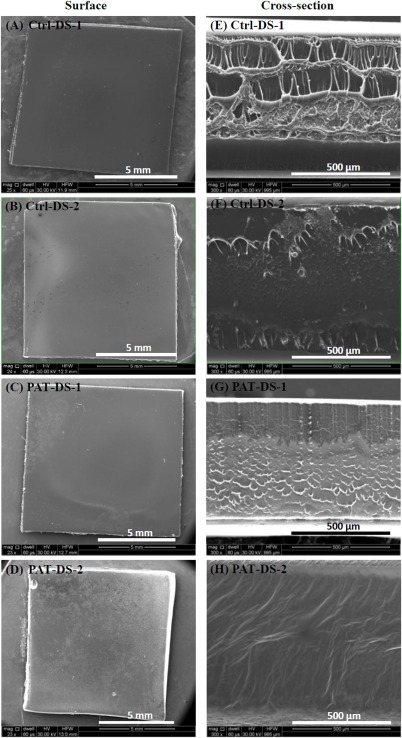
SEM images of surfaces (A–D) and cross‐sections (E–H) of Ctrl‐DS‐1, Ctrl‐DS‐2, PAT‐DS‐1, and PAT‐DS‐2 films.
All the FT‐IR spectra obtained in this study were interpreted using several references from the literature.10, 11, 12, 13 The chemical structures of DS and PAT are shown as the subsets of Figure 2(A‐1,A‐2), respectively. The FT‐IR spectrum of dextran sulfate powder [Figure 2(A‐1)] contains the following characteristic bands (cm−1): 3479 ν(O—H), 2949 ν(C—H), 1634 δ(HOH), 1457, and 1386 δ(C—H), 1220 νs(S=O), 1200 to 1000 complex band ν(C—O) and ν(C—C), 981 νas(S=O), 932 γ(C—H), 800 ν(O—S—O), 800 to 600 complex band γ(C–H). The FT‐IR spectrum of PAT powder (Figure 2A‐2) contains the following characteristic bands (cm−1): 3440 ν(O—H), 2944 ν(C—H), 1732 and 1704 ν(C=O) of ester group, 1649 ν(C=O) of amide group, 1369 δ(C—H), 1200 to 1000 complex band ν(C—O) and ν(C—C), 1000 to 600 complex band γ(C—H).
Figure 2.
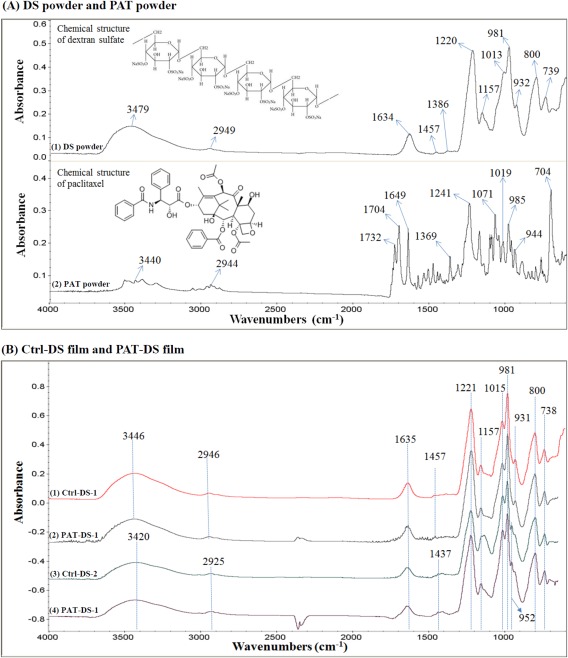
FT‐IR spectra of DS powder and PAT powder (A), Ctrl‐DS films and PAT‐DS films (B).
The FT‐IR spectra of Ctrl‐DS and PAT‐DS films are provided in Figure 2(B). In these spectra, the characteristic peaks of DS were observed around the same positions as that of DS powder. This suggested that the chemical structure of DS was not altered either when the polymer was made into a film or after the PAT was incorporated into the DS. The sulfate groups ( ) in DS is primarily responsible for the anticoagulant activity of the polymer.14 The presence of peaks for the S=O group at 1221 and 981 cm−1, and the peak for O—S—O group at 800 cm−1 in both Ctrl‐DS and PAT‐DS showed that the functional groups providing the anticoagulant properties are not affected in the films prepared. A new peak was observed at 952 cm−1 in the films prepared using DMSO as a solvent [Figure 2(B‐3,2B‐4)]. This peak was assigned to the rocking vibration of —CH3 groups of DMSO. This suggested that a trace amount of DMSO was present in Ctrl‐DS‐2 and PAT‐DS‐2 films. Also, no peaks for PAT were observed for the PAT‐DS films. This suggested that the PAT was not present on the surface of PAT‐DS, and was successfully incorporated into bulk of the DS matrix.
Figure 3 shows the DSC thermograms of DS powder, PAT powder, Ctrl‐DS films, and PAT‐DS films. For the DS powder [Figure 3(A)], three peaks were observed: (a) an endothermic peak for the glass transition temperature (T g) at 133°C; (b) an exothermic peak for the crystallization temperature (T c) at 210°C; (c) a small endothermic peak for the melting temperature (T m) at 272°C. This suggested that the DS powder used in this study was semicrystalline. For the PAT powder [Figure 3(B)], an endothermic melting peak was observed at 225°C, which was immediately followed by an exothermic decomposition peak at 237°C. For the Ctrl‐DS‐1 film [Figure 3(C)], the peak for T g slightly reduced to 124°C whereas the peak for T c increased to 226°C when compared with those of DS powder. Also, the peak for T m slightly increased to 279°C. An endothermic peak for the evaporation of glycerol was observed at 290°C. The area under the peaks for both T g and T m were much larger for Ctrl‐DS‐1 when compared with those of DS powder. This suggested that the degree of amorphous and crystalline regions in the film was significantly increased when compared with that of powder. After the incorporation of PAT [Figure 3(D)], a doublet peak with a very small shoulder peak at 127°C and a broad diffuse peak at 148°C were observed for the T g of DS and the T m of amorphous form of PAT, respectively. In the literature, when the peak for T g of a polymer disappears or becomes very small after the incorporation of drug, it is attributed to the immobility of polymer chains due to the formation of intermolecular bonding interactions between the polymer and the drug.15 This suggested that, in this study, the PAT formed intermolecular hydrogen bonding interactions with DS and prevented polymer chain mobility. It has been previously shown in the literature that the melting point of amorphous form of PAT (∼150°C) is significantly lesser than that of its crystalline form (∼225°C).16 This suggested that the PAT was present in amorphous form inside the DS matrix. Also, a peak for the evaporation of glycerol was observed in these films at 293°C. For the Ctrl‐DS‐2 film [Figure 3(E)], the T g was slightly increased to 138°C when compared with that of the powder. The T c was significantly reduced for these films with dual exothermic peaks observed at 168°C and 176°C, and the T m was observed at 270°C. For the PAT‐DS‐2 [Figure 3(F)], the endothermic peak at 135°C was broadened with tailing. This could be due to the overlap of peaks for T g of DS and T m of amorphous form of PAT, as observed in PAT‐DS‐1. The other peaks for T c and T m for PAT‐DS‐2 were observed at the positions similar to those of Ctrl‐DS‐2.
Figure 3.

DSC thermograms of DS powder (A), PAT powder (B), Ctrl‐DS‐1 film (C), PAT‐DS‐1 film (D), Ctrl‐DS‐2 film (E), and PAT‐DS‐2 film (F).
Mechanical properties of Ctrl‐DS and PAT‐DS films
Figure 4 shows the stress–strain curves of Ctrl‐DS and PAT‐DS films prepared in this study. In the literature, based on the shape of stress–strain curves, polymers are generally classified under five categories: (a) hard‐tough; (b) soft‐tough; (c) hard‐brittle; (d) soft‐weak; (e) soft‐tough.17 “Hard” refers to high tensile strength and modulus while the “soft” refers to low tensile strength and modulus. The polymers that show high elongation are classified as “tough” whereas the polymers that show low elongation are classified as “brittle.” If the polymer has moderate elongation, then it is classified as “strong” or “weak” depending on its tensile strength. Based on this standard classification, the films prepared in this study are categorized. All the Ctrl‐DS and PAT‐DS films prepared in this study showed a low modulus (<10 MPa), indicating that the material is soft, and a high elongation before fracture (>380%), indicating that the material is tough. Thus, all the films prepared in this study can be categorized under “soft‐tough” category. Figure 4(B) shows the tensile strength (MPa), strain at break (%), and modulus (MPa) for all the Ctrl‐DS and PAT‐DS films. The values obtained for PAT‐DS‐1 and PAT‐DS‐2 films were similar to their respective Ctrl‐DS films. This showed that the incorporation of PAT did not affect the mechanical properties of DS films. However, the films prepared using different solvents showed significant difference in the values. The films prepared using ethanol showed much higher tensile strength and modulus than that of the films prepared using DMSO. On the other hand, the films prepared using DMSO showed better elongation (higher strain at break %). Nevertheless, it is important to note that all the Ctrl‐DS and PAT‐DS films prepared in this study exhibited excellent elongation (>380%) irrespective of type of solvents used to prepare them. These results showed that the films developed are promising as a coating for drug‐coated balloons since the coating needs to be expanded when the balloon is inflated at the treatment site.
Figure 4.
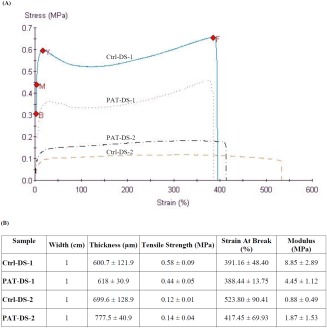
Stress–strain curves of Ctrl‐DS‐1, Ctrl‐DS‐2, PAT‐DS‐1, and PAT‐DS‐2 films (A); mechanical properties of Ctrl‐DS and PAT‐DS films (B).
Drug release from PAT‐DS films
The total amount of PAT loaded in PAT‐DS‐1 and PAT‐DS‐2 films (1 cm × 1 cm) were determined as 1.4 ± 0.3 µg/mm2, and 1.6 ± 0.3 µg/mm2, respectively. The cumulative release of PAT is provided in Figure 5(A). Only a trace amount (0.2 µg/mm2) of PAT was released until 1 min. After that, most of the drug loaded (1.2 µg/mm2) was released by 5 min. This suggested that the PAT‐DS films completely dissolved by 5 min. After 5 min, only a trace amount (0.1 µg/mm2) of PAT was retained. Several clinical studies in the literature have shown that a dose of 1 µg/mm2 was effective in inhibiting neointimal hyperplasia.2, 3, 4
Figure 5.
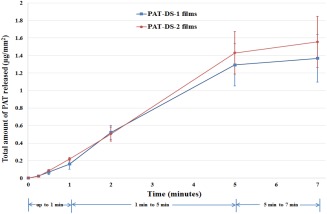
Cumulative PAT release (µg/mm2) for PAT‐DS‐1 and PAT‐DS‐2 specimens.
SMC viability and proliferation
Figure 6(A) shows the viability of SMCs treated with Ctrl‐DS and PAT‐DS films (specimen size: 0.5 cm × 0.5 cm). The dose of DS in Ctrl‐DS films of 0.5 cm × 0.5 cm was determined as 30 mg. The doses of DS and PAT in PAT‐DS films of 0.5 cm × 0.5 cm were determined as 30 mg and 37 µg, respectively. For the control experiment, the cells were allowed to grow in the wells without any films (Ctrl‐well). At all the time points (day 1, 3, and 5), the number of viable cells for Ctrl‐DS‐1, Ctrl‐DS‐2, PAT‐DS‐1, and PAT‐DS‐2 were significantly lesser than that of the Ctrl‐well. This suggested that all the films prepared in this study effectively inhibited the growth of SMCs. Also, the number of cells for PAT‐DS films was significantly lesser than that of the Ctrl‐DS films. This showed that the PAT released from DS films successfully inhibited the growth of SMCs. The percentage of increase or decrease in the proliferation of SMCs from day 1 to day 5 was determined and is provided in Figure 6(B). Both the Ctrl‐DS and PAT‐DS films significantly inhibited the proliferation of SMCs. Also, the inhibitory rate was significantly greater for PAT‐DS films when compared with Ctrl‐DS films. This shows that the PAT incorporated DS films provide greater inhibitory effect on cell growth than Ctrl‐DS films.
Figure 6.
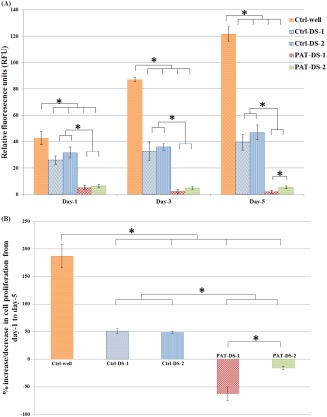
Viability and proliferation of SMCs on 1, 3, and 5 days (A), percentage of increase or decrease of SMC proliferation from day 1 to day 5 (B) for Ctrl‐well, Ctrl‐DS‐1, Ctrl‐DS‐2, PAT‐DS‐1, and PAT‐DS‐2 films (specimen size: 0.5 cm × 0.5 cm). Cells grown in well plate without adding any films is used as control (Ctrl‐well). *Statistical significance at p < 0.05.
The viability of SMCs treated with Ctrl‐DS and PAT‐DS films (specimen size: 1 cm × 1 cm) is shown in Figure 7(A). The dose of DS in Ctrl‐DS films of 1 cm × 1 cm was determined as 118 mg. The doses of DS and PAT in PAT‐DS films of 1 cm × 1 cm were determined as 118 mg and 147 µg, respectively. Similar to the results obtained for the specimen size of 0.5 cm × 0.5 cm, the number of viable cells for all the Ctrl‐DS and PAT‐DS films were significantly lesser than that of Ctrl‐well. However, unlike 0.5 cm × 0.5 cm specimens, no significant difference in the number of viable cells was observed between Ctrl‐DS and PAT‐DS films of 1 cm × 1 cm specimen size. The proliferation of SMCs was also significantly inhibited for all the Ctrl‐DS and PAT‐DS films [Figure 7(B)]. Also, unlike 0.5 cm × 0.5 cm specimens, no significant difference in the proliferation was observed between most of the Ctrl‐DS films and PAT‐DS films of 1 cm × 1 cm. These results suggested that the doses of DS and PAT used in the films play a vital role in determining the degree of inhibition of SMC growth.
Figure 7.
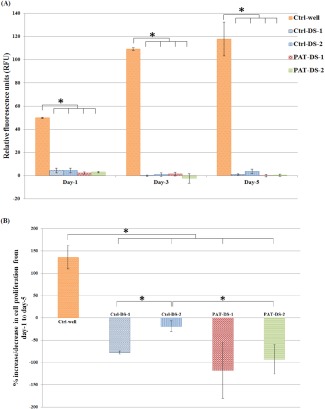
Viability and proliferation of SMCs on 1, 3, and 5 days (A), percentage of increase or decrease of SMC proliferation from day 1 to day 5 (B) for Ctrl‐well, Ctrl‐DS‐1, Ctrl‐DS‐2, PAT‐DS‐1, and PAT‐DS‐2 films (specimen size: 1 cm × 1 cm). Cells grown in well plate without adding any films is used as control (Ctrl‐well). *Statistical significance at p < 0.05.
SMC morphology
Figure 8 shows the fluorescence microscopy images of FDA‐stained SMCs in Ctrl‐well as well as the cells treated with Ctrl‐DS and PAT‐DS films (0.5 cm × 0.5 cm). The cells in the Ctrl‐well were elongated and showed its characteristic spindle‐shape with a typical hill‐and‐valley morphology. The cells treated with Ctrl‐DS films also showed the characteristic spindle shape to a larger extent. However, some cells were discoid (flat circular) in shape. The cells treated with PAT‐DS films showed greater reduction in its number and confluence. Also, the cells were discoid in shape. On day 5, the confluence of SMCs in Ctrl‐well, Ctrl‐DS‐1, Ctrl‐DS‐2, PAT‐DS‐1, and PAT‐DS‐2 was estimated to be 80 to 85%, 35 to 40%, 40 to 45%, < 5%, and 5 to 10%, respectively. These results are in excellent agreement with the quantitative data (SMC viability and proliferation section) to show that both Ctrl‐DS and PAT‐DS films inhibited the growth of SMCs with superior inhibitory effect observed for PAT‐DS films.
Figure 8.
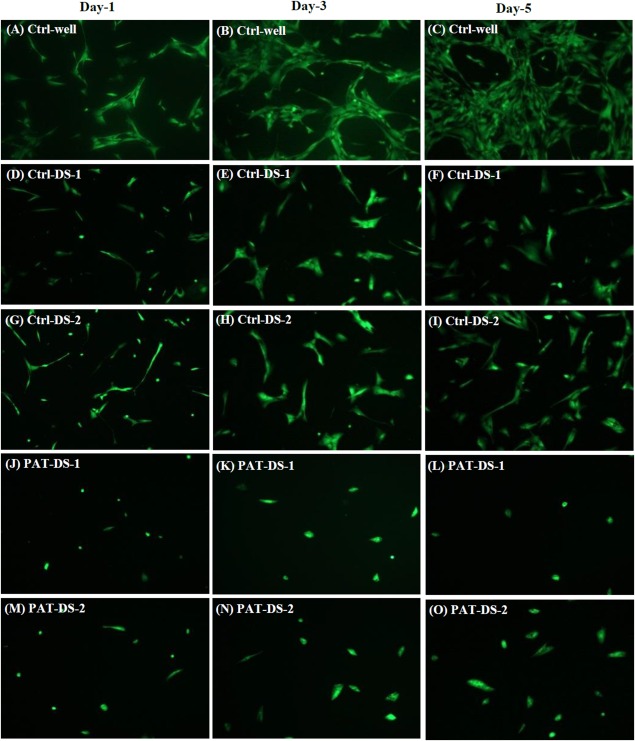
Fluorescent microscopy images of FDA‐stained SMCs on days 1, 3, and 5 for Ctrl‐well (A–C), Ctrl‐DS‐1 (D–F), Ctrl‐DS‐2 (G–I), PAT‐DS‐1 (J–L), and PAT‐DS‐2 (M–O) films (specimen size: 0.5 cm × 0.5 cm).
The fluorescence microscopy images of the FDA‐stained SMCs treated with Ctrl‐DS and PAT‐DS films (1 cm × 1 cm) are provided in Figure 9. There were only very few cells present for any of the Ctrl‐DS or PAT‐DS films. Also, the cells predominantly showed the uncharacteristic discoid shape for all the films. The confluence of SMCs in Ctrl‐well, Ctrl‐DS‐1, Ctrl‐DS‐2, PAT‐DS‐1, and PAT‐DS‐2 on day 5 was estimated to be 80 to 85%, <5%, 5 to 10%, <1%, and <1%, respectively. These results are also in excellent agreement with the quantitative data (SMC viability and proliferation section) to show that both Ctrl‐DS and PAT‐DS films exhibit dose‐dependent inhibitory effect.
Figure 9.
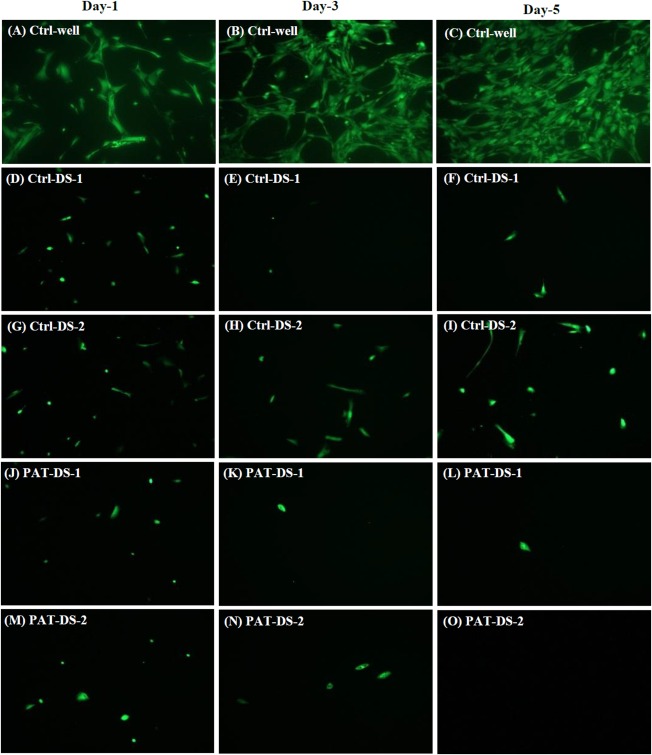
Fluorescent microscopy images of FDA‐stained SMCs on days 1, 3, and 5 for Ctrl‐well (A–C), Ctrl‐DS‐1 (D–F), Ctrl‐DS‐2 (G–I), PAT‐DS‐1 (J–L), and PAT‐DS‐2 (M–O) films (specimen size: 1 cm × 1 cm).
SMC phenotype study
Smooth muscle (SM) α‐actin is a protein present in the cytoplasm of SMCs and plays a vital role in regulating cell shape and movement. The expression of SM α‐actin is strong for the well growing SMCs whereas the expression is weak for the damaged cells.7 Also, the α‐actin filaments are oriented along the cell axis in well growing SMCs whereas the filaments are disarranged in damaged SMCs.7 The immunofluorescence microscopy images of SMCs in control wells as well as the cells treated with Ctrl‐DS and PAT‐DS films are provided in Figure 10. The cells in the Ctrl‐well showed strong SM α‐actin expression [Figure 10(A–D)]. Also, the filaments were oriented along the cell axis. The cells showed similar strong expression of SMC α‐actin for the Ctrl‐DS films of 0.5 cm × 0.5 cm [Figure 10(E–H)]. However, the expression was poor for the Ctrl‐DS films of 1 cm × 1 cm [Figure 10(M–P)]. The cells treated with PAT‐DS films, irrespective of the specimen size, showed weaker SM α‐actin expression with the filaments disarranged in circumferential orientation [Figure 10(I‐L,Q–T)]. Also, some of the cells treated with PAT‐DS films (1 cm × 1 cm) even showed the complete absence of SM α‐actin with only the nucleus present [Figure 10(Q–T)]. These results further confirmed that the Ctrl‐DS films, especially at higher doses, can show strong inhibitory effect. The PAT‐DS films, irrespective of the doses, were effective in greatly inhibiting SMC growth.
Figure 10.

Immunofluorescent microscopy images of HASMCs on day 3 for Ctrl‐well (A–D), Ctrl‐DS‐1 (E, F, M, N), Ctrl‐DS‐2 (G, H, O, P), PAT‐DS‐1 (I, J, Q, R), and PAT‐DS‐2 (K, L, S, T) films of 0.5 cm × 0.5 cm (E–L) and 1 cm × 1 cm (M–T). The cells in the images were stained for smooth muscle α‐actin.
PAT‐DS coatings on balloons
Figure 11(A–C) and Figure 11(D–F) shows the SEM images of bare balloons (without PAT‐DS coating) in inflated and deflated positions, respectively. The images of inflated position show that the balloons are fully expanded whereas the images of deflated position show the flaps of balloon due to deflation. Figure 11(G–I), Figure 11(J–L), and Figure 11(M–O) shows the SEM images of as‐coated, deflated, and inflated positions of PAT‐DS coated balloons with low dose of PAT incorporated, respectively. These images showed that the PAT‐DS coating was uniform, smooth, and homogeneous on the balloons. The integrity of PAT‐DS coating on the balloons was well‐maintained without delamination, crack formation, or any mechanical defects when the balloons were either deflated or inflated. Similar results were also observed for PAT‐DS coatings on the balloons with medium and high doses of PAT incorporated (Figure 12). Figure 13(A–C) shows the cross‐sectional SEM images of PAT‐DS coated balloons. The thickness of PAT‐DS coatings were determined as 122 ± 6 µm, 144 ± 10 µm, and 148 ± 22 µm for low, medium, and high doses of PAT incorporated, respectively.
Figure 11.
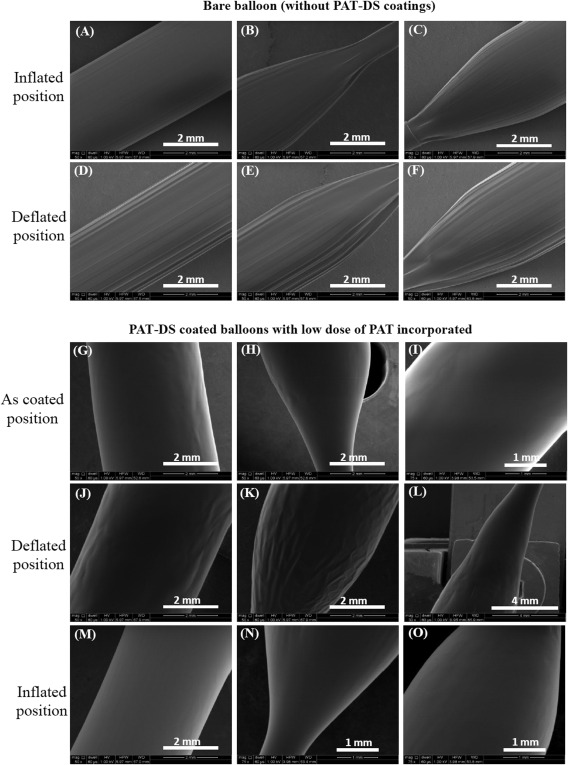
SEM images of bare balloon (A–F), and PAT‐DS coated balloons with low dose of PAT incorporated (G–O). The images were acquired at as‐coated, defltated, and inflated positions of the balloons.
Figure 12.
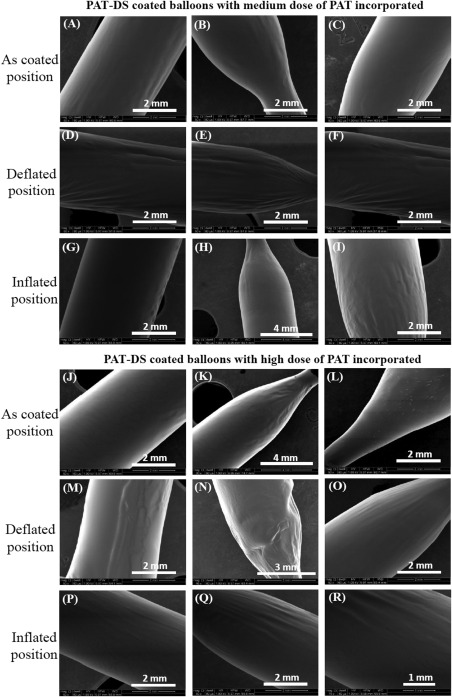
SEM images of PAT‐DS coated balloons with medium dose of PAT (A–I), and high dose of PAT (J–R) incorporated. The images were acquired at as‐coated, deflated, and inflated positions of the balloons.
Figure 13.
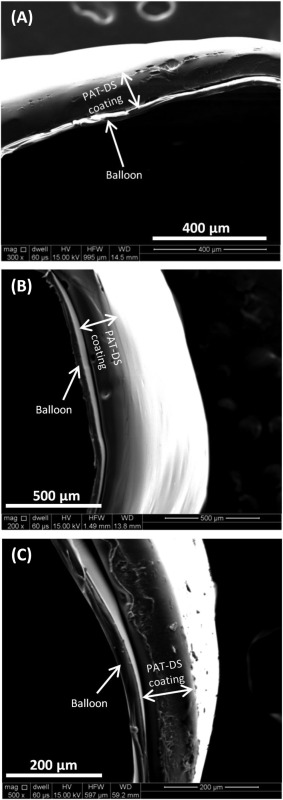
SEM images of cross‐sections of PAT‐DS coated balloons with low (A), medium (B), and high (C) doses of PAT incorporated.
Drug release from PAT‐DS coated balloons
The standard time frame required for drug transfer from the balloons for treating peripheral vascular disease is 3 min.4 Therefore, the balloon inflations of up to 180 s are recommended for peripheral artery devices.4 Hence, we have used 3 min as the typical time for balloon inflation and treatment (after the initial 1 min time point—which is the typical time period for balloon tracking) in the drug release studies conducted using PAT‐DS coated balloons.
The total amount PAT loaded on the PAT‐DS coated balloons for low, medium and high doses of PAT incorporated were determined as 0.7 ± 0.03 µg/mm2, 1.2 ± 0.1 µg/mm2, and 2.2 ± 0.2 µg/mm2, respectively. The cumulative release and the percentage of PAT released at different time points are provided in Figure 14(A,B), respectively. Only 10 to 20% of the total drug loaded was released for up to 1 min. Then, ∼80% of the total drug loaded was released between 1 min and 4 min (for a total time interval of 3 min). After 4 min, only 5 to 10% of the drug was retained. This suggested that the PAT‐DS coatings have the potential to be used in DCBs to reduce early drug loss during the typical time period of balloon tracking (up to 1 min) and then to immediately deliver a clinically relevant dose of drug during the typical time period of balloon inflation and treatment (from 1 min to 4 min).
Figure 14.
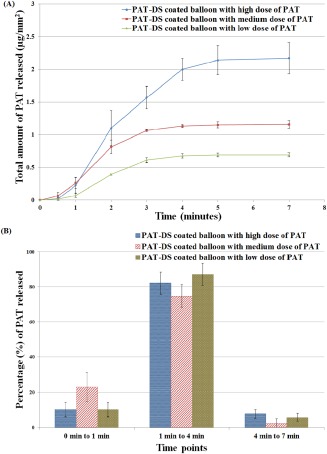
Cumulative PAT released (µg/mm2) (A), and percentage of PAT released (B) from PAT‐DS coated balloons with low, medium, and high doses of PAT incorporated.
DISCUSSION
DS is a biocompatible polymer with an excellent anti‐thrombogenic property.18 Dextran based therapeutics are commonly used in clinics as anti‐thrombotic agents. The quickly water‐soluble yet a controlled dissolution property of DS makes it a promising material for coating DCBs. In this study, PAT incorporated DS films were prepared by solvent‐casting method using solvents such as water/ethanol and water/DMSO. Scheller et al.19 showed that the type of solvent used for coating PAT on the balloon can have a significant effect on the inhibition of neointimal hyperplasia. In our study, significant differences in tensile strength and modulus were observed between the PAT‐DS films prepared by water/ethanol and water/DMSO. However, no significant differences in the film elasticity, drug elution or cell response were observed between the films prepared by different solvent combinations. Previous studies have shown that the PAT coating on the balloon provided a dose‐dependent effect on the inhibition of neointimal hyperplasia.19 In this study, both the control DS and PAT‐DS films have shown a dose‐dependent inhibitory effect. Although the higher dose of DS can provide an inhibitory effect, which is comparable to that of PAT‐DS, the incorporation of PAT is still essential for providing long‐term inhibitory effect especially in in vivo conditions. This is due to (a) rapid uptake of PAT in the vessel wall because of the lipophilic nature of the drug; (b) prolonged retention of PAT in the vessel wall because of the hydrophobic nature of the drug.2 Also, once the DS is released, it could be washed away in the blood stream due to its hydrophilic properties. Hence, the use of PAT in DCBs is crucial for providing inhibitory effect over a long period of time.2 , 20 , 21
Although there was a difference in the thickness observed between the two‐dimensional (2D) PAT‐DS films (600–800 µm) and PAT‐DS coatings (120–150 µm) on the balloons, it did not affect the mechanical or drug release properties of PAT‐DS coatings on the balloons. The integrity of PAT‐DS coatings on balloons was well‐maintained without any mechanical defects occurred when the balloons were either deflated or inflated. This suggested that the PAT‐DS coatings have required mechanical properties to withstand the stress created during balloon inflation or deflation. The drug release studies of PAT‐DS coated balloons showed that only a minimal amount (10–20%) of the total drug loaded was released during the typical time period of balloon tracking (1 min) while most of the remaining drug (∼80%) was released during the typical time period of balloon inflation and treatment (from 1 min to 4 min, for a total time interval of 3 min). This was in agreement with the drug release profiles observed for 2D PAT‐DS films, which were totally dissolved in 5 min. The total amount of drug loaded on the balloons can be adjusted by varying the concentration of drug in the coating solutions used. Hence, irrespective of the coating procedure (dip‐coating followed by dehydration and rapid drying vs. solvent casting) and coated surface (balloons vs. glass petri dish), the PAT‐DS platform showed promising results for applications in DCBs.
Limitations of the study
Under in vivo conditions, the passage to the site of lesion will be characterized by harsh mechanical conditions. Such effect is not investigated in this study. However, our future studies using animal models will provide information regarding the efficacy of PAT‐DS coated balloons in in vivo conditions.
CONCLUSIONS
In this study, PAT‐DS films, and PAT‐DS coatings on balloons were prepared, characterized, and investigated for their applications in DCBs. A solvent‐casting method was used to prepare PAT‐DS films using solvents, water/ethanol and water/DMSO. SEM showed that all the PAT‐DS films prepared were smooth and homogeneous with PAT molecularly dispersed in the DS matrix. FT‐IR showed that the PAT was successfully incorporated into the bulk of DS with negligible amount of drug present on the film surface. DSC showed that the PAT was present in amorphous form inside the DS matrix. Although some differences in the tensile properties were observed between the films prepared by ethanol and DMSO, all the films showed excellent ductility, which is an important property for using this material as a coating for DCBs. Both the Ctrl‐DS and PAT‐DS films inhibited the growth of SMC in a dose‐dependent manner with the superior inhibitory effect observed for PAT‐DS films. The PAT‐DS coatings on the balloon catheters showed an excellent integrity without any mechanical defects observed when the balloons were either deflated or inflated. A PAT dose of up to 2.2 µg/mm2 was loaded on the balloons using DS platform. Only 10 to 20% of the total drug loaded was released from the PAT‐DS coated balloons during the typical time period of balloon tracking (1 min). This was immediately followed by a delivery of ∼80% of the total drug loaded during the typical time period of balloon inflation and treatment (from 1 min to 4 min). Thus this study demonstrated the use of PAT‐DS as a drug delivery platform for DCBs.
How to cite this article: Lamichhane S, Anderson J, Remund T, Kelly P, Mani G. 2016. Dextran sulfate as a drug delivery platform for drug‐coated balloons: Preparation, characterization, in vitro drug elution, and smooth muscle cell response. J Biomed Mater Res Part B 2016:104B:1416–1430.
The copyright line for this article was changed on 03 December 2015 after original online publication.
REFERENCES
- 1. Thukkani AK, Kinlay S. Endovascular intervention for peripheral artery disease. Circ Res 2015;116:1599–1613. [DOI] [PMC free article] [PubMed] [Google Scholar]
- 2. Waksman R, Pakala R. Drug‐eluting balloon: the comeback kid? Circ Cardiovasc Interv 2009;2:352−358. [DOI] [PubMed] [Google Scholar]
- 3. De Labriolle A, Pakala R, Bonello L, Lemesle G, Scheinowitz M, Waksman R. Paclitaxel‐eluting balloon: from bench to bed. Catheter Cardiovasc Interv 2009;73:643−652. [DOI] [PubMed] [Google Scholar]
- 4. Byrne RA, Joner M, Alfonso F, Kastrati A. Drug‐coated balloon therapy in coronary and peripheral artery disease. Nat Rev Cardiol 2014;11:13–23. [DOI] [PubMed] [Google Scholar]
- 5. Pastormerlo LE, Ciardetti M, Trianni G, Ravani M, Shlueter M, Vaghetti M, Coceani M, Rizza A, Berti S, Palmieri C. Drug eluting balloon: A multipurpose tool for coronary revascularization with optimal long‐term follow‐up results. J Interv Cardiol 2014;27:574–579. [DOI] [PubMed] [Google Scholar]
- 6. Lancaster S, Kakade S, Mani G. Microrough cobalt‐chromium alloy surfaces for paclitaxel delivery: preparation, characterization, and in vitro drug release studies. Langmuir 2012;28:11511–11526. [DOI] [PubMed] [Google Scholar]
- 7. Lamichhane S, Gallo A, Mani G. A polymer‐free paclitaxel eluting coronary stent: effects of solvents, drug concentrations and coating methods. Ann Biomed Eng 2014;42:1170−1184. [DOI] [PubMed] [Google Scholar]
- 8. Lamichhane S, Lancaster S, Thiruppathi E, Mani G. Interaction of endothelial and smooth muscle cells with cobalt‐chromium alloy surfaces coated with paclitaxel deposited self‐assembled monolayers. Langmuir 2013;29:14254–14264. [DOI] [PubMed] [Google Scholar]
- 9. Kakade S, Mani G. A comparative study of the effects of vitamin C, sirolimus, and paclitaxel on the growth of endothelial and smooth muscle cells for cardiovascular medical device applications. Drug Des Devel Ther 2013;7:529–544. [DOI] [PMC free article] [PubMed] [Google Scholar]
- 10. Cakic M, Nikolic G, Ilic L, Stankovic S. Synthesis and FT‐IR characterization of some dextran sulphates. Chem Ind Chem Eng Quart 2005;11:74–78. [Google Scholar]
- 11. Nikolic GS, Cakic M, Mitic Z, Ilic L. Deconvoluted Fourier‐transform LNT‐IR study of coordination copper (II) compounds with dextran derivatives. Russ J Coord Chem 2008;34:322–328. [Google Scholar]
- 12. Huang P, Dong A, Caughey WS. Effects of dimethyl sulfoxide, glycerol, and ethylene glycol on secondary structures of cytochrome c and lysozyme as observed by infrared spectroscopy. J Pharm Sci 1995;84:387–392. [DOI] [PubMed] [Google Scholar]
- 13. Gallo A, Mani G. A stent for co‐delivering paclitaxel and nitric oxide from abluminal and luminal surfaces: Preparation, surface characterization, and in vitro drug release studies. Appl Surf Sci 2013;279:216–232. [Google Scholar]
- 14. de Raucourt E, Mauray S, Chaubet F, Magia‐Revel O, Jozefowicz M, Fischer AM. Anticoagulant activity of dextran derivatives. J Biomed Mater Res 1998;41:49–57. [DOI] [PubMed] [Google Scholar]
- 15. Thiruppathi E, Mani G. Vitamin‐C delivery from CoCr alloy surfaces using polymer‐free and polymer‐based platforms for cardiovascular stent applications. Langmuir 2014;30:6237–6249. [DOI] [PubMed] [Google Scholar]
- 16. Stoebner SE, Mani G. Effect of processing methods on drug release profiles of anti‐restenotic self‐assembled monolayers. Appl Surf Sci 2012;258:5061–5072. [Google Scholar]
- 17. Chenier PJ. Survey of Industrial Chemistry Plastics. New York: Plenum Publishing Corporation; 2002. [Google Scholar]
- 18. Baba M, Pauwels R, Balzarini J, Arnout J, Desmyter J. Mechanism of inhibitory effect of dextran sulfate and heparin on replication of human immunodeficiency virus in vitro . Proc Natl Acad Sci USA 1988;85:6132–6136. [DOI] [PMC free article] [PubMed] [Google Scholar]
- 19. Scheller B, Speck U, Abramjuk C, Bernhardt U, Bohm M, Nickenig G. Paclitaxel balloon coating, a novel method for prevention and therapy of restenosis. Circulation 2004;110:810–814. [DOI] [PubMed] [Google Scholar]
- 20. Mori T, Kinoshita Y, Watanabe A, Yamaguchi T, Hosokawa K, Honjo H. Retention of paclitaxel in cancer cells for 1 week in vivo and in vitro. Cancer Chemother Pharmacol 2006;58:665–672. [DOI] [PubMed] [Google Scholar]
- 21. Granada JF, Stenoien M, Buszman PP, Tellez A, Langanki D, Kaluza GL, Leon MB, Gray W, Jaff MR, Schwartz RS. Mechanisms of tissue uptake and retention of paclitaxel‐coated balloons: Impact on neointimal proliferation and healing. Open Heart 2014;1:e000117. [DOI] [PMC free article] [PubMed] [Google Scholar]