

Abstract
Background
Alcohol research may benefit from controlled and validated picture sets. We have constructed the Amsterdam Beverage Picture Set (ABPS), which was designed for alcohol research in general and cognitive bias measurement and modification in particular. Here, we first formulate a position on alcohol stimulus validity that prescribes that alcohol‐containing pictures, compared to nonalcohol‐containing pictures, should induce a stronger urge to drink in heavy drinkers than in light drinkers. Because a perceptually simple picture might induce stronger cognitive biases but the presence of a drinking context might induce a stronger urge to drink, the ABPS contains pictures with and without drinking context. By limiting drinking contexts to simple consumption scenes instead of real‐life scenes, complexity was minimized. A validation study was conducted to establish validity, to examine ABPS drinking contexts, and to explore the role of familiarity, valence, arousal, and control.
Methods
Two hundred ninety‐one psychology students completed the Alcohol Use Disorders Identification Test, as well as rating and recognition tasks for a subset of the ABPS pictures.
Results
The ABPS was well‐recognized, familiar, and heavy drinkers reported a greater urge to drink in response to the alcohol‐containing pictures only. Alcohol presented in drinking context did not elicit a stronger urge to drink but was recognized more slowly than alcohol presented without context.
Conclusions
The ABPS was found to be valid, although pictures without context might be preferable for measuring cognitive biases than pictures with context. We discuss how an explicit approach to picture construction may aid in creating variations of the ABPS. Finally, we describe how ABPS adoption across studies may allow more reproducible and comparable results across paradigms, while allowing researchers to apply picture selection criteria that correspond to a wide range of theoretical positions. The latter is exemplified by ABPS derivatives and adoptions that are currently under way.
Keywords: Implicit Cognitions, Cognitive Bias Modification, Alcohol, Pictures, Standardization
Dual process models of addiction attempt to explain why people persevere in addictive behaviors while consciously knowing that the long‐term consequences may be dire, by proposing that this perseverance is partly driven by implicit or automatically activated cognitive processes that are biased “toward” drug consumption (Stacy and Wiers, 2010). Compared to explicit processes, implicit processes can be characterized by being relatively inaccessible to conscious reflection or control and being relatively fast (De Houwer et al., 2009). Implicit cognitive processes can be measured with several indirect or implicit tasks. For example, an approach bias can be assessed with the Stimulus Response Compatibility task (De Houwer et al., 2001) and with the Approach Avoidance Task (Rinck and Becker, 2007), implicit memory associations with the Implicit Association Task (Greenwald et al., 1998), and attentional bias with the Visual Probe Test (VPT; MacLeod et al., 1986). In addition, recent research has demonstrated that these processes may be directly targeted with interventions that are collectively called Cognitive Bias Modification (CBM). In some studies, CBM has shown promise to improve effectiveness of interventions to abstain or reduce use (for a review, see Wiers et al., 2013).
In these measurements and interventions, pictures of beverages containing alcohol (henceforth called “alcohol pictures”) and pictures of beverages that do not contain alcohol (henceforth called “nonalcohol pictures”) are presented to participants in various computerized procedures. A multitude of tasks exist to measure implicit processes in addiction (Field et al., 2004; Wiers et al., 2002, 2009), but relatively little research examined the pictures used in these paradigms. In this paper, we formulate some considerations for valid and effective beverage pictures in general and for CBM in particular. Based on these considerations, we introduce the Amsterdam Beverage Picture Set (ABPS) and report the results of a validation study.
To the best of our knowledge there is no explicit theory on stimulus validity, but there are various theories on test validity. A good starting point may be the position of Borsboom and colleagues (2004, p. 1061), which states that “a test is valid for measuring an attribute if (a) the attribute exists and (b) variations in the attribute causally produce variations in the measurement outcomes.” This position applies well to the kind of response time (RT) tasks used for measuring cognitive biases: substance‐related and substance‐unrelated stimuli are presented to a participant, causing variation in a mental construct, which then is measured. For example, in an alcohol visual probe task, we presuppose the existence of an attribute named selective attention for alcohol. Variation in selective attention is caused by presenting alcohol and nonalcohol stimuli. When a participant has an attentional bias toward alcohol, his attention is drawn stronger by alcohol stimuli than by nonalcohol stimuli. Attentional bias can then be measured by comparing RTs to a probe that replaces one of these stimuli. Given this framework, we can conceptualize stimulus validity as follows: stimuli are valid for influencing an attribute if variations in the stimuli causally produce variations in the attribute.
While the concept of stimulus validity (the ability to cause variation in an attribute) can be separated from the concept of test validity (the ability to measure variation in an attribute), they are not unrelated. For example, on one hand, relatively high valence and arousal have been regarded as evidence for stimulus validity (Grüsser et al., 2002; Nees et al., 2012), since these affective responses are in line with liking and wanting according to the incentive sensitization model (Robinson and Berridge, 2003). On the other hand, affective responses have also been regarded as confounds that interfere with the alcohol‐specific content of the pictures and hence are best to be controlled (Pulido et al., 2010). For instance, increased arousal in response to alcohol pictures may be due to a feeling of unease instead of desire (Robbins and Ehrman, 1992). The latter example serves to illustrate that construction of a standardized picture set for use in a wide range of paradigms may be complicated by paradigm‐specific demands and theory‐laden perspectives on stimulus validity.
To address these complications, we have constructed a large picture set. To establish validity of this picture set we chose a criterion that we assumed is relatively universal and uncontroversial, namely that a valid alcohol picture should elicit a greater urge to drink in heavy drinkers than in light drinkers (Drobes, 2002; George et al., 2001; Grüsser et al., 2000, 2002; Lee et al., 2006; Nees et al., 2012). In addition, we state that relative to alcohol, a valid nonalcohol picture should elicit a relatively weaker, but not a negative urge to drink in heavy drinkers compared to light drinkers. Via the latter criterion we emphasize that the variation in urge to drink caused by alcohol and nonalcohol pictures is due to an appetitive response toward alcohol. If, for example, heavy drinkers would show a weaker urge to drink in response to nonalcohol than light drinkers would, but a similar urge in response to alcohol, then variation in the pictures would indeed cause variation in urge to drink, but this would more likely be due to aversive responses toward the nonalcohol than due to appetitive responses toward alcohol. Finally, note that these hypotheses assume that the attribute “urge to drink” is more easily influenced in heavy drinkers than light drinkers.
Besides urge to drink, pictures were rated on various aspects that have been used in prior validity research. Beverages were rated on familiarity (Pulido et al., 2010; Tibboel et al., 2010) and both self‐reported and forced‐choice recognition (Grüsser et al., 2000; Pulido et al., 2010). Additionally, pictures were rated on each of the 3 dimensions outlined in the International Affective Pictures System (Lang et al., 2005): valence, arousal, and control. Familiarity, recognition, and affective value are not used to assess validity, but we do acknowledge their relevance by providing summary scores on all these measures for each of the ABPS pictures. This way, a researcher using the ABPS can apply his preferred picture selection criteria, for instance by equalizing or maximizing differences in affective values.
The ABPS has been designed to be particularly suitable for CBM research. A picture feature that appears to be particularly relevant to CBM is the presence or absence of a drinking context. As yet, the absence or presence of a drinking context has mainly been operationalized as bland backgrounds or real‐life scenes (wherein real‐life is an umbrella term for any nonstudio picture, such as a picture shot inside of a bar or at a party), respectively. In heavy drinkers, self‐reported craving (Lee et al., 2006) was found to be more strongly affected by a beverage in a drinking context than a beverage in front of a bland background, giving rise to the suggestion that real‐life scenes seem most effective in eliciting an urge to drink. Note that Nees and colleagues (2012) have drawn a similar conclusion based physiological measures of valence and arousal instead of self‐reported craving. However, real‐life scenes are also more complex; findings with eye fixation times (but less so with RT) have led to the suggestion that complex pictures may require more cognitive processing, and so interfere with visual probe like attentional bias measures (Miller and Fillmore, 2010). Hence, while a real‐life scene may be most effective for triggering urges to drink (Lee et al., 2006), a bland background may be most effective for assessing attentional bias (Miller and Fillmore, 2010).
The ABPS features beverages in front of a bland background with or without drinking attributes or a person. Each of the beverages was displayed in 6 contexts of which 3 were passive (only displaying the beverage) and 3 were active (displaying the beverage being served, opened, or held/consumed) (see Fig. 1). The active pictures were aimed at providing a drinking context that may trigger a relatively strong urge to drink, while keeping complexity to a minimum, thus facilitating the assessment of implicit cognitive processes such as attentional bias. To test the hypothesis that active pictures and passive pictures are similarly perceptually complex, in the current study, recognition speeds were compared across drinker groups and contexts.
Figure 1.
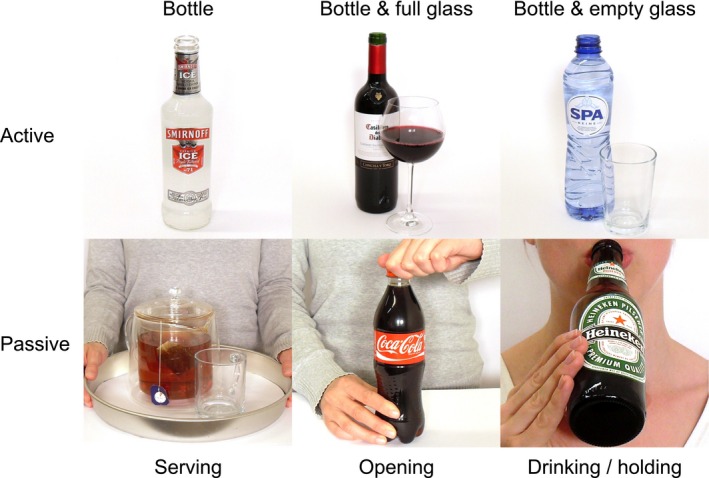
Examples of Amsterdam Beverage Picture Set pictures in each of the 3 active and passive contexts.
In summary, we expected that the alcohol pictures induced a stronger urge to drink in heavy drinkers than in light drinkers. We expected that the nonalcohol pictures induced a relatively weaker, but not negative urge to drink in heavy drinkers compared to light drinkers. Examining the effects of context, we expected a stronger urge to drink in heavy drinkers in response to active alcohol pictures than passive alcohol pictures, but similar recognition speeds. Exploratively, we examined the role of familiarity, recognizability as alcohol or nonalcohol, and affective values in terms of valence, arousal, and control.
Materials and Methods
Participants
Participants were 291 first‐year psychology students from the University of Amsterdam that took part in the study for course credits. Only participants that had drunk any alcohol the past year were included.
Design
Each participant completed 96 trials in a recognition and rating task. During each trial 1 picture of the ABPS was presented. Each participant viewed 8 alcohol and 8 nonalcohol beverages, displayed in each of the 3 active contexts (with beverage in a full bottle, full bottle with empty glass, and bottle with full glass) and each of the 3 passive contexts (with beverage being served, opened, and held/consumed). For the 8 alcohol beverages, 2 exemplars were picked randomly from each of the 4 alcohol types (beer, wine, spirits, and alcopops). For the nonalcohol beverages, exemplars were picked randomly from each of the 3 nonalcohol beverage types (soda, water, and miscellaneous) such that 2 types were represented by 3 beverages and 1 type with 2, making a total of 8.
Measures
Alcohol Use Disorders Identification Test
The Alcohol Use Disorders Identification Test (AUDIT; Babor et al., 2001; Saunders et al., 1993) was used to distinguish heavy from light drinking. In the general population a cutoff of 8 has been recommended to identify problematic drinking (Babor et al., 2001). In students, cutoffs as high as 11 have been recommended (Fleming et al., 1991). Given the prevalence of heavy drinking in the current sample (mean AUDIT was 10.1), relatively heavy and light drinkers were distinguished via median split.
Recognition Task
In the recognition task, participants pressed the “Q” key on the keyboard if a picture showed a beverage containing alcohol, and the “P” key if a picture showed a beverage without alcohol. The mapping of keys to alcohol and nonalcohol responses was counterbalanced across participants. Participants were requested to respond as quickly and accurately as possible. Each trial started with a gray fixation cross presented for 800 ms, after which it turned black for 200 ms. Next, the beverage picture was presented for 500 ms. After each response, the screen was blank for 500 ms, until the next trial appeared. For each participant, proportion of correct responses and mean RTs of correct responses were calculated from task results.
Rating Task
In the rating task, a picture was displayed at full size for 1.5 seconds, after which the picture zoomed out while on the side a panel appeared with 6 items. Three items concerned the affective ratings for valence, arousal, and control. For each of these items, 9 answer options were provided, with Self‐Assessment Manikins above every other answer option (valence manikins based on Suk, 2006, p. 206; arousal and control based on Lang, 1980). Answers were scored from −4 on the left side of the scale to 4 on the right side, wherein negative values represented more negative affect, relaxation, and being controlled, while positive values represented more positive affect, excitement, and having control. Urge to drink was assessed via the question: “How much would you like to drink this drink today?” with a 9‐point bipolar scale ranging from “absolutely not” (scored −4) to “very much” (scored 4). Finally, 2 items assessed familiarity by inquiring whether the participant had ever consumed this beverage and whether the participant knew this beverage. The latter 2 items were answered dichotomously; yes or no. Mean ratings of desire to drink and affective responses were calculated, as well as proportion of yes answers on familiarity items.
Procedure
The validation study was part of a larger battery of psychological tests, administered in 4 sessions, with 1 ensuing each week. The sample was randomly split in 3 groups, with participants in each group simultaneously taking part in each session in a large classroom. During the first session the AUDIT was administered. During each session, 24 pictures were rated, randomized such that each session contained an equal number of alcohol and nonalcohol pictures. Participants first performed the recognition task and then the rating task.
Data Analysis
First, participants were divided into a light drinking and heavy drinking group based on their AUDIT scores. Response times in recognition task, and desire to drink and affective ratings in rating task were subjected to mixed analyses of variance (ANOVAs) with between‐subject factors: drinking (light drinkers vs. heavy drinkers), and within‐subject factors: alcohol (alcohol vs. nonalcohol beverage) and context (active vs. passive). Hypotheses were formulated in terms of main and interaction ANOVA effects, with corresponding follow‐up tests if interactions were significant with an alpha of 0.05. To compare our categorization of heavy and light drinkers with an interpretation of AUDIT score as continuous variable, main hypotheses on urge to drink and explorations on affective value were also examined via Pearson correlations and linear regressions. Percentages correct in recognition task and percentages of yes on familiarity items were generally high, so these were subjected to Wilcoxon and Mann–Whitney tests.
Results
Descriptives
Of the 291 participants that completed the experiment, 12 were dropped for reporting not having consumed any alcohol the past year in the AUDIT. Of the remaining participants, 193 were female, while 86 were male. Age ranged from 17 to 35 years (M = 19.5, SD = 2.2). Table 1 shows descriptives of each of the measures administered during the recognition and rating tasks. AUDIT scores significantly differed between men and women, t(277) = 4.56, p < 0.001, d = 0.59; men had a mean AUDIT score of 12.0 (SD = 4.7), and women a score of 9.2 (SD = 4.8). Based on items 1 and 2 of the AUDIT we constructed a measure for average number glasses of alcohol consumed every week. Men (M = 14.0, SD = 11.0) and women (M = 7.6, SD = 6.9) differed significantly in weekly drinking. Weekly alcohol consumption was strongly correlated with AUDIT score (r = 0.69, p < 0.001). Participants were classified as heavy or light drinkers based on the overall median of AUDIT scores, which was 10. Because of structural differences of AUDIT scores between men and women, the split yielded unequal numbers of men and women in the heavy and light drinker groups: For men, 63 were classified as heavy and 23 as light, while for women, 81 were classified as heavy and 112 as light. To test the validity of the median split across genders, all succeeding ANOVAs included gender as factor, the effects of which have been reported in a separate section.
Table 1.
Descriptives of the Measures Administered in the Rating and Recognition Tasks
| Task | Recognition | Rating | ||||||
|---|---|---|---|---|---|---|---|---|
| measure | RT in ms | Proportion correct | Urge to drink | Know drink | Ever consumed | Valence | Arousal | Control |
| mean (SD) | 639.26 (87.27) | 0.94 (0.04) | 0.10 (1.16) | 0.96 (0.07) | 0.90 (0.10) | 1.43 (1.19) | −1.99 (1.47) | −2.04 (1.57) |
RT, response time.
Picture Validity
To test whether heavy drinkers felt a stronger urge to drink in response to alcohol pictures than light drinkers, we examined the interaction between drinker group (heavy vs. light) and beverage (alcohol vs. nonalcohol) on urge to drink. This interaction was significant, F(1, 275) = 15.9, p < 0.001, = 0.055. In line with our hypothesis, heavy drinkers reported a stronger urge to drink (M = −0.42, SD = 1.42) in response to the alcohol pictures than light drinkers did (M = −1.39, SD = 1.46), F(1, 275) = 14.8, p < 0.001, = 0.051. Simple comparisons between heavy and light drinkers revealed this difference to have a Cohen's d of 0.677. Also in line with our hypothesis, heavy drinkers did not report a stronger urge to drink in response to the nonalcohol (M = 0.97, SD = 1.43) pictures than light drinkers (M = 1.21, SD = 1.40), F(1, 275) = 0.715, p = 0.398 (Fig. 2). In line with ANOVA results, the correlation between AUDIT score and average difference in urge between alcohol and nonalcohol pictures was 0.36, p < 0.001.
Figure 2.
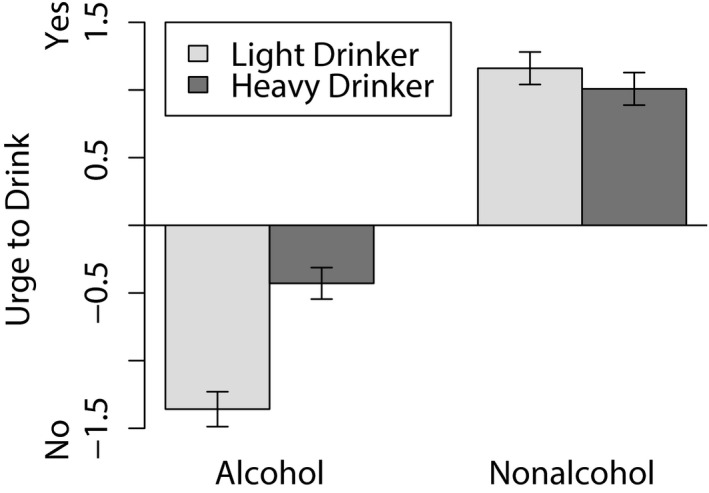
Means and standard errors of urge to drink of light and heavy drinkers in response to alcohol and nonalcohol pictures during rating task.
Picture Context
To test the hypotheses on active and passive pictures, we examined the 3‐way interaction between drinker group (heavy vs. light drinker), beverage (alcohol vs. nonalcohol), and context (active vs. passive) on urge to drink in the rating task and RT in the recognition task. In contrast with our hypotheses, no significant interaction was found on urge to drink, F(1, 275) = 3.35, p = 0.068, indicating that heavy drinkers did not report a stronger urge to drink in response to active alcohol pictures than passive alcohol pictures, as compared to light drinkers. In addition, there were no main or interaction effects that involved context, indicating that the overall pattern of urge to drink in response to the ABPS across drinker groups and beverages, was unaffected by context. Regarding RT in the recognition task, there was a main effect of context, F(1, 275) = 92.1, p < 0.001, = 0.251, indicating that, in contrast with our hypotheses, active pictures were recognized more slowly than passive pictures. In addition, there was a beverage × context interaction, F(1, 275) = 9.44, p = 0.002, = 0.033. Follow‐up analyses for active and passive contexts revealed that in the active context, participants responded faster to alcohol than nonalcohol pictures, F(1, 275) = 19.7, p < 0.001, = 0.067, while in the passive context there was no difference in RT between alcohol and nonalcohol pictures, F(1, 275) = 0.612, p = 0.435 (Fig. 3).
Figure 3.
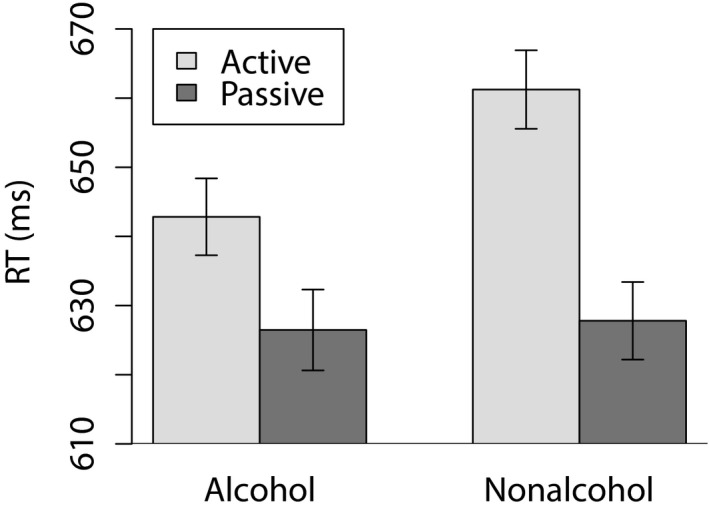
Means and standard errors of response times (RTs) to active and passive, alcohol and nonalcohol pictures during recognition task.
Familiarity and Recognizability
To examine recognition, we inspected percentages correct in the recognition task. As shown in Table 1, these percentages were overall high. In the recognition task, heavy drinkers attained a slightly lower percentage correct (M = 94.5%) for alcohol pictures in the recognition task than light drinkers did (M = 95.6%), U = 8,171, p = 0.019, Z = 2.34, but not so for nonalcohol pictures, U = 9,677, p = 0.949. To examine familiarity, we inspected percentage of beverages known and consumed in the rating task. Heavy drinkers (M = 88.3%) reported having consumed a larger number of the alcohol beverages in the ABPS than light drinkers (M = 80.0%), U = 6,404.5, p < 0.001, Z = 4.95, which was not so for nonalcohol beverages, U = 9,625.5, p = 0.874. Heavy drinkers reported knowing a similar number of the alcohol beverages as light drinkers did, U = 9,102.5, p = 0.328, which was also the case for nonalcohol beverages, U = 9,173.5, p = 0.272.
Affective Value
To examine affective values of the pictures, we tested interactions between drinker group (heavy vs. light) and beverage (alcohol vs. nonalcohol) on affective ratings. No such interactions were found, for valence, F(1, 275) = 2.16, p = 0.143, nor arousal, F(1, 275) = 0.371, p = 0.543, nor control, F(1, 275) = 0.060, p = 0.806. In contrast with ANOVA results, continuous AUDIT scores were significantly correlated with the average difference in valence rating between alcohol and nonalcohol pictures, r = 0.22, p < 0.001. This effect remained in a linear regression of difference in valence rating on AUDIT score, gender, and AUDIT × gender interaction, in which the coefficient for AUDIT score was significant, B = 0.13, t = 5.23, p < 0.001, = 0.09. In line with ANOVA results, AUDIT scores were not significantly correlated with arousal, r = 0.10, p = 0.09, or control, r = −0.06, p = 0.36.
Gender Differences
To examine gender differences, we tested interactions between drinker group (heavy vs. light), beverage (alcohol vs. nonalcohol), and gender (male vs. female) on all continuous dependent variables (i.e., urge to drink, RTs, and affective responses). No such interactions were found, indicating that responses of heavy and light drinkers to alcohol and nonalcohol pictures were similar across men and women. Note though that there were various effects of gender regardless of drinker group. For urge to drink, there was an interaction between gender and beverage, F(1, 275) = 9.85, p = 0.002, = 0.035. Follow‐up analyses revealed that, controlling for drinker group, men (M = −0.35, SD = 1.58) reported a stronger urge to drink than women (M = −1.13, SD = 1.43) in response to alcohol pictures, F(1, 275) = 7.62, p = 0.006, but men and women reported similar desire in response to nonalcohol pictures, F(1, 275) = 0.887, p = 0.347. For valence, there was also an interaction between gender and beverage, F(1, 275) = 7.40, p = 0.007, = 0.026. Follow‐up analyses revealed that, controlling for drinker group, women (M = 2.11, SD = 1.25) reported more positive valence than men (M = 1.61, SD = 1.39) in response to nonalcohol pictures, F(1, 275) = 5.81, p = 0.017, = 0.021, but men and women reported similar valence in response to alcohol pictures, F(1, 275) = 0.065, p = 0.799. There were no significant effects of gender on arousal, control, or RT.
Discussion
We have introduced the ABPS, a stimulus set aimed to be useful for alcohol research in general, and for cognitive bias measurement and modification in particular. The main aim of the current study was to examine the validity of the ABPS as well as the perceptual simplicity of its pictures with and without a drinking context. Additionally, we explored recognizability, familiarity, affective value, and given the differences in drinking behavior between men and women in our sample of college students, differences between genders. Below, we reflect on each of these aims, review our approach for distinguishing between heavy and light drinker groups, limitations of the student sample, and our conceptualization of validity. Finally, we provide a short overview of future developments of the ABPS.
In line with our validation criteria, heavy drinkers reported a stronger urge to drink in response to ABPS pictures that contained alcohol than light drinkers did. Also, as expected, pictures featuring beverages without alcohol elicited a weaker, but not negative difference in urge between heavy and light drinkers. Confirming these findings, in a continuous interpretation of AUDIT score, higher scores were related to higher reported urge to drink in response to alcohol relative to nonalcohol. Thus, given the assumption that “urge to drink” is more easily influenced in heavy drinkers than light drinkers, we conclude that: (i) the ABPS provides valid alcohol stimuli, since variation in the pictures (alcohol vs. nonalcohol) cause variation in urge to drink and (ii) this is due to a appetitive response to the alcohol pictures.
The ABPS was designed to be suitable for cognitive bias measurement and modification. Accordingly, the pictures were developed to be simple, with a minimum of distracting elements. To provide a drinking context, half of the pictures displayed a beverage being operated on (active pictures), while half did not (passive pictures). In line with Lee and colleagues (2006), it was hypothesized that active pictures, by displaying a drinking context, would induce a stronger desire in heavier drinkers. In contrast with Miller and Fillmore (2010), it was hypothesized that active pictures were similarly complex as passive pictures, so active pictures would not be recognized more slowly than passive pictures. Both hypotheses were disconfirmed: active pictures did not induce a stronger urge to drink in heavy drinkers than in light drinkers, and active pictures were recognized more slowly than passive pictures. Hence, the ABPS active pictures did not succeed in being more desirable, nor in being similarly complex as the passive pictures. Based on these findings, the conclusions of Lee and colleagues (2006) could be further qualified, as it might be the social nature of their contexts that is essential to inducing a stronger urge to drink in heavy drinkers. Given the findings on recognition speed, we speculate that not only real‐life scenes (Miller and Fillmore, 2010), but any context at all, may introduce complexity to such a degree that it may attenuate the assessment of attentional bias. However, it should be noted that there were no systematic differences in how heavy and light drinkers responded to the presence and absence of drinking context. Additionally, no measures of implicit cognition were administered, so any conclusions drawn are tentative at best. The current pattern of results was that beverage pictures without context were recognized fastest and most consistently across alcohol and nonalcohol categories, so tentatively, these may be most suitable for implicit cognition measurements.
Exploring recognizability and familiarity, we found that APBS beverages were correctly recognized as containing alcohol and nonalcohol and were familiar. ABPS alcohol pictures were rated as more familiar but recognized worse by heavy drinkers than light drinkers, while nonalcohol pictures were similarly familiar and well‐recognized across heavy and light drinkers. Perceived familiarity may be a confound in sensitive paradigms such as attentional blink (Tibboel et al., 2010) or when figure‐ground asymmetry needs to be considered (Rothermund and Wentura, 2001). However, differences found in this study were relatively small. The online Appendix allows controlling for possible confounds by preselecting stimuli for universal familiarity across drinker groups.
Exploring affective values of the pictures, it was found that across heavy and light drinkers, affective values, both for valence, arousal, and control, were relatively similar for alcohol and nonalcohol pictures. However, when interpreting AUDIT score continuously, higher AUDIT scores were found to be related to higher valence ratings in response to alcohol relative to nonalcohol. We carefully conclude that the ABPS alcohol and nonalcohol pictures have a relatively constant affective value. From a cue reactivity perspective, such consistency may be a desirable characteristic (Grüsser et al., 2002; Pulido et al., 2010). From an incentive sensitization perspective, it is interesting to note that results were not consistent with wanting as indicated by higher arousal and only weakly consistent liking as indicated by higher valence (Grüsser et al., 2002; Nees et al., 2012). One explanation for this difference between the findings with the ABPS and other picture sets might be the absence of real‐life scenes with social components in the ABPS. As indicated by Nees and colleagues (2012), real‐life scenes may contain unique qualities that induce a differential affective response in heavy drinkers. Another explanation is based on the way heavy and light drinkers were distinguished.
Participants generally scored rather high on the AUDIT, as the majority would have been classified as hazardous drinkers when using the commonly used cutoff of 8 (Caetano and Babor, 2006). As an alternative cutoff, a median split was used with a cutoff of 10. Such high cutoffs have indeed been used in student populations (Fleming et al., 1991; Johnsson and Berglund, 2006; Murphy and Garavan, 2011). Since there were structural differences in AUDIT scores between men and women, AUDIT groups were confounded with gender, such that the heavy drinker group contained a higher proportion of men than the light‐drinking group did. However, we do believe the distinction between heavy and light drinkers made in this study via median splits distinguished between 2 degrees of severity of alcohol use in a manner that was consistent across genders. Findings that confirm this belief were that men and women showed systematic differences both on urge to drink and valence in response to alcohol and nonalcohol pictures, but none of these differences were moderated by drinker group. Also, findings with continuous interpretations of AUDIT score were relatively consistent with dichotomized AUDIT scores. Nevertheless, while the large sample of the current study provided relatively high statistical power, the use of a median split may have reduced it somewhat. Indeed, prior studies in college samples did find a positive association between drinking and valence ratings of alcohol pictures when using quantitative drinking data (Pulido et al., 2009), but not with a dichotomized AUDIT score (Billieux et al., 2011).
We have formulated a position on stimulus validity based on the theory of Borsboom and colleagues (2004), by proposing that stimuli are valid for influencing an attribute if variation in the stimuli cause variation in the attribute. We chose “urge to drink” as our criterion attribute because we presupposed this criterion to be relatively uncontroversial and universal. However, there are some conceptual and methodological issues with our position and study design that as yet are unresolved. One issue is that this criterion is not specific for alcohol. More precisely, by comparing urge to drink in response to alcohol and nonalcohol pictures we compare “urge to drink alcohol in response to alcohol pictures” to “urge to drink nonalcohol in response to nonalcohol pictures.” Nonalcohol pictures might well induce an urge to drink alcohol as well, for instance when a heavy drinker consistently drinks alcohol mixed with soda. Hence, a more accurate attribute and corresponding measure might be “urge to drink alcohol.” However, we do believe this does not invalidate our finding; if the nonalcohol pictures would indeed induce a stronger urge to drink alcohol in heavy drinkers, then heavy drinkers would also have reported a stronger urge to drink in response to the nonalcohol pictures. The latter was not the case.
Another limitation concerns our choice of measures in light of the primary aim of the ABPS. The ABPS was primarily developed for research of implicit cognitions, while we used a direct measure to validate the picture set. One could presuppose that a picture of which heavy drinkers do not report that it triggers a stronger urge to drink might nevertheless trigger an attentional bias. However, such a presupposition risks conflating the validity of a measure with the validity of a stimulus. To exemplify, if a VPT using a particular stimulus set would not find a greater attentional bias in heavy drinkers, it is unclear whether this invalidates the existence of alcohol attentional bias, the validity of the VPT as a measure of attentional bias, or the validity of the stimulus set in causing attentional bias. Hence, while validation via a direct measure might be suboptimal, it does prevent the risk of such a conflation.
A more comprehensive assessment of stimulus validity would require comparisons across paradigms. The ABPS (Van Deursen et al., 2013) and its Italian version (Boffo et al., 2015) are currently being used in a cognitive bias measurement and modification study, allowing current findings to be compared with measures of implicit cognition. Furthermore, these studies may answer whether noncontextualized pictures are indeed are most effective to measure and train cognitive biases. Additionally, variations of the ABPS have been constructed for food, tobacco, and cannabis (ongoing studies), using a similar construction procedure as outlined in the online Appendix, where both instructions for construction of such a stimulus set and the stimulus set itself can be found.
In conclusion, the ABPS appears to be a valid picture set for CBM research and application in young adults. The controlled nature of the ABPS is useful in cognitive bias measurement and modification paradigms, especially for feature matching as practiced in visual probe tasks (Bradley et al., 2003), while the large number and variety of beverages allows for stimulus personalization (Fadardi and Cox, 2009; Houben and Wiers, 2007; Tapert et al., 2003) and multisession training (Eberl et al., 2013; Van Deursen et al., 2013; Wiers et al., 2011). Results on stimulus context might indicate that the real‐life characteristics of social scenes might be essential to both induce a stronger urge to drink as well as wanting and liking. Hence, for optimal assessment of cue‐reactivity in relation to physiological reactions or brain responses, pictures with real‐life scenes such as those featured in the Geneva Appetitive Alcohol Pictures (Billieux et al., 2011) and the stimulus set of Pulido and colleagues (2010) may be more suitable. However, any context may delay recognition, thus attenuating the assessment of implicit cognitive processes with reaction time measures. Hence, for those purposes, simple pictures might be most effective. By providing summary scores of the measures administered in the validation study for each of the ABPS pictures, and the general instructions for constructing cultural adaptations, we hope to stimulate the further use and development of controlled stimulus sets such as the ABPS in alcohol and addiction research.
Supporting information
Appendix S1. ABPS manual.
Appendix S2. ABPS descriptions.
Appendix S3. ABPS pictures.
Acknowledgments
We would like to thank Denny Borsboom, Thomas Gladwin, Sarah van den Hee, Tim Janssen, Nihayra Leona, and John (Can) Lokman for their valuable contributions to the ABPS, its validation study, and earlier drafts of this paper. The research leading to these results or outcomes has received funding from the European Union's Seventh Framework Programme (FP7/2007‐2013), under Grant Agreement n° 266813 – Addictions and Lifestyle in Contemporary Europe – Reframing Addictions Project (ALICE RAP – www.alicerap.eu). Participant organizations in ALICE RAP can be seen at http://www.alicerap.eu/about-alice-rap/partner-institutions.html. The views expressed here reflect those of the authors only and the European Union is not liable for any use that may be made of the information contained therein. DSvD and RWW were supported by a VICI grant (453‐08‐001) from the Dutch National Science Foundation, N.W.O. HL was supported by Research Priority Area Yield.
References
- Babor T, Higgins‐Biddle J, Saunders JB, Monteiro MG (2001) The Alcohol Use Disorders Identification Test: Guidelines for Use in Primary Care. 2nd ed World Health Organization, Geneva. [Google Scholar]
- Billieux J, Khazaal Y, Oliveira S, de Timary P, Edel Y, Zebouni F, Zullino D, Van der Linden M (2011) The Geneva Appetitive Alcohol Pictures (GAAP): development and preliminary validation. Eur Addict Res 17:225–230. [DOI] [PubMed] [Google Scholar]
- Boffo M, Pronk T, Wiers RW, Mannarini S (2015) Combining cognitive bias modification training with motivational support in alcohol dependent outpatients: study protocol for a randomised controlled trial. Trials 16:63. [DOI] [PMC free article] [PubMed] [Google Scholar]
- Borsboom D, Mellenbergh GJ, Van Heerden J (2004) The concept of validity. Psychol Rev 111:1061–1071. [DOI] [PubMed] [Google Scholar]
- Bradley BP, Mogg K, Wright T, Field M (2003) Attentional bias in drug dependence: vigilance for cigarette‐related cues in smokers. Psychol Addict Behav 17:66–72. [DOI] [PubMed] [Google Scholar]
- Caetano R, Babor TF (2006) Diagnosis of alcohol dependence in epidemiological surveys: an epidemic of youthful alcohol dependence or a case of measurement error? Addiction 101(Suppl 1):111–114. [DOI] [PubMed] [Google Scholar]
- De Houwer J, Crombez G, Baeyens F, Hermans D (2001) On the generality of the affective Simon effect. Cogn Emot 15:189–206. [Google Scholar]
- De Houwer J, Teige‐Mocigemba S, Spruyt A, Moors A (2009) Implicit measures: a normative analysis and review. Psychol Bull 135:347–368. [DOI] [PubMed] [Google Scholar]
- Drobes DJ (2002) Cue reactivity in alcohol and tobacco dependence. Alcohol Clin Exp Res 26:1928–1929. [DOI] [PubMed] [Google Scholar]
- Eberl C, Wiers RW, Pawelczack S, Rinck M, Becker ES, Lindenmeyer J (2013) Approach bias modification in alcohol dependence: do clinical effects replicate and for whom does it work best? Dev Cogn Neurosci 4:38–51. [DOI] [PMC free article] [PubMed] [Google Scholar]
- Fadardi JS, Cox WM (2009) Reversing the sequence: reducing alcohol consumption by overcoming alcohol attentional bias. Drug Alcohol Depend 101:137–145. [DOI] [PubMed] [Google Scholar]
- Field M, Mogg K, Zetteler J, Bradley BP (2004) Attentional biases for alcohol cues in heavy and light drinkers: the roles of initial orienting and maintained attention. Psychopharmacology 176:88–93. [DOI] [PubMed] [Google Scholar]
- Fleming MF, Barry KL, MacDonald R (1991) The alcohol use disorders identification test (AUDIT) in a college sample. Subst Use Misuse 26:1173–1185. [DOI] [PubMed] [Google Scholar]
- George MS, Anton RF, Bloomer C, Teneback C, Drobes DJ, Lorberbaum JP, Nahas Z, Vincent DJ (2001) Activation of prefrontal cortex and anterior thalamus in alcoholic subjects on exposure to alcohol‐specific cues. Arch Gen Psychiatry 58:345–352. [DOI] [PubMed] [Google Scholar]
- Greenwald AG, McGhee D, Schwartz J (1998) Measuring individual differences in implicit cognition: the implicit association test. J Pers Soc Psychol 74:1464–1480. [DOI] [PubMed] [Google Scholar]
- Grüsser SM, Heinz A, Flor H (2000) Standardized stimuli to assess drug craving and drug memory in addicts. J Neural Transm 107:715–720. [DOI] [PubMed] [Google Scholar]
- Grüsser SM, Heinz A, Raabe A, Wessa M, Podschus J, Flor H (2002) Stimulus‐induced craving and startle potentiation in abstinent alcoholics and controls. Eur Psychiatry 17:188–193. [DOI] [PubMed] [Google Scholar]
- Houben K, Wiers RW (2007) Personalizing the alcohol‐IAT with individualized stimuli: relationship with drinking behavior and drinking‐related problems. Addict Behav 32:2852–2864. [DOI] [PubMed] [Google Scholar]
- Johnsson KO, Berglund M (2006) Comparison between a cognitive behavioural alcohol programme and post‐mailed minimal intervention in high‐risk drinking university freshmen: results from a randomized controlled trial. Alcohol Alcohol 41:174–180. [DOI] [PubMed] [Google Scholar]
- Lang PJ (1980) Behavioral treatment and bio‐behavioral assessment: computer applications, in Technology in Mental Health Care Delivery Systems (Sidowski JB, Johnson JH, Williams TA. eds), pp 119–137. Ablex, Norwood, NJ. [Google Scholar]
- Lang PJ, Bradley MM, Cuthbert BN (2005) International Affective Picture System (IAPS): Affective Ratings of Pictures and Instruction Manual. Technical Report A‐6. University of Florida, Gainesville, FL. [Google Scholar]
- Lee E, Namkoong K, Lee CH, An SK, Lee BO (2006) Differences of photographs inducing craving between alcoholics and non‐alcoholics. Yonsei Med J 47:491–497. [DOI] [PMC free article] [PubMed] [Google Scholar]
- MacLeod C, Mathews A, Tata P (1986) Attentional bias in emotional disorders. J Abnorm Psychol 95:15–20. [DOI] [PubMed] [Google Scholar]
- Miller MA, Fillmore MT (2010) The effect of image complexity on attentional bias towards alcohol‐related images in adult drinkers. Addiction 105:883–890. [DOI] [PMC free article] [PubMed] [Google Scholar]
- Murphy P, Garavan H (2011) Cognitive predictors of problem drinking and AUDIT scores among college students. Drug Alcohol Depend 115:94–100. [DOI] [PubMed] [Google Scholar]
- Nees F, Diener C, Smolka MN, Flor H (2012) The role of context in the processing of alcohol‐relevant cues. Addict Biol 17:441–451. [DOI] [PubMed] [Google Scholar]
- Pulido C, Brown SA, Cummins K, Paulus MP, Tapert SF (2010) Alcohol cue reactivity task development. Addict Behav 35:84–90. [DOI] [PMC free article] [PubMed] [Google Scholar]
- Pulido C, Mok A, Brown SA, Tapert SF (2009) Heavy drinking relates to positive valence ratings of alcohol cues. Addict Biol 14:65–72. [DOI] [PMC free article] [PubMed] [Google Scholar]
- Rinck M, Becker ES (2007) Approach and avoidance in fear of spiders. J Behav Ther Exp Psychiatry 38:105–120. [DOI] [PubMed] [Google Scholar]
- Robbins SJ, Ehrman RN (1992) Designing studies of drug conditioning in humans. Psychopharmacology 106:143–153. [DOI] [PubMed] [Google Scholar]
- Robinson TE, Berridge KC (2003) Addiction. Annu Rev Psychol 54:25–53. [DOI] [PubMed] [Google Scholar]
- Rothermund K, Wentura D (2001) Figure‐ground asymmetries in the Implicit Association Test (IAT). Exp Psychol 48:94–106. [DOI] [PubMed] [Google Scholar]
- Saunders JB, Aasland OG, Babor TF, de la Fuente JR, Grant M (1993) Development of the Alcohol Use Disorders Identification Test (AUDIT): WHO Collaborative Project on Early Detection of Persons with Harmful Alcohol Consumption–II. Addiction 88:791–804. [DOI] [PubMed] [Google Scholar]
- Stacy AW, Wiers RW (2010) Implicit cognition and addiction: a tool for explaining paradoxical behavior. Annu Rev Clin Psychol 6:551–575. [DOI] [PMC free article] [PubMed] [Google Scholar]
- Suk HJ (2006) Color and emotion‐a study on the affective judgment across media and in relation to visual stimuli. Doctoral dissertation. Available at: https://ub-madoc.bib.uni-mannheim.de/1336/. Accessed March 28, 2014.
- Tapert SF, Cheung EH, Brown GG, Frank LR, Paulus MP, Schweinsburg AD, Meloy MJ, Brown SA (2003) Neural response to alcohol stimuli in adolescents with alcohol use disorder. Arch Gen Psychiatry 60:727–735. [DOI] [PubMed] [Google Scholar]
- Tibboel H, De Houwer J, Field M (2010) Reduced attentional blink for alcohol‐related stimuli in heavy social drinkers. J Psychopharmacol 24:1349–1356. [DOI] [PubMed] [Google Scholar]
- Van Deursen DS, Salemink E, Smit F, Kramer J, Wiers RW (2013) Web‐based cognitive bias modification for problem drinkers: protocol of a randomised controlled trial with a 2 × 2×2 factorial design. BMC Public Health 13:674. [DOI] [PMC free article] [PubMed] [Google Scholar]
- Wiers RW, Eberl C, Rinck M, Becker ES, Lindenmeyer J (2011) Retraining automatic action tendencies changes alcoholic patients' approach bias for alcohol and improves treatment outcome. Psychol Sci Public Interest 22:490–497. [DOI] [PubMed] [Google Scholar]
- Wiers RW, Gladwin TE, Hofmann W, Salemink E, Ridderinkhof KR (2013) Cognitive bias modification and cognitive control training in addiction and related psychopathology: mechanisms, clinical perspectives, and ways forward. Clin Psychol Sci 1:192–212. [Google Scholar]
- Wiers RW, Rinck M, Dictus M, Van Den Wildenberg E (2009) Relatively strong automatic appetitive action‐tendencies in male carriers of the OPRM1 G‐allele. Genes Brain Behav 8:101–106. [DOI] [PubMed] [Google Scholar]
- Wiers RW, van Woerden N, Smulders FTY, de Jong PJ (2002) Implicit and explicit alcohol‐related cognitions in heavy and light drinkers. J Abnorm Psychol 111:648–658. [DOI] [PubMed] [Google Scholar]
Associated Data
This section collects any data citations, data availability statements, or supplementary materials included in this article.
Supplementary Materials
Appendix S1. ABPS manual.
Appendix S2. ABPS descriptions.
Appendix S3. ABPS pictures.