

Abstract
Recent studies have revealed the polygenic nature of bipolar disorder (BP), and identified common risk variants associated with illness. However, the role of common polygenic risk in multiplex families has not previously been examined. The present study examined 249 European‐ancestry families from the NIMH Genetics Initiative sample, comparing subjects with narrowly defined BP (excluding bipolar II and recurrent unipolar depression; n = 601) and their adult relatives without BP (n = 695). Unrelated adult controls (n = 266) were from the NIMH TGEN control dataset. We also examined a prospective cohort of young (12–30 years) offspring and siblings of individuals with BPI and BPII disorder (at risk; n = 367) and psychiatrically screened controls (n = 229), ascertained from five sites in the US and Australia and assessed with standardized clinical protocols. Thirty‐two disease‐associated SNPs from the PGC‐BP Working Group report (2011) were genotyped and additive polygenic risk scores (PRS) derived. We show increased PRS in adult cases compared to unrelated controls (P = 3.4 × 10⁻⁵, AUC = 0.60). In families with a high‐polygenic load (PRS score ≥32 in two or more subjects), PRS distinguished cases with BPI/SAB from other relatives (P = 0.014, RR = 1.32). Secondly, a higher PRS was observed in at‐risk youth, regardless of affected status, compared to unrelated controls (GEE‐χ2 = 5.15, P = 0.012). This report is the first to explore common polygenic risk in multiplex families, albeit using only a small number of robustly associated risk variants. We show that individuals with BP have a higher load of common disease‐associated variants than unrelated controls and first‐degree relatives, and illustrate the potential utility of PRS assessment in a family context. © 2015 The Authors. American Journal of Medical Genetics Part B: Neuropsychiatric Genetics Published by Wiley Periodicals, Inc.
Keywords: bipolar disorder, polygenic risk, prospective, family, AUC analysis
INTRODUCTION
Large scale collaborative genome‐wide association studies (GWAS) have identified a number of risk loci significantly associated with bipolar disorder (BP), including ODZ4 [Sklar et al., 2011; Muhleisen et al., 2014], CACNA1C [Ferreira et al., 2008; Sklar et al., 2008], ANK3 [Ferreira et al., 2008; Schulze et al., 2009; Muhleisen et al., 2014], NCAN [Cichon et al., 2011], C15ORF53 [Ferreira et al., 2008], and DGKH [Baum et al., 2008a,2008b]. Individually, each of those genes/loci contributes only a small fraction toward overall disease risk, typically <1% of the phenotypic variance [Ferreira et al., 2008]. It is now understood that multiple genes containing both common and rare variants contribute to the genetic architecture of BP [Sullivan et al., 2012], and there are significant overlaps in the single nucleotide polymorphism (SNP)‐based heritabilities of BP with both schizophrenia and major depression [Lee et al., 2013]. Indeed, variation across many thousands of common risk variants together (termed polygenic risk [Purcell et al., 2009]) contributes a substantial proportion (i.e., 25–40%) of the percentage of phenotypic variance at a population level [Lee et al., 2011; 2013]—although most of those loci do not individually reach genome‐wide significance thresholds for disease association with current sample sizes [Craddock and Sklar, 2013; Dudbridge, 2013].
Examination of the cumulative effects of inheriting multiple risk alleles—each of which are significantly or nominally associated with disease risk—has been able to powerfully differentiate groups of cases from controls in independent population‐based studies [Purcell et al., 2014, 2009; Patel et al., 2010; Ayalew et al., 2012; Terwisscha van Scheltinga et al., 2012]. However, despite phenotypic aggregation within families [McGuffin et al., 2003; Lichtenstein et al., 2009], no studies have so far examined polygenic risk incorporating these common genetic factors in a family context in adults, with only one group to date reporting on polygenic risk in adolescent offspring of individuals with BP [Whalley et al., 2012, 2013].
While first‐degree relatives of individuals affected with BP would be expected on a theoretical basis to have a higher load of specific disease‐associated risk alleles than control individuals, this has not previously been examined empirically. This is primarily because, until recently, we have had very little knowledge about the specific DNA variants that contribute to risk for BP. However, as sample sizes are steadily increasing through the Psychiatric Genomics Consortium (PGC), and our power to detect such risk variants on a population level is improving, we are gaining a greater understanding of the underlying genetic contributors leading to BP. In 2011, Sklar et al. identified 38 variants (pared to 34 by assessment of independence with linkage disequilibrium) that contribute to disease risk (P < 5 × 10⁻⁵) using a discovery sample of 7,481 individuals with BP and 9,250 controls. These SNPs were replicated in an independent cohort comprising 4,496 cases and 42,422 controls, with more SNPs than expected showing P < 0.01, P < 0.05, and the same direction of effect [Sklar et al., 2011]. Hence, a substantial number of these SNPs may be expected to represent true risk variants (or markers for such alleles) for bipolar disorder. Here, we examined polygenic risk derived from those specific variants in first degree relatives of individuals with BP.
The present study tested the hypothesis that first‐degree relatives who are affected with BP would have a higher polygenic risk load of common risk variants in comparison to their relatives without BP, and that individuals at increased familial risk of BP would have a higher polygenic load of risk variants than control individuals. We tested this hypothesis using three cohorts: (1) a group of singleton cases with BP and controls from the National Institute of Mental Health (NIMH); (2) a family cohort of adult relatives of individuals with and without diagnoses of BP from the NIMH Bipolar Genetics Initiative; and (3) a prospective cohort of adolescents and young adults who are at increased familial risk of developing BP due to the presence of a first degree relative with a diagnosis of BP (henceforth termed “at‐risk”) and controls.
MATERIALS AND METHODS
Adult Participants From Family Studies
Two datasets were employed. The first comprised adult subjects of European ancestry (n = 1,947) drawn from the NIMH Genetics Initiative bipolar disorder family samples (waves I–IV European American families, n = 249 families, average of 6–7 subjects across three generations per family) [Nurnberger et al., 1997; Smith et al., 2009]. Subject diagnoses were obtained via standard best estimate (BEFD) procedure (details in supplementary information), and were diagnosed as having bipolar disorder type I (BPI, n = 561); schizoaffective disorder‐bipolar type (SAB, n = 40); bipolar disorder type II (BPII, n = 119); recurrent unipolar depressive disorder (UPR, n = 155); or single episode unipolar depressive disorder (UPS, n = 107). Primary analysis utilized a narrow definition of case status, whereby subjects were defined as affected if having received a diagnosis of BPI or SAB (n = 601). Subjects with BPII and UPR (n = 274) were excluded on the basis of unknown overlapping etiology, as were relatives with unknown diagnosis (n = 85). All other relatives (n = 695) included those with other mental disorders ([i.e., those with any DSM diagnosis excluding BPI, SAB, BPII, or UPR, n = 292], never mentally ill [n = 296], or with single episode depression [n = 107]), and were analyzed as a single group. Due to the small numbers of relatives with no psychiatric diagnoses (i.e., only one per family) comparisons between cases and never mentally ill relatives were not attempted.
The comparison dataset comprised unrelated adult controls of European origin drawn from the NIMH TGEN Control dataset subjects (n = 403) from the control collection of Sanders et al. [2010], who were screened to exclude those with any major mood disorder or psychosis (https://www.tgen.org/). DNA was extracted from whole blood by the Rutgers University Cell and DNA Repository.
Young At‐Risk Participants
Subjects were aged between 12 and 30 years, and were ascertained from five independent sites in the US [Nurnberger et al., 2011] (Johns Hopkins University; University of Michigan; Washington University in St. Louis; Indiana University) and Australia [Roberts et al., 2013] (University of New South Wales). “At‐risk” subjects were recruited from families who had previously participated in BP genetics studies [Nurnberger et al., 1997; Dick et al., 2003; Fullerton et al., 2010], a specialized BP research clinic [Mitchell et al., 2009], were referred by clinicians or mental health consumer organizations, or responded to other forms of publicity. Subjects were recruited using a “top‐down” ascertainment method: that is, all offspring of a proband with a confirmed DSM‐IV diagnosis of bipolar disorder type I (BPI), type II (BPII), or schizoaffective disorder bipolar‐type (SAB) who were in the age range 12–30 were eligible for inclusion, independent of the diagnostic status of the offspring. The participants were predominantly (94%) children or siblings of a proband; the remaining 6% comprised second‐degree relatives ascertained from families with multiple cases of BP. Control participants were in the same age range, but had no first‐degree relative (parent or sibling) with a DSM‐IV diagnosis of BPI or BPII, SAB, recurrent major depression (UPR), schizophrenia, recurrent substance abuse, or any past psychiatric hospitalization; and no parent with a first‐degree relative who had a past mood disorder hospitalization or history of psychosis. Control subjects were recruited via general medical clinics, motor vehicle records, print and electronic media, and notice boards in universities and local communities.
Peripheral blood samples were collected from a total of 367 at‐risk and 229 control individuals for genetic analysis. DNA was extracted from whole blood by the Rutgers University Cell and DNA Repository (US participants) or Genetic Repositories Australia (Australian participants). The 596 participants came from 426 families: the majority being single offspring (n = 299); although 127 families with ≥2 offspring were included (90 with 2 offspring, 30 with 3 offspring, 5 with 4 offspring, and 2 with 5 offspring).
Institutional Review Board Approval
Written informed consent (or assent with parental consent for subjects <18 years old) was obtained from all participants after a thorough explanation of the study. All protocols were approved through the individual hospital and University ethics committees (Institutional Review Boards) at each of the participating US university medical centers, University of New South Wales Human Research Ethics Committee, and the South Eastern Sydney Illawarra Area Health Service, Australia.
Ascertainment of Clinical Diagnoses and Demographic Information
Methods for ascertainment and diagnoses for the NIMH Genetics Initiative family dataset have been described extensively elsewhere [Nurnberger et al., 1997; Smith et al., 2009] and are summarized in supplementary information.
For the at‐risk cohort, proband consensus DSM‐IV diagnoses were determined by two independent psychiatrists using best estimate methodology [Leckman et al., 1982], using information from an adapted version of the Schedule for Affective Disorders and Schizophrenia for School‐Age Children—Present and Lifetime Version (K‐SADS‐BP) [Kaufman et al., 1997; Geller et al., 2001], the Diagnostic Interview for Genetic Studies (DIGS) Version 4 [Nurnberger et al., 1994], the Family Interview for Genetic Studies (FIGS) [Maxwell, 1992], and medical records (where available). For participants under the age of 22, the K‐SADS‐BP was administered as the diagnostic instrument. The FIGS was administered to all participants 18 years of age or older, with parents completing FIGS for participants under 18. Ethnicity was assessed by self‐report via grandparental origin information. The at‐risk cohort was mainly of European ancestry (73%), with subjects of Asian and African ancestry each accounting for less than 10% of the sample (Table I).
Table I.
Racial Background of Combined United States and Australian At‐Risk and Control Samples
| All subjects (%) | At‐risk (%) | Control (%) | |
|---|---|---|---|
| European | 478 (78.5) | 335 (91.3) | 143 (62.4) |
| Asian | 38 (6.2) | 1 (0.3) | 37 (16.2) |
| African | 40 (6.6) | 5 (1.4) | 35 (15.3) |
| Mixed race/other/unknown | 53 (8.7) | 26 (7.0) | 14 (6.1) |
| Total | 609 (100) | 367 (100) | 229 (100) |
The total number of individuals in each racial group (reported in line with the seven US census categories) is given, along with the percentage (%) representation within each sample. The numbers of individuals represented in the mixed race/other/unknown category were of Australian Aboriginal/Hawaiian/Pacific Islander (n = 7), American Indian/Alaska native (n = 1), mixed race (n = 18), or other/unknown (n = 27) descent.
Marker Selection, Genotyping, and Quality Control
We chose for genotyping 38 SNPs that were robustly implicated in bipolar disorder risk, on the basis of prior evidence of genetic association (P < 5 × 10⁻⁵) from the PGC [Sklar et al., 2011]; two (rs3968, rs8006348) failed sassay design.
The remaining 36 SNPs [Sklar et al., 2011] were genotyped at two sites, using iPLEX GOLD chemistry on the Sequenom MassArray (Supporting Information Table S1]. Tests for Hardy–Weinberg equilibrium, linkage disequilibrium, genotype missingness and allelic, and genotypic frequency comparisons were conducted using PLINK [Purcell et al., 2007]. Three failed genotyping or Hardy–Weinberg equilibrium (P < 0.001) in either the US or Australian at‐risk sample (rs12912251, rs4332037, rs7578035), and one was in linkage disequilibrium with another SNP (rs11168751 with rs2070615; r2 = 0.141, D′ = 1.0). These SNPs were excluded from polygenic risk score analysis, leaving 32 SNPs for determination of polygenic risk score. The successfully genotyped SNPs had a >99.6% genotype pass rate.
NIMH controls were genotyped on the Affymetrix 6.0 array. Imputation was employed via IMPUTE v0.5.0 [Marchini et al., 2007] to determine the genotype for those SNPs not represented on the array, using genotypes from Caucasian European individuals (n = 82) from HAPMAP3 release 24 as a reference panel. The mean concordance of imputed and observed genotype calls was 97.4%. The majority of SNPs (n = 26) imputed with <10% missing data, but some SNPs had higher failure rates (Supporting Information Table S1). The allele frequencies of each SNP in all European ancestry subjects were close to those previously reported [Sklar et al., 2011] for Europeans (±0.022–0.032), and were similar for both directly observed and imputed SNPs (±0.031 and ±0.025, respectively) (Supporting Information Table S1).
Polygenic Risk Score Determination
To determine the additive polygenic load in each subject, a score of one was given for each risk allele carried, so an individual subject's score could range from 0 to 64. Weighted‐additive polygenic risk scores were computed using the score function in PLINK [Purcell et al., 2007]. Scores were weighted either by: (1) the effect size of each SNP, as determined by the odds ratio of the risk allele from the original discovery GWAS study by Sklar et al. [2011]; or (2) by the PGC risk allele frequency from appropriate ethnic group to derive ethnicity‐specific PRS, using allele frequencies determined the phase 1 of the 1000 genomes project [Abecasis et al., 2012]. Frequencies derived from CEPH individuals (CEU) were applied to people of European ancestry, frequencies from individuals of African ancestry from south west US (ASW) were applied to African‐American individuals, and frequencies from Han Chinese individuals from Beijing (CHB) were applied to individuals of Asian ancestry.
For the at‐risk and NIMH family samples, only individuals with no missing genotypes (n = 364 at‐risk, n = 226 young controls, n = 601 NIMH BPI/SAB cases [including 236 singletons]), n = 969 other NIMH relatives (including subjects with diagnoses of BPII and UPR) were included. As imputation was required for determination of genotypes in unrelated controls, a maximum of two missing genotypes were permitted (n = 266 NIMH TGEN controls), and the score normalized to a base of 64. For the comparison of polygenic risk scores between singleton bipolar cases from the NIMH bipolar genetics initiative and TGEN controls, subjects were only included if a minimum of 31 SNPs were successfully genotyped (directly or by imputation), and polygenic risk scores were adjusted on the basis of the total number of variants used.
Statistical Analysis
To test whether cases or at‐risk individuals within families had a higher average polygenic risk score as compared with controls, a linear Generalized Estimating Equations (GEE) model was used, with a one‐sided test for significance. The GEE model corrects for non‐independence of measurement between family members. A one‐sided t‐test was utilized to test group differences in unrelated subjects. Relative risk calculations were conducted relative to the mean polygenic risk value for the case (bipolar disorder or at‐risk) group. Statistical analysis was conducted in SPSS (Version 20.0, IBM Corporation, Armonk, NY). Estimates of the proportion of genetic variance accounted for by the score were calculated via genRoc (http://glimmer.rstudio.com/kn3in/genRoc/) [Wray et al., 2010] and GPRS software (https://gprs.shinyapps.io/start/) [Dudbridge, 2013].
RESULTS
Using polygenic risk scores derived from 32 of the most robustly associated SNPs from the PGC, we conducted a risk load analysis to determine whether a polygenic risk score derived from disease‐associated SNPs would: (1) distinguish unrelated BP cases from unrelated control individuals; (2) distinguish relatives affected with BP from their non‐BP‐affected or “unaffected” adult relatives; and (3) distinguish a young at‐risk population from a group of unrelated young controls.
Polygenic Risk Load Analysis in Adult Cases Versus Unrelated Adult Controls
We used European ancestry subjects from 249 bipolar pedigrees from the NIMH genetics initiative sample. We selected a single case with BPI or SAB from each of the families (n = 236; typically the first subject recruited with a diagnosis of BPI or SAB for each family for whom the maximum number of SNPs were successfully genotyped) and compared polygenic risk scores to unrelated controls from the NIMH control dataset (n = 266).
We found that the average polygenic risk score was higher for singleton BPI or SAB cases than unrelated controls [mean = 32.67 ± 3.85 and 31.35 ± 3.90, respectively; t(1,501) = −3.81, P = 7.08E‐05, OR = 1.88 (95%CI = 1.31–2.69)] and that a score of ≥32 risk alleles (defined by mean of the case group) was associated with an increased relative risk of BP diagnosis of 1.31 (95%CI = 1.12–1.53) (Fig. 1). Results were similar in analyses weighted by minor allele frequency (P = 0.0025) and odds ratio (P = 3.55E‐05).
Figure 1.
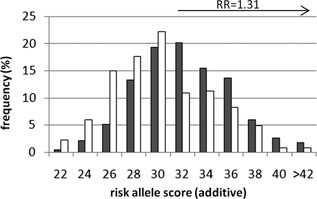
Risk allele score distribution comparing unrelated controls and singleton cases from NIMH families. Single cases with BPI or SAB (n = 236, grey bars) were selected from NIMH families and compared to unrelated controls from the TGEN dataset (n = 266, white bars). The relative risk (RR) estimate of 1.31 (95%CI = 1.12–1.53) was calculated with respect to a risk score of ≥32, with an overall odds ratio of 1.88 (95%CI = 1.31–2.69). For the purposes of graphical representation, the frequency of risk scores are represented in even integers, and represent bins which include both odd and even scores (i.e., bin 22 is the sum of the frequency of 22 and 23 risk alleles).
Sensitivity and Specificity of the SNP Panel
To determine the sensitivity and specificity of this limited SNP panel with regards to potential predictive accuracy, area under the receiver‐operator characteristic curve (AUC) was conducted. Polygenic risk scores from unrelated individuals with diagnoses of BPI or SAB from the NIMH family sample (n = 236) were compared with unrelated controls from the TGEN dataset (n = 266). The AUC was modestly increased from the null at α = 0.05 (AUC = 0.60; 95%CI = 0.55–0.65). A score of ≥32 risk alleles had sensitivity of 60% and specificity of 52%, and a score of ≥34 risk alleles had sensitivity of 40% and specificity of 73%. Results were similar in analyses weighted by allele frequency (AUC = 0.57; 95%CI = 0.52–0.62) and odds ratio (AUC = 0.60; 95%CI = 0.55–0.65). Based on the genetic epidemiology of bipolar disorder (i.e., disease prevalence and sibling recurrence risk), the maximum theoretical value for AUC is 0.97 or 0.80 if the variants included in the genomic profile explain a quarter of the known genetic variance [Wray et al., 2010]. The proportion of the known genetic variance explained by the 32 SNP genomic profile (ρĜG) is approximately 3%, and the proportion of variance explained by the score on the liability scale was estimated at Nagelkerke's R2 = 0.0088 ± 0.0062.
Iterative inclusion of SNPs ranked by odds ratios revealed that the AUC estimate increased with the addition of each SNP, with the AUC statistic becoming significant (i.e., P ≤ 0.05) with the inclusion of 14 SNPs with the highest odds ratios (OR ≥ 1.15) (Table II). It must be noted however, that while significant, the predictive capacity of the PRS is low, indicative of the small effect sizes of individual risk alleles.
Table II.
Summary of Area Under the Receiver‐Operator Characteristic Curve (AUC), With Incremental Increase of SNP Content in Polygenic Risk Score
| Number of SNPs | AUC (95%CI) | P‐value |
|---|---|---|
| 10 | 0.528 (0.477–0.578) | 0.287 |
| 13 | 0.548 (0.498–0.599) | 0.062 |
| 14 | 0.554 (0.504–0.605) | 0.037 |
| 15 | 0.556 (0.506–0.607) | 0.029 |
| 20 | 0.573 (0.523–0.624) | 0.0045 |
| 25 | 0.597 (0.547–0.646) | 1.85E‐04 |
| 30 | 0.606 (0.557–0.655) | 4.24E‐05 |
| 32 | 0.601 (0.552–0.651) | 9.13E‐05 |
SNPs were included in the polygenic risk score in order of decreasing odds ratio from the primary GWAS reported by Sklar et al. (2011); and polygenic risk scores weighted by the odds ratio for each SNP. Mean AUC estimates are given, along with the 95% confidence interval of each measure.
Polygenic Risk Load Analysis Within Families, Comparing Adult Relatives With Bipolar Disorder to Other Relatives
We next sought to examine polygenic risk scores within multiplex families, to determine if the average polygenic risk score would be higher in cases compared to other relatives. We used European ancestry subjects from 249 bipolar pedigrees from the NIMH genetics initiative, and applied a narrow diagnostic model, where only subjects with diagnoses of BPI or SAB were considered to be cases (n = 601). The category “all other relatives” (n = 695) included subjects with other mental illness (i.e., those with any DSM diagnosis excluding BPI, SAB, BPII, or UPR) and those who were never mentally ill.
As inheritance of polygenic risk has not previously been examined in a family context, we first examined the relationship between risk scores amongst related individuals in each family. We selected all available sibling pairs from the 249 NIMH families (n = 777 pairs), and examined the sibship correlation in polygenic risk score. As expected, risk scores amongst all siblings regardless of phenotype were significantly correlated (Pearson R = 0.53, P = 3.60 × 10−57), with an absolute mean score difference (ABS[sib1 − sib2]) of ±3.74 risk alleles (Fig. 2). Less predictably, phenotypically concordant case pairs (n = 108) did not have significantly different absolute mean score differences compared to phenotypically discordant sibpairs (n = 103) and concordant non‐case pairs (n = 95) (ANOVA, F = 1.38, P = 0.25).
Figure 2.
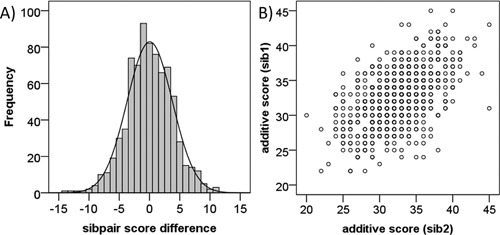
Relationship between polygenic risk scores in sibling pairs from NIMH families. A) Distribution of polygenic risk score difference between sibpairs (n = 777). B) A significant correlation between polygenic risk scores of sibling pairs was observed (n = 777, Pearson R = 0.53, P = 3.60E‐57).
Next, we examined polygenic risk score differences amongst all relatives in a within‐family analysis (n = 249 families), comparing all cases affected with BPI or SAB (n = 600) to all other relatives (n = 695). We found no significant differences by diagnostic group across all families (mean = 32.69 ± 3.94 vs. 32.45 ± 3.85; Wald χ2 = 1.19, P = 0.13; RR = 1.06 (95%CI = 0.96–1.17), P = 0.14) (Fig. 3A).
Figure 3.
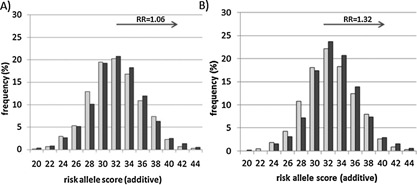
Analysis polygenic score by diagnosis in NIMH families comparing cases to all other relatives. The distribution of risk scores in patients affected with BPI or SAB (dark grey bars) were compared to all other relatives (light grey bars). For the purposes of graphical representation, the frequency of risk scores are represented in even integers, and represent bins which include both odd and even scores (i.e., bin 22 is the sum of the frequency of 22 and 23 risk alleles). Relative risk (RR) estimates were calculated with respect to an additive risk score of ≥32. A) All NIMH families (n = 249) included 600 cases and 715 other relatives. No significant differences were observed between mean risk scores in case versus all other relative groups (mean = 32.69 ± 3.94 vs. 32.45 ± 3.85; GEE‐Wald χ2 = 1.19, df = 1, P = 0.13). Relative risk was not significant (RR = 1.06 (95%CI = 0.96–1.17), P = 0.14). B) Selected NIMH families with a high polygenic load (n = 202), where two or more individuals from each family had a risk score of ≥32. The mean risk score was significantly higher in cases (n = 518) compared to all other relatives (n = 613)(mean = 33.40 ± 3.62 vs. 32.95 ± 3.70; GEE‐Wald χ2 = 4.78, P = 0.014). The distribution of risk scores in patients affected with BPI or SAB were shifted significantly towards the right compared to their other relatives, with a significant increase in relative risk in cases (RR = 1.32 (95%CI = 1.03–1.70), P = 0.018).
However, given the heterogeneity of bipolar disorder we hypothesized that some families will have a higher load of these specific common variants than others, and that polygenic risk score differences may be informative of diagnosis only in families which carry a high load of these specific common variants of small effect, as opposed to families whose illness may be caused largely by inheritance of rare pathogenic variation in a smaller number of key genes.
Hence, we selected only families in which two or more individuals (regardless of diagnosis) had a high‐polygenic risk score (i.e., ≥32) and repeated the analysis in those 202 families. We found that the polygenic risk score significantly differentiated the diagnostic groups in families with a high‐common variant load, such that cases (n = 518) had higher polygenic risk scores than other relatives (excluding those with diagnoses of BPII or UPR; n = 613) (Wald χ2 = 4.78, P = 0.014; RR = 1.32 [95%CI = 1.03–1.70], P = 0.018) (Fig. 3B). This was also significant when subjects affected with BPII were included as cases in the model (n = 621 cases vs. 613 other relatives; mean = 33.31 ± 3.61 vs. 32.92 ± 3.70; Wald χ2 = 3.53, P = 0.030; RR = 1.26 [95%CI = 1.00–1.60], P = 0.032).
Polygenic Risk Load Analysis in Young First Degree Relatives At‐Risk of Bipolar Disorder
Next, we examined polygenic risk in young at‐risk subjects of European ancestry (n = 334) and compared those to age‐ and ethnically appropriate controls (n = 142). The at‐risk group showed higher mean scores than controls (GEE‐Wald χ2 = 5.15, P = 0.012) (Fig. 4A). The relative risk estimate for subjects with scores ≥32 was 1.20 ([95%CI = 0.99–1.45], P = 0.036) (Fig. 4B). Results were similar in analyses weighted by allele frequency (GEE‐Wald χ2 = 5.55, P = 0.009) and odds ratio (GEE‐Wald χ2 = 4.18, P = 0.020).
Figure 4.
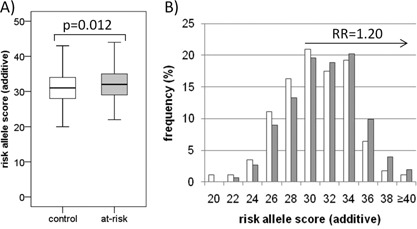
Polygenic risk score analysis in young European at‐risk individuals compared to controls. The total numbers of risk alleles per individual were scored using an additive model, using only subjects of European descent. At‐risk (n = 334) and control (n = 142) groups are represented by the grey and white bars, respectively. A) The mean risk score was significantly higher in at‐risk subjects (31.99 ± 0.27) than controls (31.07 ± 0.31) (GEE‐Wald χ2 = 5.15, 0.012). B) The distribution of risk scores in at‐risk subjects was shifted toward the right relative to control subjects. For the purposes of graphical representation, the frequency of risk scores are represented in even integers, and represent bins which include both odd and even scores (i.e., bin 22 is the sum of the frequency of 22 and 23 risk alleles). The relative risk (RR) estimate of 1.20 (95%CI = 0.99–1.45) was calculated with respect to a risk score of ≥32, with an overall odds ratio of 1.44 (95%CI = 0.99–2.09).
Expanding the cohort to include subjects from the three main ethnic groups (i.e., European, Asian, and African) in an ethnicity‐specific weighted analysis showed an enrichment of risk alleles in at‐risk subjects compared to controls (GEE‐Wald χ2 = 3.62, P = 0.029; RR = 1.14 [95%CI = 1.01–1.29], P = 0.017) (Supplementary Information Figure S1).
DISCUSSION
Many genomic variants together contribute to overall risk (termed polygenic risk) for a number of complex traits [Peterson et al., 2011; Hamshere et al., 2013; Meyers et al., 2013], and this genetic architecture is evident in a number of psychiatric conditions—including BP [Purcell et al., 2009; Lee et al., 2012, 2013; Smoller et al., 2013; Bramon et al., 2014]. While the elucidation of the genetic causes for BP has been challenging, the field is progressing in understanding the genetic architecture of this complex disorder (reviewed in [Craddock and Sklar, 2013]) and in identifying specific genes which increase risk [Sklar et al., 2011]. Polygenic risk scores based on multiple genetic variants across the genome [Purcell et al., 2009] have successfully discriminated between groups of unrelated cases and controls [Patel et al., 2010] and also individuals with BP broadly defined as schizoaffective or non‐schizoaffective [Hamshere et al., 2011], indicating the potential utility of risk score analysis in clinical diagnoses at a population level. However, it is unclear as to whether polygenic risk score analysis, with or without other clinical or biomarker data, could be useful for diagnosis or risk prediction in persons with a significant family history of BP, particularly given the non‐random inheritance of population risk alleles in related individuals and confounding shared environmental effects within a family. This question is also pertinent due to the potential for high rates of sporadic illness in typical gene discovery studies [Yang et al., 2010] which are used to define common polygenic risk. The present study is the first to examine these common risk factors in the context of inheritance within the family of a BP proband, exploring both adult relatives of known diagnosis, and adolescent or young adult relatives who are at‐risk of future BP on the basis of a positive family history.
Determination of polygenic risk scores can be performed using strict (e.g., genome‐wide significant P < 5 × 10⁻⁸) or increasingly permissive P‐value thresholds to include variation with very small genetic effects which may impact disease status. We chose to focus our study on 32 SNPs that were the most significant independently associated variants in the PGC‐GWAS analysis [Sklar et al., 2011]. While we acknowledge that our limited SNP selection represents only a small fraction of the total variation that contributes to bipolar disorder risk [Lee et al., 2013, 2011], the selected SNPs arguably represent the largest effect sizes on a population level and are potentially least subject to statistical fluctuation and type I error.
We first sought to determine whether this SNP panel could be useful in distinguishing individuals with a diagnosis of narrowly defined bipolar disorder from unrelated control individuals. The AUC value of the SNP panel (0.60) was small but significant, and slightly higher than the median AUC values based on “known” bipolar risk variants (n = 3) with genome‐wide SNP data at a more liberal P‐value inclusion threshold of P < 0.0001–0.01 that was previously reported in the WTCCC dataset [Evans et al., 2009]. This may indicate that the larger PGC analysis has a greater signal‐to‐noise ratio in the top risk SNPs than those identified in the earlier WTCCC analysis, and is consistent with simulation studies which indicate that the accuracy of diagnostic prediction using polygenic risk scores depends on the size of the training sample [Purcell et al., 2009; Dudbridge, 2013].
We found that polygenic risk scores significantly distinguished between diagnostic groups in families with a higher polygenic risk load, but not in families with moderate–low polygenic loads—consistent with genetic heterogeneity across families. Risk scores were not sufficiently specific to classify diagnostic status on an individual basis. Remarkably, we were also able to identify group differences between young individuals at‐risk of BP and young controls.
The PGC discovery sample from which the selected SNPs were derived was ethnically European, and as such we restricted our primary analysis to subjects of European descent. By expanding the analysis to include the three major ethnic groups represented in the at‐risk cohort, we assume the same SNPs and alleles will confer risk across different ethnic groups. There is little clear evidence regarding ethnic‐specific locus‐heterogeneity, partly due to the smaller sample sizes currently available for non‐European gene discovery studies. However, a recent meta‐analysis of European and Asian GWAS data has shown that Asian subjects tend to have the same direction of effect for the most significantly associated loci (P < 1e‐06) with only ∼2% of the top 41 SNPs showing a different direction of effect to the European samples [Chen et al., 2013]. Additional method development to address the use of polygene scores in the presence of ethnic differences would be useful.
The purpose of our study was to determine whether a small number of common risk variants could be useful in distinguishing relatives of BP probands who are also ill, or may become ill in the future. Despite the close genetic relationship between extended family members, and a non‐random inheritance of risk alleles within a family, we were able to show that the polygenic risk score did serve as a marker of ill versus well relatives on a group basis. We would not recommend clinical application of such a score at this time, but additional implementation of similar methods in longitudinal clinical research studies is certainly called for.
Only one other group thus far has examined polygenic risk in a prospectively recruited bipolar cohort, showing an increased genome‐wide polygenic risk score in 70 at‐risk individuals compared to 60 controls [Whalley et al., 2013] at baseline assessment. This group has also reported polygene associations with limbic brain activation during functional MRI [Whalley et al., 2012], and white matter integrity measures from DTI in a bipolar at‐risk cohort [Whalley et al., 2012]. Neuroimaging biomarkers have previously been identified in the Australian at‐risk subjects which were part of the current study, with a lack of recruitment of the inferior frontal gyrus in the high‐risk participants compared to healthy controls during an fMRI emotion inhibition task [Roberts et al., 2013]. Further investigations on the impact of polygenic risk on neuroimaging biomarkers may be particularly informative.
While this paper describes baseline associations of this at‐risk cohort, future investigation of this sample—which is being prospectively evaluated as subjects transition through the peak period of risk for the development of BP—will be able to determine if polygenic risk scores are useful in future risk prediction for the development of bipolar disorder. It remains to be seen as to whether polygenic risk scores alone [Patel et al., 2010], or in conjunction with early clinical signs, exposure to psychosocial risk factors, and other potential biomarkers [Brietzke et al., 2012] may provide a more robust predictor of future illness. The predictive power of polygenic risk scores is likely to improve with increased discovery sample sizes and the assessment of a larger number of both common and rare genetic variants within the prediction models [Sullivan et al., 2012; Chatterjee et al., 2013; Craddock and Sklar, 2013; Dudbridge, 2013].
LIMITATIONS
Some of the parents or relatives of the US at‐risk subjects were ascertained from the NIMH families which were included in the PGC discovery sample, and hence our family samples are not entirely independent. However, there is no overlap between the Australian at‐risk subjects and the PGC discovery sample, nor are the Australian at‐risk subjects related to this sample. While the overall contribution of those NIMH relatives to the PGC discovery sample was very small (<2% of the cases from the PGC discovery dataset), our findings should be considered as an extension rather than an independent replication of the PGC findings (see also discussion in [Wray et al., 2013]). Using only the most significant SNPs is also a limitation of our study, and we acknowledge that many more variants of importance in conferring risk to bipolar disorder have not been assessed. Conversely, this is also a strength of our study, as we were able to directly genotype each variant in the at‐risk and family samples, rather than relying on imputed data or surrogate SNPs. Indeed, fewer than half of the 32 SNPs in our panel are represented on any one high‐density SNP chip currently commercially available, although direct genotyping of a larger number of SNPs showing nominally significant association will be possible with the PsychChip (Illumina, San Diego, CA). Imputation was used in the determination of genotypes in the unrelated control group for AUC estimation, and while imputation accuracy was high (97.4% concordance), this is a limitation of the AUC analysis and, together with the small overlap between the PGC discovery sample and the US family samples, should be taken into consideration with interpretation of the AUC data [Wray et al., 2013]. It should be noted that limitations of genotyping platform and imputation did not apply to the key within‐family results. We also applied a genetic model which assumes additivity of risk alleles in a single aggregate score as per the methods used by the PGC [Purcell et al., 2009], although it should be noted that this is a simplistic model which does not account for possible multiplicative interaction effects between genes or genes and environment.
CONCLUSIONS
Our study provides conceptual support to the notion that polygenic risk scores may be useful in prospective risk prediction for bipolar disorder. This may lead to future opportunities for early identification and intervention strategies, such as prophylactic pharmaceutical treatment, environmental modifications, or targeted psychological interventions (reviewed in [McMurrich et al., 2012; McNamara et al., 2012]) to reduce the impact and development of symptoms, improve quality of life, and long‐term outcomes for patients.
Bipolar Genome Study (BiGS) Co‐Authors
John R. Kelsoe, Tiffany A. Greenwood, Caroline M. Nievergelt, Rebecca McKinney, Paul D. Shilling—University of California, San Diego, CA, USA; Nicholas J. Schork, Erin N. Smith, Cinnamon S. Bloss—Scripps Translational Science Institute, La Jolla, CA, USA; John I. Nurnberger Jr., Howard J. Edenberg, Tatiana Foroud, Daniel L. Koller—Indiana University, Indianapolis, IN, USA; Elliot S. Gershon, Chunyu Liu, Judith A. Badner—University of Chicago, Chicago, IL, USA; William A. Scheftner—Rush University Medical Center, Chicago, IL, USA; William B. Lawson, Evaristus A. Nwulia, Maria Hipolito—Howard University, Washington, D.C., USA; James B. Potash, William Coryell—University of Iowa, Iowa City, IA, USA; John Rice—Washington University, St. Louis, MO, USA; William Byerley—University of California, San Francisco, CA, USA; Francis J. McMahon, Thomas G. Schulze—National Institute of Mental Health Intramural Research Program, Bethesda, MD, USA; Wade H. Berrettini—University of Pennsylvania, Philadelphia, PA, USA; Peter P. Zandi, Pamela B. Mahon—Johns Hopkins School of Medicine, Baltimore, MD, USA; Melvin G. McInnis, Sebastian Zöllner, Peng Zhang—University of Michigan, Ann Arbor, MI, USA; David W. Craig, Szabolcs Szelinger—The Translational Genomics Research Institute, Phoenix, AZ, USA; Thomas B. Barrett—Portland Veterans Affairs Medical Center, Portland, OR, USA; Thomas G. Schulze—Georg‐August‐University Göttingen, Göttingen, Germany.
Bipolar High Risk Study Group Co‐Authors
John I. Nurnberger, M.D., Ph.D.; Leslie Hulvershorn, M.D.; Carrie Fisher, B.S.N.—Department of Psychiatry, Institute of Psychiatric Research, Indiana University School of Medicine, Indianapolis; Hai Liu, Ph.D.; Patrick O. Monahan, Ph.D.—Department of Medicine, Institute of Psychiatric Research, Indiana University School of Medicine, Indianapolis; Melvin McInnis, M.D.; Masoud Kamali, M.D.; Christine Brucksch, R.N.—Department of Psychiatry, University of Michigan School of Medicine, Ann Arbor; Anne Glowinski, M.D., M.P.E.—Department of Psychiatry, Washington University School of Medicine, St. Louis, Missouri; Holly C. Wilcox, Ph.D.—Department of Psychiatry, The Johns Hopkins University School of Medicine, Baltimore, Maryland; Philip B. Mitchell, M.B.B.S., M.D.—School of Psychiatry and Black Dog Institute, University of New South Wales, Sydney, Australia; Elliot S. Gershon, M.D.—Department of Psychiatry, University of Chicago Pritzker School of Medicine, Chicago, Illinois; Wade Berrettini, M.D., Ph.D.—Department of Psychiatry, University of Pennsylvania Health System, Philadelphia.
Supporting information
Additional supporting information may be found in the online version of this article at the publisher's web‐site.
Supporting Information.
ACKNOWLEDGMENTS
The authors wish to thank all of the many participants in the study, without whom this work would not have been possible.
We have used DNA samples and clinical data from the National Institute of Mental Health Genetics Initiative bipolar disorder family sample (https://nimhgenetics.org/available_data/bipolar_disorder) which is housed at the NHGRI Repository (http://www.genome.gov/19518664), and thank all those involved in generating this resource, who are listed in the Supplementary Material. Genome‐wide SNP genotyping of the NIMH samples was performed through the Genetic Association Information Network under the direction of The Bipolar Genome Study (BiGS) Consortium. We thank Kerrie Pierce (NeuRA) and Tamara McDonald (AGRF) for their assistance with sample preparation and genotyping.
This work was supported by the Australian National Medical and Health Research Council (program grant 1037196; project grant 1066177) and the National Institutes of Health collaborative R01s (grant nos. MH68009, MH073151, and MH068006). We gratefully acknowledge the Heinz C Prechter Bipolar Research Fund at the University of Michigan, and the Janette Mary O'Neil Research Fellowship (to JMF) for supporting this work. The funding agencies played no role in the design, analyses, or interpretation of this study.
DNA for the US participants was extracted by the Rutgers University Cell and DNA Repository (RUCDR; www.rucdr.org). DNA for the Australian sample was extracted by Genetic Repositories Australia (GRA; www.neura.edu.au/GRA), an Enabling Facility which is supported by an Australian National Health, and Medical Research Council (grant ID 401184).
Genotyping of the US sample (at‐risk and bipolar family sample) was conducted at the Center for Medical Genomics at Indiana University School of Medicine. Genotyping of the Australian at‐risk sample was conducted at the Australian Genome Research Facility (AGRF; www.agrf.org.au), which is accredited by the National Association of Testing Authorities and supported by the Commonwealth Government of Australia.
Control subjects from the National Institute of Mental Health Schizophrenia Genetics Initiative (NIMH‐GI), data and biomaterials are being collected by the “Molecular Genetics of Schizophrenia II” (MGS‐2) collaboration. The investigators and co‐investigators are: ENH/Northwestern University, Evanston, IL, MH059571, Pablo V. Gejman, M.D. (Collaboration Coordinator; PI), Alan R. Sanders, M.D.; Emory University School of Medicine, Atlanta, GA, MH59587, Farooq Amin, M.D. (PI); Louisiana State University Health Sciences Center; New Orleans, Louisiana, MH067257, Nancy Buccola A.P.R.N., B.C., M.S.N. (PI); University of California‐Irvine, Irvine, CA, MH60870, William Byerley, M.D. (PI); Washington University, St. Louis, MO, U01, MH060879, C. Robert Cloninger, M.D. (PI); University of Iowa, Iowa, IA, MH59566, Raymond Crowe, M.D. (PI), Donald Black, M.D.; University of Colorado, Denver, CO, MH059565, Robert Freedman, M.D. (PI); University of Pennsylvania, Philadelphia, PA, MH061675, Douglas Levinson, M.D. (PI); University of Queensland, Queensland, Australia, MH059588, Bryan Mowry, M.D. (PI); Mt. Sinai School of Medicine, New York, NY, MH59586, Jeremy Silverman, Ph.D. (PI).
Fullerton JM, Koller DL, Edenberg HJ, Foroud T, Liu H, Glowinski AL, McInnis MG, Wilcox HC, Frankland A, Roberts G, Schofield PR, Mitchell PB, Bipolar High Risk Study Group, BiGS Consortium . 2015. Assessment of First and Second Degree Relatives of Individuals With Bipolar Disorder Shows Increased Genetic Risk Scores in Both Affected Relatives and Young at‐risk individuals. Am J Med Genet Part B 168B:617–629.
Conflicts of interest: The authors declare no conflicts of interest relating to the work described herein. Dr. McInnis has served as a consultant for Pfizer Pharmaceuticals and has been on speakers' bureaus for Bristol–Meyers Squibb, Janssen, and Merck Pharmaceuticals. Dr. Schofield has been a paid speaker for Janssen Pharmaceuticals.
REFERENCES
- Abecasis GR, Auton A, Brooks LD, DePristo MA, Durbin RM, Handsaker RE, Kang HM, Marth GT, McVean GA. 2012. An integrated map of genetic variation from 1,092 human genomes. Nature 491(7422):56–65. [DOI] [PMC free article] [PubMed] [Google Scholar]
- Ayalew M, Le‐Niculescu H, Levey DF, Jain N, Changala B, Patel SD, Winiger E, Breier A, Shekhar A, Amdur R, Koller D, Nurnberger JI, Corvin A, Geyer M, Tsuang MT, Salomon D, Schork NJ, Fanous AH, O'Donovan MC, Niculescu AB. 2012. Convergent functional genomics of schizophrenia: From comprehensive understanding to genetic risk prediction. Mol Psychiatry 17(9):887–905. [DOI] [PMC free article] [PubMed] [Google Scholar]
- Baum AE, Akula N, Cabanero M, Cardona I, Corona W, Klemens B, Schulze TG, Cichon S, Rietschel M, Nothen MM, Georgi A, Schumacher J, Schwarz M, Abou Jamra R, Hofels S, Propping P, Satagopan J, Detera‐Wadleigh SD, Hardy J, McMahon FJ. 2008a. A genome‐wide association study implicates diacylglycerol kinase eta (DGKH) and several other genes in the etiology of bipolar disorder. Mol Psychiatry 13(2):197–207. [DOI] [PMC free article] [PubMed] [Google Scholar]
- Baum AE, Hamshere M, Green E, Cichon S, Rietschel M, Noethen MM, Craddock N, McMahon FJ. 2008b. Meta‐analysis of two genome‐wide association studies of bipolar disorder reveals important points of agreement. Mol Psychiatry 13(5):466–467. [DOI] [PMC free article] [PubMed] [Google Scholar]
- Bramon E, Pirinen M, Strange A, Lin K, Freeman C, Bellenguez C, Su Z, Band G, Pearson R, Vukcevic D, Langford C, Deloukas P, Hunt S, Gray E, Dronov S, Potter SC, Tashakkori‐Ghanbaria A, Edkins S, Bumpstead SJ, Arranz MJ, Bakker S, Bender S, Bruggeman R, Cahn W, Chandler D, Collier DA, Crespo‐Facorro B, Dazzan P, de Haan L, Di Forti M, Dragović M, Giegling I, Hall J, Iyegbe C, Jablensky A, Kahn RS, Kalaydjieva L, Kravariti E, Lawrie S, Linszen DH, Mata I, McDonald C, McIntosh A, Myin‐Germeys I, Ophoff RA, Pariante CM, Paunio T, Picchioni M, Consortium PG, Ripke S, Rujescu D, Sauer H, Shaikh M, Sussmann J, Suvisaari J, Tosato S, Toulopoulou T, Van Os J, Walshe M, Weisbrod M, Whalley H, Wiersma D, Blackwell JM, Brown MA, Casas JP, Corvin A, Duncanson A, Jankowski JAZ, Markus HS, Mathew GCG, Palmer CNA, Plomin R, Rautanen A, Sawcer SJ, Trembath RC, Wood NW, Barroso I, Peltonen L, Lewis CM, Murray RM, Donnelly P, Powell J, Spencer CCA. 2014. A genome‐wide association analysis of a broad psychosis phenotype identifies three loci for further investigation. Biol Psychiatry 75(5):386–397. [DOI] [PMC free article] [PubMed] [Google Scholar]
- Brietzke E, Mansur RB, Soczynska JK, Kapczinski F, Bressan RA, McIntyre RS. 2012. Towards a multifactorial approach for prediction of bipolar disorder in at risk populations. J Affect Disord 140(1):82–91. [DOI] [PubMed] [Google Scholar]
- Chatterjee N, Wheeler B, Sampson J, Hartge P, Chanock SJ, Park JH. 2013. Projecting the performance of risk prediction based on polygenic analyses of genome‐wide association studies. Nat Genet 45(4):400–405, 405e401–403. [DOI] [PMC free article] [PubMed] [Google Scholar]
- Chen DT, Jiang X, Akula N, Shugart YY, Wendland JR, Steele CJ, Kassem L, Park JH, Chatterjee N, Jamain S, Cheng A, Leboyer M, Muglia P, Schulze TG, Cichon S, Nothen MM, Rietschel M, McMahon FJ. 2013. Genome‐wide association study meta‐analysis of European and Asian‐ancestry samples identifies three novel loci associated with bipolar disorder. Mol Psychiatry 18(2):195–205. [DOI] [PubMed] [Google Scholar]
- Cichon S, Muhleisen TW, Degenhardt FA, Mattheisen M, Miro X, Strohmaier J, Steffens M, Meesters C, Herms S, Weingarten M, Priebe L, Haenisch B, Alexander M, Vollmer J, Breuer R, Schmal C, Tessmann P, Moebus S, Wichmann HE, Schreiber S, Muller‐Myhsok B, Lucae S, Jamain S, Leboyer M, Bellivier F, Etain B, Henry C, Kahn JP, Heath S, Hamshere M, O'Donovan MC, Owen MJ, Craddock N, Schwarz M, Vedder H, Kammerer‐Ciernioch J, Reif A, Sasse J, Bauer M, Hautzinger M, Wright A, Mitchell PB, Schofield PR, Montgomery GW, Medland SE, Gordon SD, Martin NG, Gustafsson O, Andreassen O, Djurovic S, Sigurdsson E, Steinberg S, Stefansson H, Stefansson K, Kapur‐Pojskic L, Oruc L, Rivas F, Mayoral F, Chuchalin A, Babadjanova G, Tiganov AS, Pantelejeva G, Abramova LI, Grigoroiu‐Serbanescu M, Diaconu CC, Czerski PM, Hauser J, Zimmer A, Lathrop M, Schulze TG, Wienker TF, Schumacher J, Maier W, Propping P, Rietschel M, Nothen MM. 2011. Genome‐wide association study identifies genetic variation in neurocan as a susceptibility factor for bipolar disorder. Am J Hum Genet 88(3):372–381. [DOI] [PMC free article] [PubMed] [Google Scholar]
- Craddock N, Sklar P. 2013. Genetics of bipolar disorder. Lancet 381(9878):1654–1662. [DOI] [PubMed] [Google Scholar]
- Dick DM, Foroud T, Flury L, Bowman ES, Miller MJ, Rau NL, Moe PR, Samavedy N, El‐Mallakh R, Manji H, Glitz DA, Meyer ET, Smiley C, Hahn R, Widmark C, McKinney R, Sutton L, Ballas C, Grice D, Berrettini W, Byerley W, Coryell W, DePaulo R, MacKinnon DF, Gershon ES, Kelsoe JR, McMahon FJ, McInnis M, Murphy DL, Reich T, Scheftner W, Nurnberger JI Jr. 2003. Genomewide linkage analyses of bipolar disorder: A new sample of 250 pedigrees from the National Institute of Mental Health Genetics Initiative. Am J Hum Genet 73(1):107–114. [DOI] [PMC free article] [PubMed] [Google Scholar]
- Dudbridge F. 2013. Power and predictive accuracy of polygenic risk scores. PLoS Genet 9(3):e1003348. [DOI] [PMC free article] [PubMed] [Google Scholar]
- Evans DM, Visscher PM, Wray NR. 2009. Harnessing the information contained within genome‐wide association studies to improve individual prediction of complex disease risk. Hum Mol Genet 18(18):3525–3531. [DOI] [PubMed] [Google Scholar]
- Ferreira MA, O'Donovan MC, Meng YA, Jones IR, Ruderfer DM, Jones L, Fan J, Kirov G, Perlis RH, Green EK, Smoller JW, Grozeva D, Stone J, Nikolov I, Chambert K, Hamshere ML, Nimgaonkar VL, Moskvina V, Thase ME, Caesar S, Sachs GS, Franklin J, Gordon‐Smith K, Ardlie KG, Gabriel SB, Fraser C, Blumenstiel B, Defelice M, Breen G, Gill M, Morris DW, Elkin A, Muir WJ, McGhee KA, Williamson R, MacIntyre DJ, MacLean AW, St CD, Robinson M, Van Beck M, Pereira AC, Kandaswamy R, McQuillin A, Collier DA, Bass NJ, Young AH, Lawrence J, Ferrier IN, Anjorin A, Farmer A, Curtis D, Scolnick EM, McGuffin P, Daly MJ, Corvin AP, Holmans PA, Blackwood DH, Gurling HM, Owen MJ, Purcell SM, Sklar P, Craddock N. 2008. Collaborative genome‐wide association analysis supports a role for ANK3 and CACNA1C in bipolar disorder. Nat Genet 40(9):1056–1058. [DOI] [PMC free article] [PubMed] [Google Scholar]
- Fullerton JM, Donald JA, Mitchell PB, Schofield PR. 2010. Two‐dimensional genome scan identifies multiple genetic interactions in bipolar affective disorder. Biol Psychiatry 67(5):478–486. [DOI] [PubMed] [Google Scholar]
- Geller B, Zimerman B, Williams M, Bolhofner K, Craney JL, DelBello MP, Soutullo C. 2001. Reliability of the Washington University in St. Louis Kiddie Schedule for Affective Disorders and Schizophrenia (WASH‐U‐KSADS) mania and rapid cycling sections. J Am Acad Child Adolesc Psychiatry 40(4):450–455. [DOI] [PubMed] [Google Scholar]
- Hamshere ML, Langley K, Martin J, Agha SS, Stergiakouli E, Anney RJ, Buitelaar J, Faraone SV, Lesch KP, Neale BM, Franke B, Sonuga‐Barke E, Asherson P, Merwood A, Kuntsi J, Medland SE, Ripke S, Steinhausen HC, Freitag C, Reif A, Renner TJ, Romanos M, Romanos J, Warnke A, Meyer J, Palmason H, Vasquez AA, Lambregts‐Rommelse N, Roeyers H, Biederman J, Doyle AE, Hakonarson H, Rothenberger A, Banaschewski T, Oades RD, McGough JJ, Kent L, Williams N, Owen MJ, Holmans P, O'Donovan MC, Thapar A. 2013. High loading of polygenic risk for ADHD in children with comorbid aggression. Am J Psychiatry 170(8):909–916. [DOI] [PMC free article] [PubMed] [Google Scholar]
- Hamshere ML, O'Donovan MC, Jones IR, Jones L, Kirov G, Green EK, Moskvina V, Grozeva D, Bass N, McQuillin A, Gurling H, St Clair D, Young AH, Ferrier IN, Farmer A, McGuffin P, Sklar P, Purcell S, Holmans PA, Owen MJ, Craddock N. 2011. Polygenic dissection of the bipolar phenotype. Br J Psychiatry 198(4):284–288. [DOI] [PMC free article] [PubMed] [Google Scholar]
- Kaufman J, Birmaher B, Brent D, Rao U, Flynn C, Moreci P, Williamson D, Ryan N. 1997. Schedule for affective disorders and schizophrenia for school‐age children‐present and lifetime version (K‐SADS‐PL): Initial reliability and validity data. J Am Acad Child Adolesc Psychiatry 36(7):980–988. [DOI] [PubMed] [Google Scholar]
- Leckman JF, Sholomskas D, Thompson WD, Belanger A, Weissman MM. 1982. Best estimate of lifetime psychiatric diagnosis: A methodological study. Arch Gen Psychiatry 39(8):879–883. [DOI] [PubMed] [Google Scholar]
- Lee SH, DeCandia TR, Ripke S, Yang J, Sullivan PF, Goddard ME, Keller MC, Visscher PM, Wray NR. 2012. Estimating the proportion of variation in susceptibility to schizophrenia captured by common SNPs. Nat Genet 44(3):247–250. [DOI] [PMC free article] [PubMed] [Google Scholar]
- Lee SH, Ripke S, Neale BM, Faraone SV, Purcell SM, Perlis RH, Mowry BJ, Thapar A, Goddard ME, Witte JS, Absher D, Agartz I, Akil H, Amin F, Andreassen OA, Anjorin A, Anney R, Anttila V, Arking DE, Asherson P, Azevedo MH, Backlund L, Badner JA, Bailey AJ, Banaschewski T, Barchas JD, Barnes MR, Barrett TB, Bass N, Battaglia A, Bauer M, Bayes M, Bellivier F, Bergen SE, Berrettini W, Betancur C, Bettecken T, Biederman J, Binder EB, Black DW, Blackwood DH, Bloss CS, Boehnke M, Boomsma DI, Breen G, Breuer R, Bruggeman R, Cormican P, Buccola NG, Buitelaar JK, Bunney WE, Buxbaum JD, Byerley WF, Byrne EM, Caesar S, Cahn W, Cantor RM, Casas M, Chakravarti A, Chambert K, Choudhury K, Cichon S, Cloninger CR, Collier DA, Cook EH, Coon H, Cormand B, Corvin A, Coryell WH, Craig DW, Craig IW, Crosbie J, Cuccaro ML, Curtis D, Czamara D, Datta S, Dawson G, Day R, De Geus EJ, Degenhardt F, Djurovic S, Donohoe GJ, Doyle AE, Duan J, Dudbridge F, Duketis E, Ebstein RP, Edenberg HJ, Elia J, Ennis S, Etain B, Fanous A, Farmer AE, Ferrier IN, Flickinger M, Fombonne E, Foroud T, Frank J, Franke B, Fraser C, Freedman R, Freimer NB, Freitag CM, Friedl M, Frisen L, Gallagher L, Gejman PV, Georgieva L, Gershon ES, Geschwind DH, Giegling I, Gill M, Gordon SD, Gordon‐Smith K, Green EK, Greenwood TA, Grice DE, Gross M, Grozeva D, Guan W, Gurling H, De Haan L, Haines JL, Hakonarson H, Hallmayer J, Hamilton SP, Hamshere ML, Hansen TF, Hartmann AM, Hautzinger M, Heath AC, Henders AK, Herms S, Hickie IB, Hipolito M, Hoefels S, Holmans PA, Holsboer F, Hoogendijk WJ, Hottenga JJ, Hultman CM, Hus V, Ingason A, Ising M, Jamain S, Jones EG, Jones I, Jones L, Tzeng JY, Kahler AK, Kahn RS, Kandaswamy R, Keller MC, Kennedy JL, Kenny E, Kent L, Kim Y, Kirov GK, Klauck SM, Klei L, Knowles JA, Kohli MA, Koller DL, Konte B, Korszun A, Krabbendam L, Krasucki R, Kuntsi J, Kwan P, Landen M, Langstrom N, Lathrop M, Lawrence J, Lawson WB, Leboyer M, Ledbetter DH, Lee PH, Lencz T, Lesch KP, Levinson DF, Lewis CM, Li J, Lichtenstein P, Lieberman JA, Lin DY, Linszen DH, Liu C, Lohoff FW, Loo SK, Lord C, Lowe JK, Lucae S, Macintyre DJ, Madden PA, Maestrini E, Magnusson PK, Mahon PB, Maier W, Malhotra AK, Mane SM, Martin CL, Martin NG, Mattheisen M, Matthews K, Mattingsdal M, McCarroll SA, McGhee KA, McGough JJ, McGrath PJ, McGuffin P, McInnis MG, McIntosh A, McKinney R, McLean AW, McMahon FJ, McMahon WM, McQuillin A, Medeiros H, Medland SE, Meier S, Melle I, Meng F, Meyer J, Middeldorp CM, Middleton L, Milanova V, Miranda A, Monaco AP, Montgomery GW, Moran JL, Moreno‐De‐Luca D, Morken G, Morris DW, Morrow EM, Moskvina V, Muglia P, Muhleisen TW, Muir WJ, Muller‐Myhsok B, Murtha M, Myers RM, Myin‐Germeys I, Neale MC, Nelson SF, Nievergelt CM, Nikolov I, Nimgaonkar V, Nolen WA, Nothen MM, Nurnberger JI, Nwulia EA, Nyholt DR, O'Dushlaine C, Oades RD, Olincy A, Oliveira G, Olsen L, Ophoff RA, Osby U, Owen MJ, Palotie A, Parr JR, Paterson AD, Pato CN, Pato MT, Penninx BW, Pergadia ML, Pericak‐Vance MA, Pickard BS, Pimm J, Piven J, Posthuma D, Potash JB, Poustka F, Propping P, Puri V, Quested DJ, Quinn EM, Ramos‐Quiroga JA, Rasmussen HB, Raychaudhuri S, Rehnstrom K, Reif A, Ribases M, Rice JP, Rietschel M, Roeder K, Roeyers H, Rossin L, Rothenberger A, Rouleau G, Ruderfer D, Rujescu D, Sanders AR, Sanders SJ, Santangelo SL, Sergeant JA, Schachar R, Schalling M, Schatzberg AF, Scheftner WA, Schellenberg GD, Scherer SW, Schork NJ, Schulze TG, Schumacher J, Schwarz M, Scolnick E, Scott LJ, Shi J, Shilling PD, Shyn SI, Silverman JM, Slager SL, Smalley SL, Smit JH, Smith EN, Sonuga‐Barke EJ, St Clair D, State M, Steffens M, Steinhausen HC, Strauss JS, Strohmaier J, Stroup TS, Sutcliffe JS, Szatmari P, Szelinger S, Thirumalai S, Thompson RC, Todorov AA, Tozzi F, Treutlein J, Uhr M, van den Oord EJ, Van Grootheest G, Van Os J, Vicente AM, Vieland VJ, Vincent JB, Visscher PM, Walsh CA, Wassink TH, Watson SJ, Weissman MM, Werge T, Wienker TF, Wijsman EM, Willemsen G, Williams N, Willsey AJ, Witt SH, Xu W, Young AH, Yu TW, Zammit S, Zandi PP, Zhang P, Zitman FG, Zollner S, Devlin B, Kelsoe JR, Sklar P, Daly MJ, O'Donovan MC, Craddock N, Sullivan PF, Smoller JW, Kendler KS, Wray NR. 2013. Genetic relationship between five psychiatric disorders estimated from genome‐wide SNPs. Nat Genet 45(9):984–994. [DOI] [PMC free article] [PubMed] [Google Scholar]
- Lee SH, Wray NR, Goddard ME, Visscher PM. 2011. Estimating missing heritability for disease from genome‐wide association studies. Am J Hum Genet 88(3):294–305. [DOI] [PMC free article] [PubMed] [Google Scholar]
- Lichtenstein P, Yip BH, Bjork C, Pawitan Y, Cannon TD, Sullivan PF, Hultman CM. 2009. Common genetic determinants of schizophrenia and bipolar disorder in Swedish families: A population‐based study. Lancet 373(9659):234–239. [DOI] [PMC free article] [PubMed] [Google Scholar]
- Marchini J, Howie B, Myers S, McVean G, Donnelly P. 2007. A new multipoint method for genome‐wide association studies by imputation of genotypes. Nat Genet 39(7):906–913. [DOI] [PubMed] [Google Scholar]
- Maxwell ME. 1992. Family interview for genetic studies. Bethesda, Maryland: Clinical Neurogenetics Branch, Intramural Research Program, NIMH, Bethesda, Maryland. Available online at https://www.nimhgenetics.org/interviews/figs/.
- McGuffin P, Rijsdijk F, Andrew M, Sham P, Katz R, Cardno A. 2003. The heritability of bipolar affective disorder and the genetic relationship to unipolar depression. Arch Gen Psychiatry 60(5):497–502. [DOI] [PubMed] [Google Scholar]
- McMurrich S, Sylvia LG, Dupuy JM, Peckham AD, Peters AT, Deckersbach T, Perlis RH. 2012. Course, outcomes, and psychosocial interventions for first‐episode mania. Bipolar Disord 14(8):797–808. [DOI] [PubMed] [Google Scholar]
- McNamara RK, Strawn JR, Chang KD, DelBello MP. 2012. Interventions for youth at high risk for bipolar disorder and schizophrenia. Child Adolesc Psychiatr Clin N Am 21(4):739–751. [DOI] [PMC free article] [PubMed] [Google Scholar]
- Meyers JL, Cerda M, Galea S, Keyes KM, Aiello AE, Uddin M, Wildman DE, Koenen KC. 2013. Interaction between polygenic risk for cigarette use and environmental exposures in the Detroit neighborhood health study. Transl Psychiatry 3:e290. [DOI] [PMC free article] [PubMed] [Google Scholar]
- Mitchell PB, Johnston AK, Corry J, Ball JR, Malhi GS. 2009. Characteristics of bipolar disorder in an Australian specialist outpatient clinic: Comparison across large datasets. Aust N Z J Psychiatry 43(2):109–117. [DOI] [PubMed] [Google Scholar]
- Muhleisen TW, Leber M, Schulze TG, Strohmaier J, Degenhardt F, Treutlein J, Mattheisen M, Forstner AJ, Schumacher J, Breuer R, Meier S, Herms S, Hoffmann P, Lacour A, Witt SH, Reif A, Muller‐Myhsok B, Lucae S, Maier W, Schwarz M, Vedder H, Kammerer‐Ciernioch J, Pfennig A, Bauer M, Hautzinger M, Moebus S, Priebe L, Czerski PM, Hauser J, Lissowska J, Szeszenia‐Dabrowska N, Brennan P, McKay JD, Wright A, Mitchell PB, Fullerton JM, Schofield PR, Montgomery GW, Medland SE, Gordon SD, Martin NG, Krasnow V, Chuchalin A, Babadjanova G, Pantelejeva G, Abramova LI, Tiganov AS, Polonikov A, Khusnutdinova E, Alda M, Grof P, Rouleau GA, Turecki G, Laprise C, Rivas F, Mayoral F, Kogevinas M, Grigoroiu‐Serbanescu M, Propping P, Becker T, Rietschel M, Nothen MM, Cichon S. 2014. Genome‐wide association study reveals two new risk loci for bipolar disorder. Nat Commun 5:3339. [DOI] [PubMed] [Google Scholar]
- Nurnberger JI, DePaulo JR, Gershon ES, Reich T, Blehar MCJEH, Foroud T, Miller M, Bowman E, Mayeda A, Rau NL, Smiley C, Conneally PM, Mc‐Mahon F, Meyers D, Simpson S, McInnis M, Stine OC, Detera‐Wadleigh S, Goldin L, Guroff J, Maxwell ME, Kazuba D, Gejman PV, Badner J, Sanders AR, Rice J, Bierut L, Goate A. 1997. Genomic survey of bipolar illness in the NIMH genetics initiative pedigrees: A preliminary report. Am J Med Genet 74(3):227–237. [DOI] [PubMed] [Google Scholar]
- Nurnberger JI Jr., Blehar MC, Kaufmann CA, York‐Cooler C, Simpson SG, Harkavy‐Friedman J, Severe JB, Malaspina D, Reich T. 1994. Diagnostic interview for genetic studies. Rationale, unique features, and training. NIMH Genetics Initiative. Arch Gen Psychiatry 51(11):849–859. Discussion 863–844. [DOI] [PubMed] [Google Scholar]
- Nurnberger JI Jr., McInnis M, Reich W, Kastelic E, Wilcox HC, Glowinski A, Mitchell P, Fisher C, Erpe M, Gershon ES, Berrettini W, Laite G, Schweitzer R, Rhoadarmer K, Coleman VV, Cai X, Azzouz F, Liu H, Kamali M, Brucksch C, Monahan PO. 2011. A high‐risk study of bipolar disorder. Childhood clinical phenotypes as precursors of major mood disorders. Arch Gen Psychiatry 68(10):1012–1020. [DOI] [PMC free article] [PubMed] [Google Scholar]
- Patel SD, Le‐Niculescu H, Koller DL, Green SD, Lahiri DK, McMahon FJ, Nurnberger JI Jr., Niculescu AB 3rd. 2010. Coming to grips with complex disorders: Genetic risk prediction in bipolar disorder using panels of genes identified through convergent functional genomics. Am J Med Genet B Neuropsychiatr Genet 153B(4):850–877. [DOI] [PubMed] [Google Scholar]
- Peterson RE, Maes HH, Holmans P, Sanders AR, Levinson DF, Shi J, Kendler KS, Gejman PV, Webb BT. 2011. Genetic risk sum score comprised of common polygenic variation is associated with body mass index. Hum Genet 129(2):221–230. [DOI] [PMC free article] [PubMed] [Google Scholar]
- Purcell S, Neale B, Todd‐Brown K, Thomas L, Ferreira MA, Bender D, Maller J, Sklar P, de Bakker PI, Daly MJ, Sham PC. 2007. PLINK: A tool set for whole‐genome association and population‐based linkage analyses. Am J Hum Genet 81(3):559–575. [DOI] [PMC free article] [PubMed] [Google Scholar]
- Purcell SM, Moran JL, Fromer M, Ruderfer D, Solovieff N, Roussos P, O'Dushlaine C, Chambert K, Bergen SE, Kahler A, Duncan L, Stahl E, Genovese G, Fernandez E, Collins MO, Komiyama NH, Choudhary JS, Magnusson PK, Banks E, Shakir K, Garimella K, Fennell T, DePristo M, Grant SG, Haggarty SJ, Gabriel S, Scolnick EM, Lander ES, Hultman CM, Sullivan PF, McCarroll SA, Sklar P. 2014. A polygenic burden of rare disruptive mutations in schizophrenia. Nature 506(7487):185–190. [DOI] [PMC free article] [PubMed] [Google Scholar]
- Purcell SM, Wray NR, Stone JL, Visscher PM, O'Donovan MC, Sullivan PF, Sklar P. 2009. Common polygenic variation contributes to risk of schizophrenia and bipolar disorder. Nature 460(7256):748–752. [DOI] [PMC free article] [PubMed] [Google Scholar]
- Roberts G, Green MJ, Breakspear M, McCormack C, Frankland A, Wright A, Levy F, Lenroot R, Chan HN, Mitchell PB. 2013. Reduced inferior frontal gyrus activation during response inhibition to emotional stimuli in youth at high risk of bipolar disorder. Biol Psychiatry 74(1):55–61. [DOI] [PubMed] [Google Scholar]
- Sanders AR, Levinson DF, Duan J, Dennis JM, Li R, Kendler KS, Rice JP, Shi J, Mowry BJ, Amin F, Silverman JM, Buccola NG, Byerley WF, Black DW, Freedman R, Cloninger CR, Gejman PV. 2010. The internet‐based MGS2 control sample: Self report of mental illness. Am J Psychiatry 167(7):854–865. [DOI] [PMC free article] [PubMed] [Google Scholar]
- Schulze TG, Detera‐Wadleigh SD, Akula N, Gupta A, Kassem L, Steele J, Pearl J, Strohmaier J, Breuer R, Schwarz M, Propping P, Nothen MM, Cichon S, Schumacher J, Rietschel M, McMahon FJ. 2009. Two variants in Ankyrin 3 (ANK3) are independent genetic risk factors for bipolar disorder. Mol Psychiatry 14(5):487–491. [DOI] [PMC free article] [PubMed] [Google Scholar]
- Sklar P, Ripke S, Scott LJ, Andreassen OA, Cichon S, Craddock N, Edenberg HJ, Nurnberger JI, Jr. , Rietschel M, Blackwood D, Corvin A, Flickinger M, Guan W, Mattingsdal M, McQuillin A, Kwan P, Wienker TF, Daly M, Dudbridge F, Holmans PA, Lin D, Burmeister M, Greenwood TA, Hamshere ML, Muglia P, Smith EN, Zandi PP, Nievergelt CM, McKinney R, Shilling PD, Schork NJ, Bloss CS, Foroud T, Koller DL, Gershon ES, Liu C, Badner JA, Scheftner WA, Lawson WB, Nwulia EA, Hipolito M, Coryell W, Rice J, Byerley W, McMahon FJ, Schulze TG, Berrettini W, Lohoff FW, Potash JB, Mahon PB, McInnis MG, Zollner S, Zhang P, Craig DW, Szelinger S, Barrett TB, Breuer R, Meier S, Strohmaier J, Witt SH, Tozzi F, Farmer A, McGuffin P, Strauss J, Xu W, Kennedy JL, Vincent JB, Matthews K, Day R, Ferreira MA, O'Dushlaine C, Perlis R, Raychaudhuri S, Ruderfer D, Hyoun PL, Smoller JW, Li J, Absher D, Thompson RC, Meng FG, Schatzberg AF, Bunney WE, Barchas JD, Jones EG, Watson SJ, Myers RM, Akil H, Boehnke M, Chambert K, Moran J, Scolnick E, Djurovic S, Melle I, Morken G, Gill M, Morris D, Quinn E, Muhleisen TW, Degenhardt FA, Mattheisen M, Schumacher J, Maier W, Steffens M, Propping P, Nothen MM, Anjorin A, Bass N, Gurling H, Kandaswamy R, Lawrence J, McGhee K, McIntosh A, McLean AW, Muir WJ, Pickard BS, Breen G, St Clair D, Caesar S, Gordon‐Smith K, Jones L, Fraser C, Green EK, Grozeva D, Jones IR, Kirov G, Moskvina V, Nikolov I, O'Donovan MC, Owen MJ, Collier DA, Elkin A, Williamson R, Young AH, Ferrier IN, Stefansson K, Stefansson H, Thornorgeirsson T, Steinberg S, Gustafsson O, Bergen SE, Nimgaonkar V, Hultman C, Landen M, Lichtenstein P, Sullivan P, Schalling M, Osby U, Backlund L, Frisen L, Langstrom N, Jamain S, Leboyer M, Etain B, Bellivier F, Petursson H, Sigur Sson E, Muller‐Mysok B, Lucae S, Schwarz M, Schofield PR, Martin N, Montgomery GW, Lathrop M, Oskarsson H, Bauer M, Wright A, Mitchell PB, Hautzinger M, Reif A, Kelsoe JR, Purcell SM. 2011. Large‐scale genome‐wide association analysis of bipolar disorder identifies a new susceptibility locus near ODZ4. Nat Genet 43(10):977–983. [DOI] [PMC free article] [PubMed] [Google Scholar]
- Sklar P, Smoller JW, Fan J, Ferreira MA, Perlis RH, Chambert K, Nimgaonkar VL, McQueen MB, Faraone SV, Kirby A, de Bakker PI, Ogdie MN, Thase ME, Sachs GS, Todd‐Brown K, Gabriel SB, Sougnez C, Gates C, Blumenstiel B, Defelice M, Ardlie KG, Franklin J, Muir WJ, McGhee KA, MacIntyre DJ, McLean A, VanBeck M, McQuillin A, Bass NJ, Robinson M, Lawrence J, Anjorin A, Curtis D, Scolnick EM, Daly MJ, Blackwood DH, Gurling HM, Purcell SM. 2008. Whole‐genome association study of bipolar disorder. Mol Psychiatry 13(6):558–569. [DOI] [PMC free article] [PubMed] [Google Scholar]
- Smith EN, Bloss CS, Badner JA, Barrett T, Belmonte PL, Berrettini W, Byerley W, Coryell W, Craig D, Edenberg HJ, Eskin E, Foroud T, Gershon E, Greenwood TA, Hipolito M, Koller DL, Lawson WB, Liu C, Lohoff F, McInnis MG, McMahon FJ, Mirel DB, Murray SS, Nievergelt C, Nurnberger J, Nwulia EA, Paschall J, Potash JB, Rice J, Schulze TG, Scheftner W, Panganiban C, Zaitlen N, Zandi PP, Zollner S, Schork NJ, Kelsoe JR. 2009. Genome‐wide association study of bipolar disorder in European American and African American individuals. Mol Psychiatry 14(8):755–763. [DOI] [PMC free article] [PubMed] [Google Scholar]
- Smoller JW, Craddock N, Kendler K, Lee PH, Neale BM, Nurnberger JI, Ripke S, Santangelo S, Sullivan PF. 2013. Identification of risk loci with shared effects on five major psychiatric disorders: A genome‐wide analysis. Lancet 381(9875):1371–1379. [DOI] [PMC free article] [PubMed] [Google Scholar]
- Sullivan PF, Daly MJ, O'Donovan M. 2012. Genetic architectures of psychiatric disorders: The emerging picture and its implications. Nat Rev Genet 13(8):537–551. [DOI] [PMC free article] [PubMed] [Google Scholar]
- Terwisscha van Scheltinga AF, Bakker SC, van Haren NE, Derks EM, Buizer‐Voskamp JE, Boos HB, Cahn W, Hulshoff Pol HE, Ripke S, Ophoff RA, Kahn RS. 2012. Genetic schizophrenia risk variants jointly modulate total brain and white matter volume. Biol Psychiatry 73(6):525–531. [DOI] [PMC free article] [PubMed] [Google Scholar]
- Visscher PM, Hemani G, Vinkhuyzen AA, Chen GB, Lee SH, Wray NR, Goddard ME, Yang J. 2014. Statistical power to detect genetic (co) variance of complex traits using SNP data in unrelated samples. PLoS Genet 10(4):e1004269. [DOI] [PMC free article] [PubMed] [Google Scholar]
- Whalley HC, Papmeyer M, Sprooten E, Romaniuk L, Blackwood DH, Glahn DC, Hall J, Lawrie SM, Sussmann J, McIntosh AM. 2012. The influence of polygenic risk for bipolar disorder on neural activation assessed using fMRI. Transl Psychiatry 2:e130. [DOI] [PMC free article] [PubMed] [Google Scholar]
- Whalley HC, Sprooten E, Hackett S, Hall L, Blackwood DH, Glahn DC, Bastin M, Hall J, Lawrie SM, Sussmann JE, McIntosh AM. 2013. Polygenic risk and white matter integrity in individuals at high risk of mood disorder. Biol Psychiatry. [DOI] [PMC free article] [PubMed] [Google Scholar]
- Wray NR, Yang J, Goddard ME, Visscher PM. 2010. The genetic interpretation of area under the ROC curve in genomic profiling. PLoS Genet 6(2):e1000864. [DOI] [PMC free article] [PubMed] [Google Scholar]
- Wray NR, Yang J, Hayes BJ, Price AL, Goddard ME, Visscher PM. 2013. Pitfalls of predicting complex traits from SNPs. Nat Rev Genet 14(7):507–515. [DOI] [PMC free article] [PubMed] [Google Scholar]
- Yang J, Visscher PM, Wray NR. 2010. Sporadic cases are the norm for complex disease. Eur J Hum Genet 18(9):1039–1043. [DOI] [PMC free article] [PubMed] [Google Scholar]
Associated Data
This section collects any data citations, data availability statements, or supplementary materials included in this article.
Supplementary Materials
Additional supporting information may be found in the online version of this article at the publisher's web‐site.
Supporting Information.