

Abstract
Objective
To assess the safety and immunologic impact of inhibiting interferon‐γ (IFNγ) with AMG 811, a human IgG1 monoclonal antibody against IFNγ, in patients with systemic lupus erythematosus (SLE).
Methods
Twenty‐six patients with mild‐to‐moderate, stable SLE were administered placebo or a single dose of AMG 811, ranging from 2 mg to 180 mg subcutaneously or 60 mg intravenously.
Results
Similar to results previously reported following inhibition of type I IFNs, treatment of SLE patients with AMG 811 led to a dose‐dependent modulation of the expression of genes associated with IFN signaling, as assessed by microarray analysis of the whole blood. The list of impacted genes overlapped with that identified by stimulating human whole blood with IFNγ and with those gene sets reported in the literature to be differentially expressed in SLE patients. Serum levels of IFNγ‐induced chemokines, including IFNγ‐inducible protein 10 (IP‐10), were found to be elevated at baseline in SLE patients as compared to healthy volunteers. In contrast to previously reported results from studies using type I IFN–blocking agents, treatment with AMG 811 led to dose‐related reductions in the serum levels of CXCL10 (IP‐10).
Conclusion
The scope and nature of the biomarkers impacted by AMG 811 support targeting of IFNγ as a therapeutic strategy for SLE.
Systemic lupus erythematosus (SLE) is an autoimmune disease of unknown etiology that has wide‐ranging clinical manifestations and is marked by autoreactivity to nuclear self antigens 1, 2. Interferons (IFNs) are thought to play a pathogenic role in autoimmunity, and in SLE in particular, supported, in part, by the finding of a peripheral blood gene expression profile (IFN signature) in some individuals that is distinct from that in individuals without autoimmune disease 3, 4, 5. In addition, serum levels of chemokines related to IFN activity have been found to be elevated in SLE patients, a finding that is associated with the extent of disease activity 6, 7, 8, 9, 10. Specifically, CXCL10 has been shown to be a major contributor to the overall association and an independent predictor of future disease flare 6.
While considerable attention has been focused on type I IFNs in driving the IFN‐associated gene expression profiles observed in SLE, the type I IFN and type II IFN (IFNγ) pathways overlap considerably in the immune response, making it difficult to distinguish their relative contributions in disease pathogenesis. Type I and type II IFNs signal through distinct receptors (IFNα receptor and IFNγ receptor, respectively), but their signaling pathways overlap with variable and, at times, opposing functional effects 11, 12, 13. Recent investigations of synovial tissue from subjects with rheumatic diseases have identified specific gene transcripts and proteins that may be useful for distinguishing between the 2 IFN pathways 14, 15. Data supporting a pathogenic role for IFNγ in SLE include findings from murine models of SLE 16, 17, 18, 19, 20 and from in vitro studies of blood from SLE patients 21, 22. In humans, administration of IFNγ can induce SLE or a lupus‐like phenomenon such as production of autoantibodies 23.
Administration of monoclonal antibodies against the IFNα pathway results in decreases in RNA expression from IFN‐inducible genes in whole blood from SLE patients 24, 25, 26, but change in IFN‐associated serum protein levels has not been reported. In the present study, we describe the immunologic impact of the first clinical experience of IFNγ blockade in SLE patients. Single‐dose administration of AMG 811, an investigational monoclonal antibody that blocks the function of IFNγ, led to normalization of the levels of IFN‐inducible genes in the patients’ peripheral blood and normalization of the serum levels of CXCL10 protein, a key chemokine associated with lupus disease activity.
PATIENTS AND METHODS
Study design
The present study was a multicenter, randomized, double‐blind, placebo‐controlled, single‐dose escalation study that enrolled patients with mild‐to‐moderate, stable SLE in 6 cohorts. Informed consent was obtained from all study participants. Patients in cohorts 1–5 received a single subcutaneous (SC) dose of either 2, 6, 20, 60, or 180 mg AMG 811 or placebo. Patients in cohort 6 received an intravenous (IV) dose of 60 mg AMG 811 or placebo. Criteria for enrollment included men and women ages 18–65 years with a diagnosis of SLE according to the American College of Rheumatology revised criteria for SLE 27 as updated in 1997 28, including a positive finding of antinuclear antibodies at screening. Patients with severe disease were excluded; severe disease was defined on the basis of the clinical judgment of the investigator or as one domain A score or two domain B scores on the British Isles Lupus Assessment Group (BILAG) clinical disease activity index 29 in any of the assessed organ systems at screening. Antimalarial agents, leflunomide, azathioprine, methotrexate, and up to 20 mg/day of prednisone (or equivalent) were permitted as concomitant therapies. Following treatment, patients in each cohort were followed up for a minimum of 84 days (in cohort 1) up to a maximum of 196 days (in cohort 5).
Serum and PAXgene blood RNA tube samples were collected from all cohorts at baseline, day 1 (predose), day 15, day 56, and end of study (EOS) after treatment. All samples were included for analysis, with the exception of 4 samples for which no PAXgene RNA tube was collected by the clinical sites (1 EOS sample from the placebo cohort, 1 EOS sample from the 6 mg AMG 811–treated cohort, and 2 day 15 samples from the 20 mg AMG 811–treated cohort). One sample at the day 15 time point (60 mg IV AMG 811) was subsequently determined to be from an unscheduled day 8 visit. As an actual day 15 sample was not available from this patient, and the expected drug exposure was not anticipated to be very different between day 8 and day 15, this sample was included with the day 15 results.
Evaluation of pharmacokinetics, immunogenicity, and total IFNγ levels
Levels of AMG 811 in the serum were determined using a sandwich immunoassay (validated at Amgen). Study samples were added to a plate coated with a mouse anti–AMG 811 monoclonal antibody (clone no. AB 1c2.1; Amgen). After capture of AMG 811 to the immobilized antibody, unbound materials were removed by a washing step. Biotin‐conjugated rabbit anti–AMG 811 polyclonal antibody (Amgen) was added for detection of captured AMG 811. After another incubation step with streptavidin–horseradish peroxidase (HRP), a tetramethylbenzidine (TMB) peroxide substrate solution (KPL) was added to produce a colorimetric signal, which was proportional to the amount of AMG 811 bound by the capture reagent. The color development was stopped by the addition of H2SO4, and the optical density (OD) signal was measured at 450 nm, with reference to the OD value at 650 nm. The absorbance versus concentration relationship was regressed according to a 4‐parameter logistic (autoestimate) regression model with a weighting factor of 1/Y. The lower limit of quantification (LLOQ) was 15.2 ng/ml.
The presence of anti–AMG 811 antibodies was assessed using 2 assays. First, an electrochemiluminescence bridging immunoassay was used to detect binding antibodies (screening assay) and to confirm the antibodies capable of binding AMG 811 (confirmatory assay). The sensitivity of this immunoassay was 15 ng/ml. Second, a cell‐based bioassay was used to test for neutralizing activity of the binding antibodies against AMG 811. The sensitivity of the bioassay was 1 μg/ml. If a sample was positive for binding antibodies and demonstrated neutralizing activity at the same time point, the patient was defined as being positive for neutralizing antibodies.
Serum levels of total IFNγ in patients receiving AMG 811 (all dose groups) were also determined. The total IFNγ concentration in human serum was measured using a sandwich immunoassay (validated at Amgen). Specifically, study samples were incubated with 25 μg/ml of AMG 811 at 37°C to form an IFNγ–AMG 811 complex, prior to being added to a plate coated with a mouse anti‐IFNγ monoclonal antibody (Hycult Biotechnology). After capture of the IFNγ–AMG 811 complex to the immobilized antibody, unbound materials were removed by a washing step. Biotin‐conjugated rabbit anti–AMG 811 polyclonal antibody (Amgen) was added for detection of captured IFNγ–AMG 811 complex. After another incubation step with streptavidin–HRP, a TMB peroxide substrate solution (KPL) was added to produce a colorimetric signal, which was proportional to the amount of IFNγ bound by the capture reagent. The color development was stopped by the addition of H2SO4, and the OD signal was measured at 450 nm, with reference to the OD value at 650 nm. The absorbance versus concentration relationship was regressed according to a 4‐parameter logistic (autoestimate) regression model with a weighting factor of 1/Y. The LLOQ of the method was 50 pg/ml.
Stimulation of whole blood from healthy volunteers.
Blood from healthy volunteers (n = 4) was collected into sodium heparin tubes. The blood samples were left untreated or treated with 294 pM recombinant human IFNγ for 0, 24, or 48 hours, with incubation at 37°C in an atmosphere of 5% CO2. The blood was then added to PAXgene tubes and processed for RNA purification. The demographic characteristics of the healthy subjects were not matched to those of the SLE patients.
Gene expression analysis
For experiments to compare gene expression between the SLE patients and healthy volunteers, peripheral blood was obtained from subjects from a different clinical study and collected directly into PAXgene tubes. Total RNA was isolated from the PAXgene whole blood tubes (catalog no. 762165; BD Biosciences) using a PAXgene RNA kit (catalog no. 762164; Qiagen) on a Qiacube Automated Sample Prep system. Samples were labeled using an Agilent Low RNA Input Linear Amplification PLUS kit (Two‐Color kit, catalog no. 5188‐5340) in accordance with the manufacturer's instructions. The resulting fluorescent complementary RNA was hybridized to Agilent human whole genome 4x44K (catalog no. G4112F) oligonucleotide microarrays, in accordance with the manufacturer's instructions.
Extracted feature intensities for each channel on each array were processed separately by subtracting the lower 0.1th percentile from all intensities and then taking the log base 2. The transformed intensities were mapped using a nonlinear function to ensure that the distributions of the intensities were comparable between arrays and channels.
Samples were processed in batches that roughly corresponded to samples from individual cohorts, but with a small number of samples repeated between batches to allow estimation and removal of batch effects. Finally, replicates of any identical sequences on the array were averaged to produce expression values, referred to as gene intensities.
In addition to the above processing, a prefiltering step was applied to remove genes from the IFNγ stimulation experiment. Reporters with low levels of expression were removed if 90% of the values fell below the limit of detection, defined as 1.96 standard deviations above the mean background level. Background was determined by a set of sequences on the array that are specifically designed to not hybridize with human sequences. Reporters with small dispersion, defined as those for which the fold change in expression between the 5th and 95th percentile was less than 1.5, were removed.
Chemokine and cytokine measurements
Human whole blood was collected in serum separator tubes (red/black marble top; Becton Dickinson) and processed at room temperature. The serum samples were frozen immediately after collection at the individual clinical sites. Serum concentrations of CXCL10, CCL2, RANTES, and interleukin‐18 (IL‐18) were determined with commercially available enzyme‐linked immunosorbent assays, according to the manufacturers’ instructions (R&D Systems and Medical & Biological Laboratories). Samples were analyzed in triplicate and levels were quantified by interpolation from a standard curve, run in parallel on each microtiter plate.
Statistical analysis
Identification of genes that were differentially regulated by ex vivo stimulation with IFNγ was performed using a fixed‐effects regression model containing factors for donor, time, treatment, and all pairwise interactions terms. The treatment effect was similar at the 2 posttreatment times (data not shown), and therefore these time points were considered as a single group to display the treatment effect. The significance threshold was determined using a false discovery rate of 5% 30 and defined as a fold change in gene expression of 1.72.
Differences in gene expression between AMG 811–treated day 15 samples and all other samples (all subject baseline and day 15 placebo) were estimated using a fixed‐effects regression model. The model contained factors for subject and an indicator of active treatment (any dose after administration). A comparison was made between the mean value in samples from actively treated day 15 subjects and all other samples, to estimate the log 2 ratio of AMG 811 treatment effect.
Separate IFNγ scores were derived based on 2 published gene sets: set A 4 (comprising 46 genes; not all 49 genes could be mapped to our array), and set B 3 (comprising 13 genes; not all 14 genes could be mapped). Both lists were based on ex vivo stimulated genes that were also found to be regulated in expression analyses of SLE peripheral blood mononuclear cells. These were compared to an IFNγ score derived from the gene set developed herein, designated gene set C (comprising 432 genes). To create scores, the gene lists were mapped to reporters on the Agilent array and the corresponding gene intensities were used in a principal components analysis. The first principal component was used as the score.
Gene dysregulation in SLE was examined in a separate study of 19 healthy subjects and 39 SLE patients. The log ratios of gene expression in SLE patients relative to healthy subjects, along with the 95% confidence intervals, were estimated using linear regression, with results expressed as the fold change.
Changes in CXCL10 levels were examined with a baseline adjusted mixed‐effects regression model of the log ratio relative to baseline levels of CXCL10, including factors for assigned dose, time since first dose, dose‐by‐time interaction, and subject as a random effect, and including a covariate for baseline log CXCL10 levels.
RESULTS
Baseline characteristics and clinical findings
Twenty‐six patients with mild, stable SLE were enrolled in this phase I, single‐dose clinical trial. There were 3 patients treated with active drug in each cohort (total of 18 patients) and 8 patients in the total placebo group. The mean age was 43.3 years in the active drug group and 44.1 years in the placebo group (Table 1). The patients were predominantly female (92%) and white (62%). The mean scores on the Safety of Estrogens in Lupus Erythematosus National Assessment (SELENA) version of the SLE Disease Activity Index (SLEDAI) 31 were 2.3 in the placebo group and 3.8 in the AMG 811 group. In total, 50% of placebo‐treated patients and 28% of patients in the active drug group were taking corticosteroids (mean dose 10 mg/day and 13.5 mg/day, respectively).
Table 1.
Demographic and clinical characteristics of the study patients at baselinea
| Placebo (n = 8) | AMG 811 total (n = 18) | |
|---|---|---|
| Age, mean ± SD years | 44.1 ± 13.6 | 43.3 ± 11.6 |
| Sex, no. (%) female/male | 6 (75)/2 (25) | 18 (100)/0 |
| Race or ethnicity, no. (%) | ||
| White | 4 (50) | 12 (67) |
| Black or African American | 2 (25) | 2 (11) |
| Hispanic or Latino | 1 (13) | 4 (22) |
| Asian | 1 (13) | 0 (0) |
| BMI, mean ± SD kg/m2 | 25.2 ± 3.8 | 28.5 ± 5.7 |
| Duration of SLE, years | ||
| Mean ± SD | 9.4 ± 5.2 | 9.1 ± 7.1 |
| Median (range) | 7.1 (4.0–17.8) | 6.1 (0.7–22.9) |
| SELENA–SLEDAI score | ||
| Mean ± SD | 2.3 ± 3.1 | 3.8 ± 2.7 |
| Median (range) | 1 (0–8) | 4 (0–8) |
| PGA score, mean ± SD | 0.69 ± 0.76 | 0.49 ± 0.43 |
| Anti‐dsDNA, no. (%) | 3 (38) | 6 (33) |
| C3 levels below LLN, no. (%) | 5 (63) | 7 (39) |
| C4 levels below LLN, no. (%) | 3 (38) | 2 (11) |
| Concurrent medication | ||
| Prednisone or equivalent | ||
| No. (%) | 4 (50) | 5 (28) |
| Dosage, mg/day | ||
| Mean ± SD | 10 ± 0 | 13.5 ± 4.2 |
| Median (range) | 10 (10–10) | 12.5 (10–20) |
| Antimalarial drugs, no. (%) | 6 (75) | 18 (100) |
BMI = body mass index; SLE = systemic lupus erythematosus; SELENA–SLEDAI = Safety of Estrogens in Lupus Erythematosus National Assessment version of the SLE Disease Activity Index; PGA = physician's global assessment of disease activity; anti‐dsDNA = anti–double‐stranded DNA; LLN = lower limit of normal.
Treatment with AMG 811 was generally well tolerated, with no deaths and no withdrawals due to adverse events (see Supplementary Tables 1 and 2, available on the Arthritis & Rheumatology web site at http://onlinelibrary.wiley.com/doi/10.1002/art.39248/abstract). There was 1 serious adverse event in the AMG 811–treated group: a patient who received 60 mg AMG 811 SC was hospitalized and treated with IV antibiotics for pyelonephritis ∼3 months posttreatment. Given the small size of the study and the low disease activity at enrollment, the study was not designed to assess clinical efficacy. No significant treatment‐related changes were noted in the disease outcome measures (BILAG global scores and SELENA–SLEDAI scores; details in Supplementary Figures 1 and 2, available on the Arthritis & Rheumatology web site at http://onlinelibrary.wiley.com/doi/10.1002/art.39248/abstract), and no significant treatment‐related changes were seen over time in the levels of C3, C4, CH50, or anti–double‐stranded DNA in response to AMG 811 treatment (data not shown).
Pharmacokinetics of AMG 811, immunogenic response, and total circulating IFNγ levels
Following single SC dosing of AMG 811, exposure increased approximately dose‐proportionally between the lowest dose of 2 mg and the highest dose of 180 mg, with the median time to reach maximum concentration ranging between 4 days and 14 days (Figure 1A). AMG 811 exhibited linear pharmacokinetics, with a mean terminal half‐life ranging from 12 days to 21 days (see Supplementary Table 3, available on the Arthritis & Rheumatology web site at http://onlinelibrary.wiley.com/doi/10.1002/art.39248/abstract). Following a single 60‐mg IV dose of AMG 811 (n = 3), the mean area under the curve was ∼3‐fold higher than that following the 60‐mg SC dose (n = 3), indicating that the bioavailability of AMG 811 was ∼30% in this small group of patients.
Figure 1.
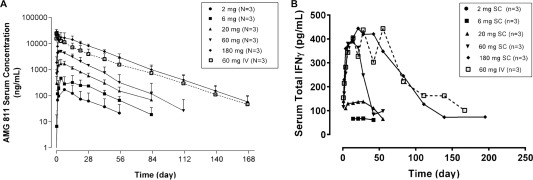
AMG 811 serum concentration–time (A) and total interferon‐γ (IFNγ) serum concentration–time (B) profiles following a single subcutaneous (SC) dose (2–180 mg) or intravenous (IV) dose (60 mg) of AMG 811 in patients with systemic lupus erythematosus. Results are the mean ± SD.
All patients were tested for the presence (baseline) or development (posttreatment) of anti–AMG 811 antibodies 32, 33. One patient, who was receiving 6 mg AMG 811 SC, was found to be positive for binding antibodies to AMG 811 during the study, but these antibodies were negative for neutralizing activity. All other patients were negative for anti–AMG 811 binding antibodies at all time points tested (data not shown).
As a first step in assessing the impact of treatment with AMG 811, an assay to detect total serum IFNγ (i.e., free or complexed to AMG 811) was developed. Immediately following administration of AMG 811, the mean total IFNγ levels were elevated in a dose‐dependent manner, and then returned to baseline levels over time (Figure 1B), a finding that was similar to the pharmacokinetics profile. Although total IFNγ levels initially increased after AMG 811 treatment, a comparison to the concentration of AMG 811 in the serum indicates that there was a large molar excess of antibody present at all times relative to the amount of IFNγ detected in the complex (data not shown).
Contribution of type I and type II IFN genes to the IFN signature observed in SLE patients
Previous reports have demonstrated that ∼50% of all adult SLE patients have a distinct gene expression profile that contains select genes that are known to be stimulated ex vivo by IFN (the IFN signature). Two separate sets of IFN‐stimulated genes have been described (designated herein as gene set A and gene set B) 3, 4. Set A was identified by ex vivo stimulation with IFNα and IFNβ, and was filtered on the basis of gene expression differences that are also seen in patients with SLE. Set B was derived by ex vivo stimulation with IFNα, and this set also intersects with SLE signature genes. The overlap with our set of IFNγ signature genes is shown in Supplementary Table 4, available on the Arthritis & Rheumatology web site at http://onlinelibrary.wiley.com/doi/10.1002/art.39248/abstract.
To better characterize the potential downstream gene transcripts that can serve as pharmacodynamic markers for AMG 811, we derived an IFNγ‐associated signature and corresponding score by identifying genes in the whole blood of SLE patients that were regulated by ex vivo stimulation with IFNγ. The volcano plot 34 in Figure 2A shows the fold change in expression of each gene (stimulated relative to unstimulated), along with the P value from the associated F test (analysis of variance). An IFNγ score (as described in Patients and Methods) was generated from 526 sequences, corresponding to 432 transcripts (gene set C), that met the significance criteria. While most modulated genes were up‐regulated, some of the genes showed decreased levels in response to stimulation.
Figure 2.
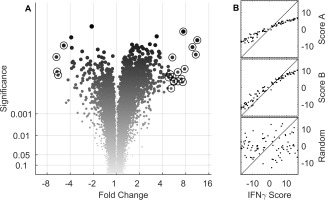
Identification of the interferon‐γ (IFNγ) signature set and comparison to published IFN signatures. A, Volcano plot shows the mean fold change in gene expression (IFNγ‐stimulated relative to unstimulated) in whole blood from healthy volunteers, plotted with the associated P values determined by analysis of variance. Circled symbols indicate the 20 genes with the largest magnitude of change in expression, exceeding a significance level of 0.001. B, Two IFNγ scores were derived from 2 published gene lists (score A from gene set A [top] and score B from gene set B [middle]), and these were compared to an IFNγ score based on a set of 432 genes (gene set C) that met the significance criteria for modulated gene expression in IFNγ‐stimulated blood samples from healthy volunteers. A random selection of 500 genes (bottom) was used as a negative control. The broken diagonal line represents a reference to indicate perfect correlation.
We compared these 3 transcript sets and determined the number of transcripts resulting from the intersection of the sets. Considerable commonality was observed between the SLE‐associated gene sets. There were 10 overlapping transcripts in gene set A and gene set B, 20 in gene set A and gene set C, 6 in gene set B and gene set C, and 5 in gene set A, gene set B, and gene set C (see Supplementary Table 4).
To examine the relationship between the gene sets, the IFNγ scores from gene sets A and B were plotted against gene set C (Figure 2B). The scores were highly correlated, suggesting that the information content in their scores was qualitatively similar. The robustness of the correlation was particularly striking given the technical differences between the various microarray studies analyzed. A score from a randomly selected set of 500 genes served as a negative control (Figure 2B, bottom panel). Uniquely IFNα or IFNγ scores were not obviously discernible using this method.
Effect of AMG 811 treatment in modulating the IFN‐regulated gene expression profile in SLE patients toward the profile seen in healthy individuals
The impact of AMG 811 treatment on global gene expression in the whole blood was assessed, and changes that had occurred by day 15 after administration of any dose of AMG 811, as compared to all baseline values and as compared to samples from placebo‐treated patients (as described in Patients and Methods), were determined (as shown in the volcano plot in Figure 3A). Notably, a number of genes that were down‐regulated after treatment with AMG 811 overlapped with the list of the top 20 genes stimulated by IFNγ ex vivo (circled areas on the plot in Figure 3A), even though the lists were independently derived.
Figure 3.
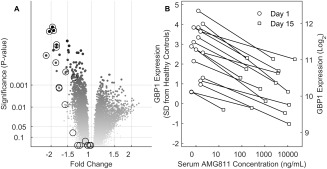
Interferon‐γ (IFNγ) blockade with AMG 811 leads to normalization of the IFN‐related gene expression profile in systemic lupus erythematosus patients. A, Volcano plot shows the mean fold difference in gene expression posttreatment (day 15) in blood samples from AMG 811–treated patients compared to all other samples (all samples at baseline and placebo‐treated patients on day 15). Circled symbols indicate the top 20 IFNγ signature genes. B, Relationship between the serum AMG 811 concentration and guanylate binding protein 1 (GBP‐1) transcript expression on days 1 and 15 posttreatment. The GBP‐1 gene expression levels were standardized against the levels seen in the healthy volunteers, and values were plotted against the serum AMG 811 concentration. SD = standard deviation.
The change in gene expression was generally (albeit not always) correlated with the concentration of circulating AMG 811. The most pronounced example of the magnitude of the concentration‐dependent pharmacologic effect of AMG 811 on gene expression is demonstrated in the changes to the expression of guanylate binding protein 1 (GBP‐1) over 15 days (Figure 3B). There was no apparent correlation between the baseline IFNγ score and response to AMG 811 (data not shown). Considerable change in GBP‐1 expression was observed in some placebo‐treated patients, but the direction of change was not consistent, and the expression was, on average, not different between study days (P = 0.54; data not shown). In contrast, expression of the GBP‐1 gene declined from baseline to day 15 in all individuals treated with AMG 811, thus demonstrating a pharmacodynamic effect (Figure 3B).
Although these results are a striking example of the effect of AMG 811 treatment, the extent of the effect of AMG 811 on other genes known to be regulated by IFNγ was variable. Table 2 contains a summation of the gene transcripts most impacted by IFNγ stimulation in vitro, a comparison of the expression levels of these genes between SLE patients and healthy subjects, and expression data indicating the impact of AMG 811 administration on these genes in SLE patients. To help understand the impact of AMG 811 on type I IFN–inducible genes, we examined expression of the unique set of genes from the IFNα‐ and IFNβ‐inducible sets (gene sets A and B) that did not appear in the IFNγ‐inducible set (gene set C). None of these genes were differentially regulated by day 15 after administration of AMG 811 (data not shown).
Table 2.
Top genes showing changes in expression after stimulation with IFNγ or at 15 days after treatment with AMG 811a
| Probe | Symbol; product | IFNγ‐stimulated, mean fold change from baseline (95% CI) | SLE patients vs. healthy subjects, mean fold difference on day 15 (95% CI) | Treatment effect | |
|---|---|---|---|---|---|
| Mean fold change from baseline (95% CI) | P | ||||
| A_23_P112026 | IDO1; indoleamine 2,3‐dioxygenase 1 | 11.3 (10.0, 12.8) | 1.1 (−1.2, 1.4) | −1.4 (−2.0, 1.0) | 0.076 |
| A_23_P161428 | ANKRD22; ankyrin repeat domain 22 | 10.8 (8.8, 13.2) | 1.3 (−1.0, 1.7) | −2.2 (−3.0, −1.6) | <0.001 |
| A_23_P18452 | CXCL9; chemokine (C‐X‐C motif) ligand 9 | 9.8 (8.4, 11.4) | 1.3 (1.1, 1.5) | −1.3 (−1.6, −1.2) | <0.001 |
| A_24_P28722 | RSAD2; radical S‐adenosyl methionine domain containing 2 | 7.7 (5.9, 10.1) | 5.2 (2.3, 11.5) | −1.3 (−1.8, 1.1) | 0.184 |
| A_23_P7827 | FAM26F; family with sequence similarity 26, member F | 7.4 (6.9, 8.0) | 1.2 (−1.0, 1.5) | −1.6 (−1.9, −1.3) | <0.001 |
| A_24_P165864 | P2RY14; purinergic receptor P2Y, G protein coupled, 14 | 7.3 (5.0, 10.7) | −1.1 (−1.5, 1.2) | −1.7 (−2.4, −1.3) | 0.001 |
| A_23_P74290 | GBP5; guanylate binding protein 5 | 7.0 (5.0, 9.8) | 1.3 (1.0, 1.7) | −1.8 (−2.3, −1.5) | <0.001 |
| A_24_P561165 | SERPING1; serpin peptidase inhibitor, clade G, member 1 | 6.4 (4.5, 8.9) | 2.5 (1.7, 3.8) | −1.7 (−2.4, −1.3) | 0.001 |
| A_23_P63390 | FCGR1B; Fc fragment of IgG, high affinity Ib receptor (CD64) | 6.3 (4.8, 8.2) | 1.2 (−1.1, 1.6) | −2.1 (−2.6, −1.6) | <0.001 |
| A_23_P150457 | LYVE1; lymphatic vessel endothelial hyaluronan receptor 1 | −6.0 (−7.1, −5.1) | −1.0 (−1.2, 1.1) | −1.1 (−1.2, 1.1) | 0.367 |
| A_24_P245379 | SERPINB2; serpin peptidase inhibitor, clade B (ovalbumin), member 2 | −5.9 (−7.6, −4.6) | 1.0 (−1.2, 1.2) | −1.1 (−1.3, 1.1) | 0.536 |
| A_23_P203882 | MMP19; matrix metallopeptidase 19 | −5.8 (−7.6, −4.4) | 1.2 (1.0, 1.4) | −1.0 (−1.2, 1.1) | 0.699 |
| A_23_P62890 | GBP1; guanylate binding protein 1, interferon‐inducible, 67 kd | 5.6 (4.0, 7.7) | 1.6 (1.1, 2.2) | −2.0 (−2.4, −1.6) | <0.001 |
| A_32_P107372 | GBP1; guanylate binding protein 1, interferon‐inducible, 67 kd | 5.6 (4.1, 7.6) | 1.6 (1.2, 2.1) | −1.9 (−2.4, −1.5) | <0.001 |
| A_24_P303091 | CXCL10; chemokine (C‐X‐C motif) ligand 10 | 5.4 (4.1, 7.1) | 1.3 (−1.0, 1.8) | −1.6 (−2.2, −1.1) | 0.008 |
| A_24_P316965 | RSAD2; radical S‐adenosyl methionine domain containing 2 | 5.4 (4.6, 6.3) | 3.6 (2.1, 6.2) | −1.2 (−1.7, 1.1) | 0.235 |
| A_23_P42353 | ETV7; ets variant 7 | 5.2 (3.6, 7.5) | 1.8 (1.3, 2.6) | −1.8 (−2.4, −1.4) | <0.001 |
| A_23_P256487 | PD‐L1; programmed death ligand 1 | 5.0 (3.9, 6.4) | 1.2 (1.1, 1.4) | −1.8 (−2.3, −1.4) | <0.001 |
| A_23_P121657 | HS3ST1; heparan sulfate (glucosamine) 3‐o‐sulfotransferase 1 | −4.9 (−5.4, −4.4) | 1.0 (−1.3, 1.3) | −1.0 (−1.2, 1.1) | 0.892 |
| A_24_P12690 | IDO2; indoleamine 2,3‐dioxygenase 2 | 4.8 (3.7, 6.2) | 1.0 (−1.1, 1.2) | −1.1 (−1.3, 1.0) | 0.126 |
IFNγ = interferon‐γ; 95% CI = 95% confidence interval; SLE = systemic lupus erythematosus.
Dose‐dependent decrease in serum CXCL10 levels in response to AMG 811 treatment
Aberrant levels of serum chemokines, particularly those associated with the IFN pathways, have been described and have been shown to be correlated with the extent of disease severity and future occurrence of flare 6, 7, 8, 9, 10. Serum levels of IL‐18, CXCL10, CCL2, and RANTES were assessed in healthy volunteers and SLE patients. In confirmation of the results from previous studies, the median levels of IL‐18, CXCL10, and CCL2 were elevated in SLE patients compared to healthy volunteers (Figure 4A). No difference in RANTES levels could be demonstrated between the 2 groups (data not shown).
Figure 4.
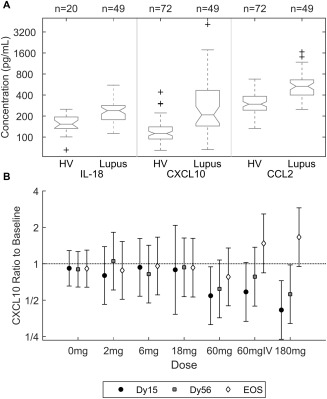
Analysis of serum proteins. A, Log concentrations of interleukin‐18 (IL‐18), CXCL10, and CCL2 in healthy volunteers (HV) and systemic lupus erythematosus patients. Values are presented as box plots, where the boxes represent the 25th and 75th percentiles (the interquartile range), the lines within the boxes represent the median, and the lines outside the boxes represent the most extreme data points within 1.5 times the interquartile range. Crosses represent outliers. B, Dose‐dependent decrease in serum levels of CXCL10 in response to AMG 811 administration. Results are the mean fold change from baseline (with 95% confidence intervals) in the concentrations of CXCL10 for each dose group of AMG 811 (2–180 mg subcutaneously or 60 mg intravenously [IV]) by study day (day 15 [Dy15], day 56 [Dy56], and end of study [EOS]), using correction for small sample size 40.
Administration of AMG 811 led to a decrease in CXCL10 protein levels by day 15, with levels returning toward baseline levels by day 56 (Figure 4B). No significant treatment effect on IL‐18, CCL2, or RANTES levels was observed (data not shown), and the levels of the related chemokines CXCL9 and CXCL11 were not measured.
DISCUSSION
The large and consistent body of evidence supporting the presence of dysregulated IFN‐related pathways in SLE makes IFNs compelling targets of therapeutic blockade. While several therapeutic antibodies aimed at inhibition of IFNα are in clinical development, we report herein our findings regarding the first experience with IFNγ blockade in SLE patients.
In this first‐in‐human study, treatment with AMG 811 was generally well tolerated. The pharmacokinetic properties of AMG 811 were consistent with those expected of a human IgG1 antibody against a soluble ligand with dose‐proportional increases in exposure (i.e., linear pharmacokinetics) and a half‐life of ∼2–3 weeks. No neutralizing antibodies against AMG 811 were detected. An assay was developed and used to measure total circulating IFNγ levels. Reported IFNγ levels in the serum are, in general, very low and often undetectable except in certain disease states 35, 36, 37. Following AMG 811 treatment, which prevents IFNγ binding to the receptor, we observed an increase in circulating IFNγ in the serum, as measured in a complex with AMG 811. This increase in measured circulating total IFNγ likely reflects the formation of antibody–ligand complexes that reduce endogenous ligand clearance, as has been observed for other cytokines following antibody administration 38, 39. These results suggest that significant, constitutive production of IFNγ occurs in SLE patients. The dose‐dependent increase and apparent correlation with the pharmacokinetics profile serve as indicators of a sufficient reserve of IFNγ in vivo.
This study enrolled patients with mild‐to‐moderate, stable SLE by design, and therefore clinical efficacy was not formally assessed. However, the patients showed clear aberrancies in their IFN‐associated gene expression profiles in the peripheral blood and in their circulating chemokine levels at baseline. In order to follow changes in gene transcription of most relevance to the IFNγ pathway, we focused on 2 different gene lists. The larger IFN‐associated gene list was defined as the transcripts that showed the most significant regulation following stimulation of human blood with IFNγ, many of which showed differential expression between SLE patients and healthy subjects. A second, independent set of genes comprised those that showed the most significant change in vivo following AMG 811 treatment. Interestingly, the genes that showed the largest change following AMG 811 treatment were also among the most highly induced by IFNγ stimulation ex vivo (Table 2 and Figure 3A). The gene associated with the largest magnitude of change in the blood and showing a clear concentration‐dependent response was GBP‐1, an interesting observation given the recent report identifying it as one of the key IFNγ‐specific genes in the synovial tissue of patients with certain autoimmune diseases 14. These data demonstrate the biologic activity of AMG 811 and provide confirmatory evidence of the role that IFNγ plays as a regulator of these transcripts in SLE patients in vivo.
Several conclusions emerge from an evaluation of the observed gene expression changes. The observations herein showing that identical transcripts are induced by IFNγ ex vivo and that these transcripts are repressed by AMG 811 treatment in vivo and are elevated in SLE patients relative to healthy donors provide evidence that IFNγ pathway activation is present in SLE patients. Importantly, these results show that the IFN dysregulation in SLE patients cannot be solely attributable to IFNα but may also be driven by IFNγ as well. The lack of impact of AMG 811 treatment on some transcripts may be due to insufficient power to detect a change in this study or insufficient coverage of the target, or may reflect regulation in vivo by multiple pathways. Further analysis will be required to reconcile these findings with the observation of an elevated IFN signature in many, but not all, adult SLE patients 3. It should also be noted that a number of genes that are up‐regulated in response to ex vivo IFNγ stimulation and demonstrate changes in response to AMG 811 treatment do not show a meaningful difference in expression between SLE patients and healthy subjects. These observations demonstrate the complexity of gene expression regulation in vivo.
Several type I IFN inhibitors have been tested in SLE patients 24, 25, 26. Those studies have demonstrated that inhibition of the type I IFN pathway can lead to a significant reversion in the expression of select, dysregulated genes whose expression is regulated by type I IFNs. Since the reports published to date have only described expression of select genes as evaluated by quantitative polymerase chain reaction (qPCR) 24, 25, 26, we could only perform a limited comparison to the global gene expression results following AMG 811 treatment. Comparison between the published results from qPCR analyses of 10 genes that reflect type I IFN activation and our microarray results indicates that none of those genes demonstrated significant changes in gene expression following AMG 811 treatment (data not shown). The sum of gene expression analyses to date suggest that the IFN signature is driven by both type I and type II IFNs in many SLE patients, and that blockade of both of these pathways may be necessary to get complete suppression of the overall IFN signature seen in some individuals. The global gene expression results presented herein will be useful for comparison when similar results from studies using type I IFN inhibitors are released.
A growing number of studies have started to identify specific serum proteins (chemokines) that likewise show a dysregulated expression in SLE patients. In one previous study, the chemokine score correlated with the extent of lupus disease activity and was predictive of future lupus flare 6, 10. In our current SLE population, we were able to confirm the findings from other study populations showing that CXCL10, CCL2, and IL‐18 serum protein levels were elevated relative to the levels in a healthy population. Administration of AMG 811 led to a dose‐dependent reduction in CXCL10 serum protein levels. To our knowledge, this has not been shown with type I IFN inhibition 24. No significant changes in CCL2 or IL‐18 levels were detected following administration of a single dose of AMG 811. The impact of AMG 811 on serum CXCL10 is particularly intriguing, given the strong correlation between this chemokine and the level of disease activity and future occurrence of disease flare 6, 10.
In conclusion, the analyses of transcript and protein expression presented herein show that SLE patients demonstrate molecular profiles consistent with aberrant IFNγ pathway activation, and that treatment with AMG 811 inhibits IFNγ signaling in a dose‐dependent manner in SLE patients. Modulation of dysregulated biomarkers by AMG 811 in SLE patients, and restoration toward the levels seen in healthy subjects, supports continued investigation of the clinical consequences of IFNγ blockade. The measurement of circulating IFNγ levels and the careful assessment of the dose‐ and concentration‐dependent changes in gene expression and serum protein profiles provide potential guideposts for monitoring the degree of pathway inhibition and choosing the optimal dose that appropriately balances benefit and risk. AMG 811 will be a useful therapeutic agent for testing this hypothesis in SLE patients and in patients whose disease is primarily driven by IFNγ. GBP‐1 and CXCL10 could be considered as potential markers to identify those individuals most likely to respond to IFNγ pathway inhibition.
AUTHOR CONTRIBUTIONS
All authors were involved in drafting the article or revising it critically for important intellectual content, and all authors approved the final version to be published. Dr. Chung had full access to all of the data in the study and takes responsibility for the integrity of the data and the accuracy of the data analysis.
Study conception and design. Welcher, Chiu, Goyal, Banfield, Chung.
Acquisition of data. Welcher, Kivitz, Amoura, Buyon, Rudinskaya, Latinis, Chiu, Oliner, Damore, Arnold, Banfield, Chung.
Analysis and interpretation of data. Welcher, Boedigheimer, Kivitz, Sohn, Chirmule, Goyal, Banfield, Chung.
ROLE OF THE STUDY SPONSOR
Amgen, Inc. provided the study drug, and reviewed and approved the manuscript prior to submission. Authors Welcher, Boedigheimer, Chiu, Oliner, Damore, Arnold, Sohn, Chirmule, Goyal, Banfield, and Chung are employees of Amgen and were involved in the study design, the data analysis and interpretation, and the writing and editing of the manuscript. Amgen approved the decision to submit the manuscript for publication.
Supporting information
Supplementary Figure 1. Change in BILAG Global Scores after treatment
Supplementary Figure 2. Change in SLEDAI Total Scores after treatment
Supplementary Table 1. Adverse events
Supplementary Table 2. Most common adverse events by treatment
Supplementary Table 3. Mean (SD) Serum AMG 811 PK Parameters Following Single SC and IV Dosing in SLE Subjects
Supplementary Table 4. Overlap of genes in three IFN signatures
ACKNOWLEDGMENTS
We thank each of the participating subjects, investigators, and study site staff in this international, multicenter trial. We thank Dr. Joan Merrill for her advice and role as the independent safety monitor for this study. We thank Nancy Chow, Yun Lan, Panteha Kiaei, Sarah Hoofring, Marta Starcevic, Susan Jacques, Arunan Kaliyaperumal, and Laura Brunner for providing technical assistance. We thank Dr. Brian Kotzin for his intellectual input and overall support.
ClinicalTrials.gov identifiers: NCT02391259 (phase Ia) and NCT00774943 (phase Ib).
REFERENCES
- 1. Kotzin BL. Systemic lupus erythematosus. Cell 1996;85:303–6. [DOI] [PubMed] [Google Scholar]
- 2. Rahman A, Isenberg DA. Systemic lupus erythematosus. N Engl J Med 2008;358:929–39. [DOI] [PubMed] [Google Scholar]
- 3. Baechler EC, Batliwalla FM, Karypis G, Gaffney PM, Ortmann WA, Espe KJ, et al. Interferon‐inducible gene expression signature in peripheral blood cells of patients with severe lupus. Proc Natl Acad Sci U S A 2003;100:2610–5. [DOI] [PMC free article] [PubMed] [Google Scholar]
- 4. Bennett L, Palucka AK, Arce E, Cantrell V, Borvak J, Banchereau J, et al. Interferon and granulopoiesis signatures in systemic lupus erythematosus blood. J Exp Med 2003;197:711–23. [DOI] [PMC free article] [PubMed] [Google Scholar]
- 5. Crow MK, George S, Paget SA, Ly N, Woodward R, Fry K, et al. Expression of an interferon‐alpha gene program in SLE [abstract]. Arthritis Rheum 2002;46 Suppl:S281. [Google Scholar]
- 6. Bauer JW, Petri M, Batliwalla FM, Koeuth T, Wilson J, Slattery C, et al. Interferon‐regulated chemokines as biomarkers of systemic lupus erythematosus disease activity: a validation study. Arthritis Rheum 2009;60:3098–107. [DOI] [PMC free article] [PubMed] [Google Scholar]
- 7. Bauer JW, Baechler EC, Petri M, Batliwalla FM, Crawford D, Ortmann WA, et al. Elevated serum levels of interferon‐regulated chemokines are biomarkers for active human systemic lupus erythematosus. PLoS Med 2006;3:e491. [DOI] [PMC free article] [PubMed] [Google Scholar]
- 8. Lit LC, Wong CK, Tam LS, Li EK, Lam CW. Raised plasma concentration and ex vivo production of inflammatory chemokines in patients with systemic lupus erythematosus. Ann Rheum Dis 2006;65:209–15. [DOI] [PMC free article] [PubMed] [Google Scholar]
- 9. Narumi S, Takeuchi T, Kobayashi Y, Konishi K. Serum levels of IFN‐inducible protein‐10 relating to the activity of systemic lupus erythematosus. Cytokine 2000;12:1561–5. [DOI] [PubMed] [Google Scholar]
- 10. Kong KO, Tan AW, Thong BY, Lian TY, Cheng YK, Teh CL, et al. Enhanced expression of interferon‐inducible protein‐10 correlates with disease activity and clinical manifestations in systemic lupus erythematosus. Clin Exp Immunol 2009;156:134–40. [DOI] [PMC free article] [PubMed] [Google Scholar]
- 11. Brinkmann V, Geiger T, Alkan S, Heusser CH. Interferon α increases the frequency of interferon γ‐producing human CD4+ T cells. J Exp Med 1993;178:1655–63. [DOI] [PMC free article] [PubMed] [Google Scholar]
- 12. Nguyen KB, Cousens LP, Doughty LA, Pien GC, Durbin JE, Biron CA. Interferon α/β‐mediated inhibition and promotion of interferon γ: STAT1 resolves a paradox. Nat Immunol 2000;1:70–6. [DOI] [PubMed] [Google Scholar]
- 13. Rayamajhi M, Humann J, Penheiter K, Andreasen K, Lenz LL. Induction of IFN‐αβ enables Listeria monocytogenes to suppress macrophage activation by IFN‐γ. J Exp Med 2010;207:327–37. [DOI] [PMC free article] [PubMed] [Google Scholar]
- 14. Hall JC, Casciola‐Rosen L, Berger AE, Kapsogeorgou EK, Cheadle C, Tzioufas AG, et al. Precise probes of type II interferon activity define the origin of interferon signatures in target tissues in rheumatic diseases. Proc Natl Acad Sci U S A 2012;109:17609–14. [DOI] [PMC free article] [PubMed] [Google Scholar]
- 15. Chiche L, Jourde‐Chiche N, Whalen E, Presnell S, Gersuk V, Dang K, et al. Modular transcriptional repertoire analyses of adults with systemic lupus erythematosus reveal distinct type I and type II interferon signatures. Arthritis Rheumatol 2014;66:1583–95. [DOI] [PMC free article] [PubMed] [Google Scholar]
- 16. Balomenos D, Rumold R, Theofilopoulos AN. Interferon‐γ is required for lupus‐like disease and lymphoaccumulation in MRL‐lpr mice. J Clin Invest 1998;101:364–71. [DOI] [PMC free article] [PubMed] [Google Scholar]
- 17. Jacob CO, van der Meide PH, McDevitt HO. In vivo treatment of (NZB × NZW)F1 lupus‐like nephritis with monoclonal antibody to γ interferon. J Exp Med 1987;166:798–803. [DOI] [PMC free article] [PubMed] [Google Scholar]
- 18. Peng SL, Moslehi J, Craft J. Roles of interferon‐γ and interleukin‐4 in murine lupus. J Clin Invest 1997;99:1936–46. [DOI] [PMC free article] [PubMed] [Google Scholar]
- 19. Hron JD, Peng SL. Type I IFN protects against murine lupus. J Immunol 2004;173:2134–42. [DOI] [PubMed] [Google Scholar]
- 20. Seery JP, Carroll JM, Cattell V, Watt FM. Antinuclear autoantibodies and lupus nephritis in transgenic mice expressing interferon γ in the epidermis. J Exp Med 1997;186:1451–9. [DOI] [PMC free article] [PubMed] [Google Scholar]
- 21. Harigai M, Kawamoto M, Hara M, Kubota T, Kamatani N, Miyasaka N. Excessive production of IFN‐γ in patients with systemic lupus erythematosus and its contribution to induction of B lymphocyte stimulator/B cell‐activating factor/TNF ligand superfamily‐13B. J Immunol 2008;181:2211–9. [DOI] [PubMed] [Google Scholar]
- 22. Karonitsch T, Feierl E, Steiner CW, Dalwigk K, Korb A, Binder N, et al. Activation of the interferon‐γ signaling pathway in systemic lupus erythematosus peripheral blood mononuclear cells. Arthritis Rheum 2009;60:1463–71. [DOI] [PubMed] [Google Scholar]
- 23. Graninger WB, Hassfeld W, Pesau BB, Machold KP, Zielinski CC, Smolen JS. Induction of systemic lupus erythematosus by interferon‐γ in a patient with rheumatoid arthritis. J Rheumatol 1991;18:1621–2. [PubMed] [Google Scholar]
- 24. McBride JM, Jiang J, Abbas AR, Morimoto A, Li J, Maciuca R, et al. Safety and pharmacodynamics of rontalizumab in patients with systemic lupus erythematosus: results of a phase I, placebo‐controlled, double‐blind, dose‐escalation study. Arthritis Rheum 2012;64:3666–76. [DOI] [PubMed] [Google Scholar]
- 25. Yao Y, Richman L, Higgs BW, Morehouse CA, de los Reyes M, Brohawn P, et al. Neutralization of interferon‐α/β–inducible genes and downstream effect in a phase I trial of an anti–interferon‐α monoclonal antibody in systemic lupus erythematosus. Arthritis Rheum 2009;60:1785–96. [DOI] [PubMed] [Google Scholar]
- 26. Petri M, Wallace DJ, Spindler A, Chindalore V, Kalunian K, Mysler E, et al. Sifalimumab, a human anti–interferon‐α monoclonal antibody, in systemic lupus erythematosus; a phase I randomized, controlled, dose‐escalation study. Arthritis Rheum 2013;65:1011–21. [DOI] [PMC free article] [PubMed] [Google Scholar]
- 27. Tan EM, Cohen AS, Fries JF, Masi AT, McShane DJ, Rothfield NF, et al. The 1982 revised criteria for the classification of systemic lupus erythematosus. Arthritis Rheum 1982;25:1271–7. [DOI] [PubMed] [Google Scholar]
- 28. Hochberg MC, for the Diagnostic and Therapeutic Criteria Committee of the American College of Rheumatology . Updating the American College of Rheumatology revised criteria for the classification of systemic lupus erythematosus [letter]. Arthritis Rheum 1997;40:1725. [DOI] [PubMed] [Google Scholar]
- 29. Symmons DP, Coppock JS, Bacon PA, Bresnihan B, Isenberg DA, Maddison P, et al, and Members of the British Isles Lupus Assessment Group (BILAG) . Development and assessment of a computerized index of clinical disease activity in systemic lupus erythematosus. Q J Med 1988;69:927–37. [PubMed] [Google Scholar]
- 30. Storey JD. A direct approach to false discovery rates. J R Stat Soc Ser B 2002;64:479–98. [Google Scholar]
- 31. Petri M, Kim MY, Kalunian KC, Grossman J, Hahn BH, Sammaritano LR, et al, for the OC‐SELENA Trial . Combined oral contraceptives in women with systemic lupus erythematosus. N Engl J Med 2005;353:2550–8. [DOI] [PubMed] [Google Scholar]
- 32. Shankar G, Devanarayan V, Amaravadi L, Barrett YC, Bowsher R, Finco‐Kent D, et al. Recommendations for the validation of immunoassays used for detection of host antibodies against biotechnology products. J Pharm Biomed Anal 2008;48:1267–81. [DOI] [PubMed] [Google Scholar]
- 33. Gupta S, Devanarayan V, Finco D, Gunn GR, Kirshner S, Richards S, et al. Recommendations for the validation of cell‐based assays used for the detection of neutralizing antibody immune responses elicited against biological therapeutics. J Pharm Biomed Anal 2011;55:878–88. [DOI] [PubMed] [Google Scholar]
- 34. Cui X, Churchill GA. Statistical tests for differential expression in cDNA microarray experiments. Genome Biol 2003;4:210. [DOI] [PMC free article] [PubMed] [Google Scholar]
- 35. Horwitz DA, Gray JD, Behrendsen SC, Kubin M, Rengaraju M, Ohtsuka K, et al. Decreased production of interleukin‐12 and other Th1‐type cytokines in patients with recent‐onset systemic lupus erythematosus. Arthritis Rheum 1998;41:838–44. [DOI] [PubMed] [Google Scholar]
- 36. Funauchi M, Sugishima H, Minoda M, Horiuchi A. Serum levels of interferon‐γ in autoimmune disease. Tohoku J Exp Med 1991;164:259–67. [DOI] [PubMed] [Google Scholar]
- 37. Akashi K, Hayashi S, Gondo H, Mizuno S, Harada M, Tamura K, et al. Involvement of interferon‐γ and macrophage colony‐stimulating factor in pathogenesis of haemophagocytic lymphohistiocytosis in adults. Br J Haematol 1994;87:243–50. [DOI] [PubMed] [Google Scholar]
- 38. Wendling D, Racadot E, Wijdenes J. Treatment of severe rheumatoid arthritis by anti‐interleukin 6 monoclonal antibody. J Rheumatol 1993;20:259–62. [PubMed] [Google Scholar]
- 39. Barrera P, Joosten LA, den Broeder AA, van de Putte LB, van Riel PL, van den Berg WB. Effects of treatment with a fully human anti‐tumour necrosis factor‐α monoclonal antibody on the local and systemic homeostasis of interleukin‐1 and TNFα in patients with rheumatoid arthritis. Ann Rheum Dis 2001;60:660–9. [DOI] [PMC free article] [PubMed] [Google Scholar]
- 40. Kackar RN, Harville DA. Approximations for standard errors of estimators of fixed and random effects in mixed linear‐models. J Am Stat Assoc 1984;79:853–62. [Google Scholar]
Associated Data
This section collects any data citations, data availability statements, or supplementary materials included in this article.
Supplementary Materials
Supplementary Figure 1. Change in BILAG Global Scores after treatment
Supplementary Figure 2. Change in SLEDAI Total Scores after treatment
Supplementary Table 1. Adverse events
Supplementary Table 2. Most common adverse events by treatment
Supplementary Table 3. Mean (SD) Serum AMG 811 PK Parameters Following Single SC and IV Dosing in SLE Subjects
Supplementary Table 4. Overlap of genes in three IFN signatures