Abstract
Cell isolation methods for therapeutic purposes have seen little advancement over the years. The original methods of stem cell and islet isolation using bacterial collagenases were developed in the early 1980s and are still used today. Bacterial collagenases are subject to autodegradation, and isolates obtained with these enzymes may be contaminated with endotoxins, reducing cell viability and contributing to toxicity in downstream applications. Here we describe a novel method for isolation of mesenchymal stem cells from adipose tissue (ADSC) utilizing recombinantly produced matrix metalloproteases (MMPs). The ADSCs isolated by MMPs displayed essentially identical morphological and phenotypical characteristics to cells isolated by bacterially-derived collagenase I and Liberase™. Samples isolated with MMPs and Liberase™ had comparable levels of CD73, CD90, and CD105. The adipogenic and osteogenic potential of the ADSCs isolated by MMPs was retained as compared to cells isolated with Liberase™. However, ADSCs isolated by Liberase™ displayed 6% contamination with other cells as per negative markers revealed by PE staining, as opposed to <1% for all MMP-treated samples. MMP-based cell isolation may contribute to optimization of transplantation technology.
Keywords: Matrix metalloproteinase, E. coli, recombinant enzyme, Clostridium histolyticum collagenase, adipose tissue, stem cell
1. Introduction
Proteases comprise over 2% of the human genome and regulate a wide range of cellular processes, including cell proliferation and differentiation, angiogenesis, neurogenesis, digestion, DNA replication and transcription, protein processing, homeostasis, development, immunity, blood coagulation, wound repair, senescence, necrosis, and apoptosis [1, 2]. The human degradome is comprised of 569 proteases distributed into five broad classes, with metalloproteases being the most abundant, followed by serine, cysteine, threonine, and aspartyl family members. Under normal conditions, protease expression and actions are controlled spatially and temporally and the substrate repertoire is highly specific. Nearly all proteases are expressed as inactive precursors (zymogens), which are transported to the site of final intra- or extra-cellular activity. These zymogens must be activated, frequently by other proteases in a sequential protease pathway. In addition, the activity may be regulated at transcriptional and post-translational level, or by native protease inhibitors. However, dysregulation of the proteolysis frequently leads to pathological processes resulting in cancer growth and metastasis, inflammatory diseases, and neurodegenerative and cardiovascular disorders [1, 2].
Given the important role proteases play in disease development and progression, there has been considerable effort in the development of protease inhibitors for various diseases. However, there are very few uses of proteases themselves for clinical applications. The few FDA-approved uses for proteases are limited to applications in stroke, acute myocardial infarction, muscle spasms, sepsis, traumatic bleeding, and blood clotting and digestive disorders. Most marketed proteases are serine proteases, except for botulinum neurotoxin (Botox®) and Clostridium histolyticum collagenase, which are zinc metalloproteases [1, 3, 4].
The matrix metalloproteinases (MMPs) are a family of zinc-dependent enzymes capable of catalyzing the degradation of virtually all extracellular matrix (ECM) components, including collagens, laminin, fibronectin, and elastin [5–7]. MMPs also selectively cleave cell surface receptors, cytokines, chemokines, and cell-cell adhesion molecules [8]. Although necessary for tissue homeostasis under normal physiological conditions, MMP dysregulation has been found in many disease states such as cancer development and survival, metastatic tumor growth, angiogenesis, invasion, modulation of the immune response, and pathological degradation of extracellular matrix (ECM) components, such as collagen and laminin. While MMP inhibition has been explored for many years in an effort to treat various diseases, to our knowledge the use of these proteases towards clinical applications, such as cell isolation or tissue engineering, has not been explored.
Adipose tissue ECM has been described as “loose connective tissue.” Immunofluorescence staining of bovine adipose tissue ECM revealed types I, III, IV, V, and VI collagen, laminin, and fibronectin [9]. More detailed proteomic analyses have shown some variation based on species, but the collagens are consistent [10]. Decorin or other proteoglycans may be important in adipose tissue ECM [10]. Quantitation of human adipose tissue ECM showed significant levels of acid-soluble collagen and elastin, but only low levels of sulfated glycoaminoglycans (GAGs) [11].
Broad-spectrum inhibition of MMPs impairs adipose tissue growth, while MMP-3 and MMP-11 deficient mice develop more adipose tissue than wild-type mice [12]. These results indicate that MMPs participate in adipose tissue remodeling. Due to that fact, as well as due to the composition of the fatty tissue and the known substrate repertoire of the MMPs, we hypothesized that they may be used to isolate adipocyte-derived stem cells.
In the present study we applied various recombinantly produced MMPs (MMP-1, MMP-3, MMP-8, MMP-9, MMP-12, MMP-19, and MMP-25) towards isolation of mesenchymal stem cells (MSCs) from adipose tissue and compared the isolation efficiency to collagenase I and Liberase™. These proteases are routinely utilized for the isolation of MSCs from various tissues. Collagenases I and II are obtained from the extremely dangerous bacillus Clostridium, an agent of gas gangrene. Crude preparations from Clostridium histolyticum contain not only collagenases but also a sulhydryl protease, clostripain, a trypsin-like enzyme, and an aminopeptidase. Liberase™ is an enzyme mixture composed of collagenases I and II and thermolysin [13]. A significant problem is that collagenase I is the most unstable component of Liberase, as the Ia form is rapidly autocatalytically degraded to the Ib form. Degraded collagenases have an adverse effect on islet viability [14]. There is a wide range of endotoxin contamination of traditional collagenase preparations compared with the endotoxin level of Liberase. However, regardless of the source, all purified collagenases and neutral proteases from bacterial bullion are contaminated with endotoxin [13, 15, 16]. Prior studies have investigated the relative amount of endotoxin in different collagenase preparations and the impact on isolated cell health [16–18] and observed that the presence of endotoxin is harmful for adipose tissue-derived stem cell (ADSC) viability. In addition, success in cell transplantation is directly proportional to the quality of cells isolated, cultivated, and allografts prepared. Thus, other, more stable enzymes need to be considered for isolation of stem and islet cells.
ADSCs isolated by protease treatments were propagated and characterized morphologically and immunophenotypically. To assure the ADSC differentiation potency, adipocyte and osteocyte cell differentiation was induced. We also demonstrate the recombinant production and characterization of full-length MMP-25, which has not been previously reported.
2. Methods and materials
2.1. Commercial enzyme activation
Buffer reagents, chymotrypsin, and Oil Red O solution (0.5% in isopropanol) were obtained from Sigma (St. Louis, MO). Liberase™ was obtained from Roche (San Francisco, CA). Collagenase I was obtained from Worthington Biochemical (Lakewood, NJ). Trypsin-3, MMP-1, MMP-3, MMP-8, and MMP-12 were obtained from R&D Biosciences (San Diego, CA). Activated MMP-9 and the catalytic domain of MMP-3 (MMP-3 CAT) were obtained from Calbiochem (La Jolla, CA). All enzymes except MMP-9 and MMP-3 CAT were activated at 20 ng/μL concentration with 5 ng chymotrypsin/5 ng trypsin mixture for 30 min at 37 °C. The reaction was stopped by addition of 2 mM PMSF (Biosynth, Itasca, IL). Enzyme activity was tested using 5 μM Knight single-stranded peptide (SSP) [Mca-Lys-Pro-Leu-Gly-Leu-Lys(Dnp)-Ala-Arg-NH2] in TSB (50 mM Tris, 150 mM NaCl, 0.02% NaN3, 0.01% Brij-35, 10 mM CaCl2, 1 μM ZnCl2, pH 7.5). The Knight SSP was synthesized by methods described previously [19, 20]. The activity of full-length MMP-25 was also tested against (Gly-Pro-Hyp)5-Gly-Pro-Lys(Mca)-Gly-Pro-Gln-Gly~Cys(Mob)-Arg-Gly-Gln-Lys(Dnp)-Gly-Val-Arg-(Gly-Pro-Hyp)5-NH2 (where Mob = 4-methoxybenzyl, Hyp = 4-hydroxy-L-proline, Mca = (7-methoxycoumarin-4-yl)acetyl, and Dnp = 2,4-dinitrophenyl), a collagen-model fluorogenic triple-helical MMP substrate previously described [21]. Activated enzyme stocks were frozen at −80 °C for further use.
2.2. Recombinant expression and production of MMP-3, MMP-12, MMP-19, and MMP-25
Recombinant catalytic (CAT) domains of MMP-3, MMP-12, and MMP-25 and the CAT domain and full length MMP-19 were produced as follows. cDNA of the CAT domain of MMP-1, MMP-3, MMP-12, and MMP-19 were amplified from commercial clone sources (Thermo Scientific, Waltham, MA) by PCR using primers containing NdeI and HindIII or BamHI restriction sites (Table 1). cDNA of the CAT domain of MMP-25 was amplified from a clone kindly provided by Dr. Rafael Fridman’s laboratory [22]. To facilitate bacterial expression, all amplified cDNA were inserted in a pET28 vector (for the CAT domain of MMP-1, MMP-3, or MMP-19) or pET21 vector (for the CAT domain of MMP-12 and MMP-25). Following transformation with the pET vector containing the appropriate insert, E. coli strain Rosetta(DE3)pLysS were grown in LB medium supplemented with 34 μg/mL of chloramphenicol and either 100 μg/mL of ampicillin (for pET21) or 50 μg/mL of Kanamycin (for pET28) until an OD600 of 0.5 was reached. E. coli were then induced with 1 mM IPTG and further incubated at 37 °C for 2 to 3 h. All recombinant MMPs were located in the inclusion bodies, which were solubilized in 6 M urea, 150 mM NaCl, 50 mM Tris, pH 8, 5 mM TCEP, 5 mM CaCl2, and 1 mM PMSF. Recombinant full-length MMP-19 and MMP-25 contained a N-terminal His-tag and were purified from inclusion bodies under denaturating conditions using a HisTrap column and gel filtration. Proper refolding was ensured by following a 3 step dialysis in buffer 1 (1.5 M urea, 50 mM Tris, pH 8, 150 mM NaCl, 5 mM CaCl2, 100 μM ZnCl2, 5 mM β-mercaptoethanol, 1 mM 2-hydroxyethyl disulphide, 0.1% Brij 35 (v/v), and 1 mM PMSF), buffer 2 (50 mM Tris, pH 8, 150 mM NaCl, 5 mM CaCl2, 50 μM ZnCl2, 5 mM β-mercaptoethanol, 1 mM 2-hydroxyethyl disulfide, 0.1% Brij 35 (v/v), and 1 mM PMSF), and buffer 3 (50 mM Tris, pH 8, 150 mM NaCl, 5 mM CaCl2, 50 μM ZnCl2, 0.1% Brij 35 (v/v), and 1 mM PMSF). Each dialysis was performed for 12 h at 4 °C and samples were centrifuged, aliquoted, and stored at −80 °C until use.
Table 1.
Primers and vectors used for the production of the CAT domains of MMP-1 (S1C), MMP-3 (S3C), MMP-12 (S12C), MMP-19 (S19C), MMP-25 (S25C), or full-length MMP-19 (S19FL).
| Enzyme | Primers used | Restriction enzyme used | Vector used | Protein sequence |
|---|---|---|---|---|
| S1C | Fwd: GCCGATCATATGTTTGTCCTCACTGAAGGC Rev: CCGATAAGCTTTCACTGGACAGGATTTTGGGAACG |
NdeI HindIII |
pET28 | F101-Q270 |
| S3C | Fwd: GCCGATCATATGTTCAGAACCTTTCCTGGCATCC Rev: GCCGATGGATCCTTATGGTGTCTCAGGTGAGTCAGG |
NdeI BamHI |
pET28 | R101-V275 |
| S12C | Fwd: GCCGATCATATGTTCAGGGAAATGCCAGG Rev: GCCGATGGATCCCTACAAGCGTTGGTTCTCTTTTGG |
NdeI BamHI |
pET21 | F99-L271 |
| S19C | Fwd: GCCGATCATATGCTTAAATACCTGTTGCTGGGC Rev: GCCGATAAGCTTCAACTCTTCTTGCCATAGAGAGC |
NdeI HindIII |
pET28 | L96-S259 |
| S19FL | Fwd: GCCGATCATATGAACTGCCAGCAGCTGTGG Rev: CCGATAAGCTTTCAGTATTCAAACGTGGTTTCTGTGG |
NdeI HindIII |
pET21 | M1-Y508 |
| S25C | Fwd: GCCGATCATATGTACGCTCTGAGCGGCAGCGTG Rev: GCCGATAAGCTTTCACCCATAGAGTTGCTGCAGGCC |
NdeI HindIII |
pET21 | Y107-G280 |
2.3. Mesenchymal stem cell isolation from adipose tissue
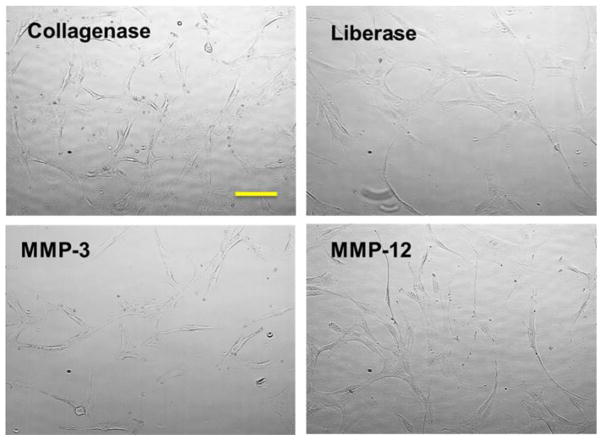
Lipoaspirates were obtained with patient consent following water jet assisted liposuction, deidentified, and processed within 24 h. Tissue was washed once (50/50) with PBS. For initial screening, 10 mL of adipose tissue was resuspended in 10 mL of TSB (3 mL of each for MMP-3 processing) and enzymes were added at appropriate concentrations. Samples were incubated for 30 min at 37 °C with intermittent shaking. The enzymatic reaction was stopped by the addition of 20 mL of low glucose DMEM media supplemented with 10% MSC-qualified FBS and the cell suspension was subjected to centrifugation. The pelleted SVF was rinsed with 10 mL of medium, passed through a 100 μm filter, and centrifuged (3000 × g, 20 min). The cell suspension was centrifuged, supernatant discarded, and cells were counted by the trypan exclusion method and seeded. After 24–48 h, cell media containing non-adherent cells was removed, remaining cells were rinsed with DPBS and fresh DMEM media was added. ADSCs were subcultured by detachment with TrypLE reagent and seeded at 3 × 10³ cells/cm2 in either DMEM or MesenPro media supplemented with Growth Supplement and P/S. Cells were grown at 37 °C, 5% carbon dioxide, and 95% air humidity with changes of media every 2–3 d until confluence was achieved (Figure 1).
Figure 1.
Morphology of ADSCs freshly isolated from the adipose tissue and grown in tissue culture dish for 2 d (passage 3). Images were captured at 10× magnification. Bar indicates 100 μm.
Subsequently, 2–10 mL of tissue was then digested with enzyme (400 ng of each MMP/mL of adipose tissue, 0.120 Wünsch units collagenase I/mL adipose tissue, or 0.45 Wünsch units Liberase™/mL adipose tissue, where 1 Wünsch unit is the liberation of 1 mol 4-phenyl-azobenzyl-oxycarbonyl-Pro-Leu from 4-phenyl-azobenzyl-oxycarbonyl-Pro-Leu-Gly-Pro-D-Arg in 1 min at 25 °C [23]) in TSB at 37 °C for 60 min with intermittent shaking. The reaction was stopped by adding an equal volume of low glucose DMEM media supplemented with 10% MSC-qualified FBS and centrifugation at 3000 × g for 20 min. The top fraction was discarded and the remaining Stromal Vascular Fraction (SVF) containing ADSCs was resuspended in 20 mL DMEM-LG/10% FBS, filtered through 100 μm nylon mesh, and centrifuged at 1200 x g for 20 min. Residual red blood cells were removed by incubation of SVF in RBC lysis buffer (8.7 g/L ammonium chloride) for 10 min at 37 °C. Cells were washed with DMEM-LG/10% FBS by centrifugation at 1200 × g for 5 min, then resuspended in DMEM-LG, 10% FBS, and 1 × penicillin/streptomycin, and plated at a density of 5 × 10³ cells/cm2 into a tissue culture dish. Culture medium was changed after 1 d of cell adhesion. The medium was changed every 3 d until 70–80% cell confluence was achieved, at which point cells were deadhered with TrypLE reagent (Life Technologies, Carlsbad, CA) and passaged into MesenPro media supplemented with Growth Supplement and P/S (Life Technologies) at 200 cells/cm2.
2.4. Evaluation of isolated ADSCs
To determine viability, cells were stained with Trypan Blue and evaluated with a Cellometer T4 Auto automatic cell counter (Nexcelom Bioscience, Lawrence, MA). Flow cytometry experiments were performed at the VGTI Flow Cytometry Core Facility (Port St. Lucie, FL) on a BD LSRII instrument. ADSCs were grown in at least 6 separate flasks to passage 5 and 3 × 10⁶ to 7 × 10⁶ cells harvested using Accutase (Innovative Cell Technologies, San Diego, CA) in order to preserve cell-surface markers. Cells were stained with BD Stemflow human MSC analysis kit (BD Biosciences, San Jose, CA) which contains fluorescently labeled antibodies to hMSC positive markers (CD44, CD73, CD90, and CD105), hMSC negative markers (CD11b, CD19, CD34, CD45, and HLA-DR), and appropriate isotype controls. ADSCs isolated by different methods and grown to passage 5 were stained with both positive, negative, and isotype antibody staining controls in the dark at 4 °C for 30 min. Isotype antibody staining controls were also utilized. For each sample, 50,000 events were acquired on a BD LSR II analyzer (BD Biosciences), and data were analyzed by Flowjo software.
For initial adipogenesis testing, ADSCs in passage 3 or 4 were seeded at a density of 4.48 × 10³ cells/well in a tissue culture treated 96-well plate in complete MesenPro medium. The next day, MesenPro medium was removed and StemPro® Adipogenesis Differentiation medium (Life Technologies) was added. After 10 d cell cultures were fixed for 5 min with 10% formalin at room temperature, washed twice with PBS, and incubated with 60% isopropanol for 5 min. Cells were washed with PBS, stained with Oil Red O solution for 5 min, and washed with deionized water until the water appeared clear of dye.
Subsequently, adipogenesis was induced in confluent cultures grown in 48-well plates using StemPro® Adipogenesis Differentiation medium. Cells were grown for 10 d with media exchange every 3 d and after day 7 observed daily for lipid droplet formation. After 10 d cells were fixed for 45 min with 4% paraformaldehyde (Sigma) at room temperature. Cells were then stained with LipidToxGreen (Life Technologies) in PBS for 30 min at room temperature to detect oil droplet formation. Nuclei were stained with Hoechst 33342 (NucBlue, Life Technologies). Cells were photographed using a phase contrast microscope.
Osteogenesis was induced in confluent cultures grown in 48-well plates using StemPro® Osteogenesis Differentiation Kit (Life Technologies) for 21 d. After 21 d cells were fixed for 30 min with 4% paraformaldehyde (Sigma) at room temperature. Alkaline phosphatase detection was carried out by staining the cells with chromogenic substrate consisting of Nitrotetrazolium Blue Chloride (NBT)/5-Bromo-4-Chloro-3-Indolyl Phosphate (BCIP) (Sigma) ((165 μg/mL BCIP)/(330 μg/mL NBT)) in 0.1 M Tris, 100 mM NaCl, 5 mM MgCl2, pH 9.5) into each well and incubating 10–30 min. Color development was stopped by rinsing each sample with distilled water. Detection of calcium salt deposition was done by treatment with 2% Alizarin Red S solution, pH 4.2 (Sigma) for 10 min. Cells were rinsed three times with distilled water and images were captured under 10× magnification.
2.5. Endotoxin testing
Endotoxin content was tested using a Limulus amebocyte lysate (LAL)-based gel clot assay (PYROGENT™, Lonza, Basel, Switzerland). The assay was based on the action between endotoxin and a clottable protein in the circulating amebocytes of Limulus polyphemus blood. To prepare negative controls, LAL reagent water was added to lysate vials, while positive controls were prepared by adding endotoxin standard provided by the kit to lysate vials. To test for endotoxin in unknown samples, a series of dilutions of the test sample was prepared (1:2 – 1:64) and added to lysate vials provided by the kit until a clot forms. The corresponding endotoxin concentration required for clot formation was an indication of the amount of endotoxin in the sample. Samples were compared with a control containing TSB.
3. Results
3.1. Initial MMP-based isolation of ADSCs
In order to establish the applicability of purified MMPs in the isolation of ADSCs, we initially selected MMP-3 and MMP-12 to be tested with adipose tissue. MMP-3 and MMP-12 are known to catabolize a variety of ECM components, including those composing adipose tissue (see Introduction) [24]. Adipose tissue from lipoaspirates was digested with collagenase I, Liberase™, MMP-3, or MMP-12. Prior to lipoaspirate processing, MMP-3 was activated with α-chymotrypsin for 30 min at 37 °C and MMP-12 was activated by incubation for 24 h at 37 °C in TSB. All treatments resulted in cells that propagated well and were phenotypically similar (Figure 1).
3.2. Flow cytometry analysis
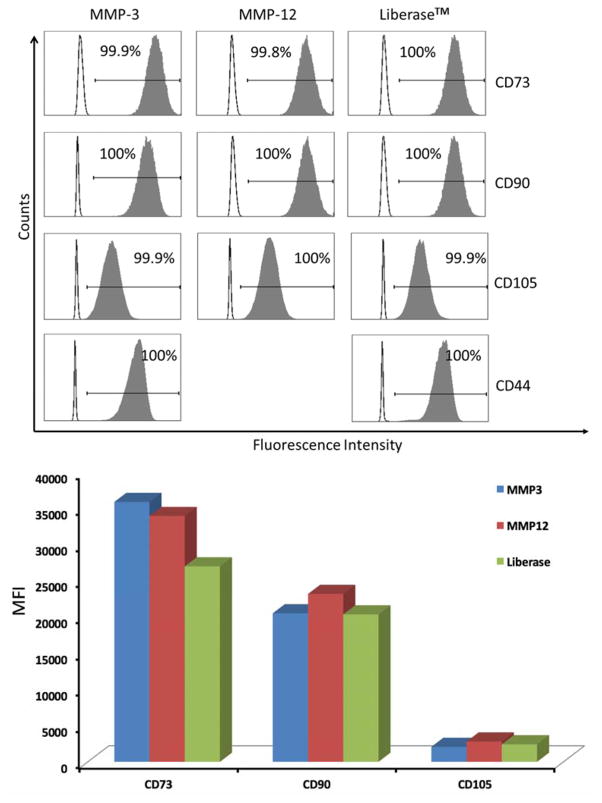
Cells isolated following MMP-3, MMP-12, or Liberase™ treatment showed very similar trends in terms of CD73, CD90, CD105, and CD44 content (Figure 2). All are positive markers for ADSCs. Due to the similar phenotype of cells isolated from collagenase I and Liberase™ treatments (Figure 1), collagenase I isolated samples were not further analyzed for ADSC markers.
Figure 2.
(Top) Analysis of ADSCs for cell surface CD73, CD90, CD105, and CD44. Clear histograms represent cells stained with isotype control antibodies, and filled histograms represent the staining with a specific marker. The percentage of positive cells is indicated in each panel. Analysis of CD44 on cells isolated following MMP-12 treatment could not be performed due to insufficient cell numbers for the positive control. (Bottom) Comparison of Median Fluorescenece Intensities (MFI) of CD73, CD90, and CD105 on isolated ADSCs.
3.3. Adipocyte differentiation and staining
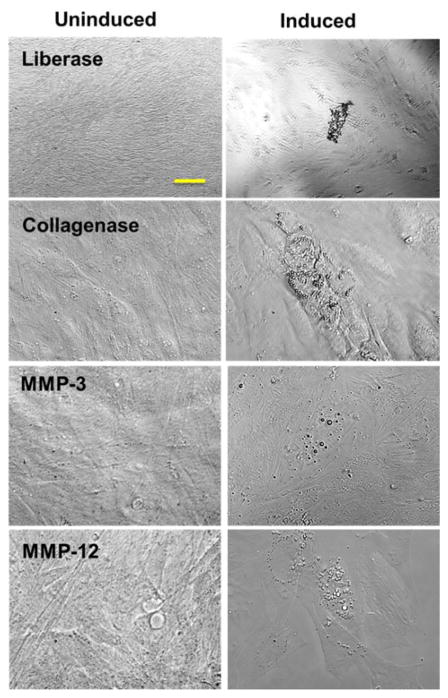
Adipogenesis was induced in confluent cultures isolated by MMP-3, MMP-12, or Liberase™ treatment using StemPro® Adipogenesis Differentiation medium and compared to uninduced cells grown in MesenPro RS medium. Adipocyte differentiation potential was detected by monitoring lipid drop formation with Oil Red O. Lipid droplet formation was observed in the induced cells (Figure 3).
Figure 3.
ADSCs were induced into adipogenesis for 10 d (Induced), while control cells (Uninduced) were maintained in MesenPro medium. Images were captured at 10× magnification. Bar indicates 100 μm.
3.4. MMP-25 characterization
Full-length MMP-25 was produced as described in Methods and materials. Isolated protein was analyzed by Western blot analysis. Purified MMP-25 showed a single band of ~60–65 kDa, corresponding the full-length proenzyme [25]. Prior reports on MMP-25 production accounted for a soluble, but not full-length, form of the enzyme [26], or just the CAT domain [27, 28]. Full-length MMP-25 has been isolated from mammalian cells following stable transfection [25], but this is not a practical approach for obtaining an MMP in sufficient quantity for cell isolation.
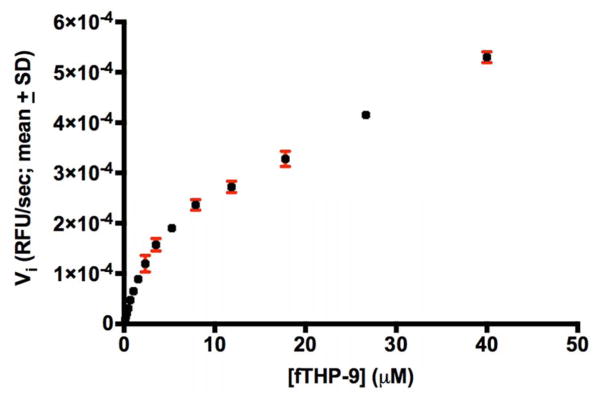
Furin activation of MMP-25 resulted in an enzyme that catalyzed the degradation of Knight SSP. The amount of active MMP-25 was determined by titration with recombinant tissue inhibitor of metalloproteinase (TIMP)-2. A fluorescence resonance energy transfer (FRET) triple-helical peptide (fTHP), fTHP-9 [21], was utilized to determine whether recombinant MMP-25 was able to hydrolyze collagen triple-helical structure, which could be a necessary attribute for dissolution of adipose tissue. MMP-25 showed significant fTHP-9 hydrolysis activity (Figure 4), with kcat/KM = 17,700 M−1sec−1, kcat = 0.251 ± 0.022 sec−1, and KM = 14.2 ± 3.2 μM. MMP-25 hydrolysis of types I and II collagen has been reported [26], although the assay conditions (incubation for 16 h at 37 °C) may have resulted in cleavage of denatured triple-helices.
Figure 4.
fTHP-9 at increasing concentrations was incubated with 2.65 nM full-length MMP-25. Relative fluorescence units (RFUs) were monitored over time using λexcitation = 324 nm and λemission = 393 nm in a 384 well plate. n = 3.
3.5. Activation of an expanded repertoire of enzymes
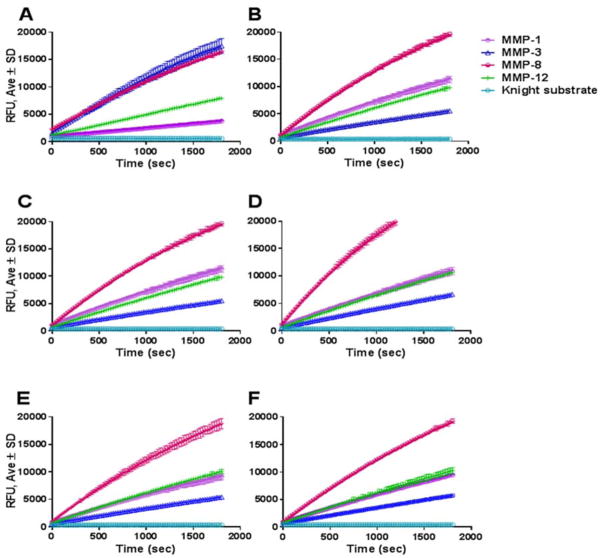
Upon successful completion of the initial testing, we expanded our MMP repertoire to include commercially available MMP-1, MMP-9, MMP-12, CAT domain and full-length MMP-3, as well as in-house recombinantly produced CAT domains of MMP-3, MMP-12, and MMP-25 and CAT domain and full-length MMP-19. Recommendations for activation of commercially available recombinant MMP-1, MMP-3, MMP-8, and MMP-12 enzymes vary widely. We set out to optimize a common activation protocol for all enzymes tested. Initially, MMP-1 and MMP-8 were activated with 1 mM APMA for 1–2 h at 37 °C; MMP-3 was activated for 30 min at 37 °C at 20 μg/mL in TSB containing 5 μg/mL chymotrypsin, after which chymotrypsin activity was neutralized with 2 mM PMSF; MMP-12 was self-activated overnight at 37 °C; and MMP-9 was purchased in an active form. Enzyme activity was tested using the Knight SSP. All enzymes displayed comparable activities towards the Knight SSP (Figure 5A). In order to optimize a single mode of MMP activation, trypsin, chymotrypsin, and a trypsin/chymotrypsin mixture activation was tested over several time points (30 min, 1.5 h, 2.5 h, 4 h, and overnight), at which time the activating enzymes were neutralized with 2 mM PMSF. Treatment of MMP-1, MMP-3, MMP-9, and MMP-12 with the mixture of 20 ng/μL trypsin/chymotrypsin for 30 min at 37 °C was sufficient to activate the enzymes comparably to manufacturer’s recommendations except for MMP-3, whose activity dropped, while MMP-1 activity increased (Figure 5B). MMP-3 presented enough activity for adequate ADSC isolation and thus we utilized the enzyme activated by the trypsin/chymotrypsin cocktail (see data below). The one-step activation of the variety of enzymes greatly simplifies the ADSC isolation protocol. Full-length MMP-25 was not further pursued because it required furin for optimum activation, and thus could not be accommodated by the one-step activation cocktail.
Figure 5.
Activation of recombinant MMPs. Panel A: Activation of enzymes according to manufacturer’s recommendations. MMP-3 was activated with 5 μg/mL chymotrypsin for 30 min at 37 °C, MMP-1 and MMP-8 were activated with APMA, and MMP-12 was self-activated in TSB overnight at 37 °C. MMP-9 was purchased in an activated form. Panel B: Activation of enzymes with optimized trypsin/chymotrypsin mixture over 30 min at 37 °C. Enzyme activity was tested with 5 μM Knight SSP over 30 min. Activation of MMPs the same day (Panel C) or frozen overnight at −20 °C (Panel D), 6 d at −80 °C (Panel E), or 16 d at −80 °C (Panel F) with optimized trypsin/chymotrypsin mixture.
Several aliquots of the activated enzymes were stored at −80 °C for future use. Activity testing at several different time points (ranging from 24 h to several months) revealed no loss of activity (Figure 5C–F). In order to guarantee viability of ADSCs, the adipose tissue needs to be processed within 24 h of harvest, thus it is very important to have processing enzymes ready at hand when the tissue arrives.
3.6. Isolation of ADSCs with MMPs
Once the enzyme stocks were activated, adipose tissue aspirates were treated for 30 min at 37 °C on a shaking platform either with collagenase I, Liberase™, commercially-purchased MMP-1, full-length MMP-3, MMP-8, MMP-9, or MMP-12, or in-house produced CAT domains of MMP-1 (S1C), MMP-3 (S3C), MMP-12 (S12C), MMP-19 (S19C), or MMP-25 (S25C), or full-length MMP-19 (S19FL). The resulting SVF ensued in variable total cell numbers ranging from 2.89 × 10⁵ cells/mL adipose tissue for the MMP-1-treated sample to 7.76 × 10⁶ cells/mL adipose tissue for the S19C-treated sample, and displayed viability between 19.6% for the S19FL-treated samples up to 74% for the collagenase I-treated samples (Table 2).
Table 2. Isolated SVC total cell number and percent viability.
Amount of cells observed is an approximate confluence observed in the 10 cm dish after 48 h growth period.
| Enzyme | Confluence of cells observed @ 48 h (%) | Cell concentration at isolation/mL adipose tissue | Viability (%) |
|---|---|---|---|
| Collagenase I | 90 | 1.36 × 10⁶ | 74.0 |
| Liberase™ | 90 | 5.18 × 10⁶ | 49.6 |
| MMP-1 | 20 | 2.89 × 10⁵ | 38.4 |
| S1C | 20 | 1.77 × 10⁶ | 53.3 |
| MMP-3 | 75 | 2.82 × 10⁵ | 40.0 |
| S3C | 75 | 2.00 × 10⁶ | 61.7 |
| MMP-8 | 35 | 1.81 × 10⁶ | 63.6 |
| MMP-9 | 50 | 3.19 × 10⁵ | 73.4 |
| M12 | 75 | 3.36 × 10⁶ | 59.5 |
| S12C | 90 | 2.62 × 10⁶ | 56.4 |
| S19Ca | 35 | 7.56 × 10⁶ | 26.3 |
| S19FLa | 50 | 5.53 × 10⁶ | 19.6 |
| S25C | 50 | 4.47 × 10⁶ | 61.6 |
Cell populations obtained from MMP-19 treatment were significantly contaminated with red blood cells.
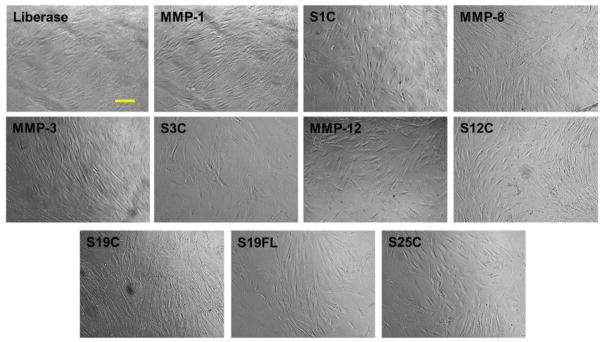
Low viability of cells may be attributed to the multiple centrifugation steps, non-specific activity of the enzymes, and/or red blood cell lysis steps. Isolated SVF was plated in 10 cm3 tissue culture dishes at a density of 5000 cells/cm2. The cells were cultured for 5–7 d to achieve 80% confluent passage 0 culture, at which time all samples displayed similar phenotype upon microscopic inspection (Figure 6).
Figure 6.
Morphology of ADSCs freshly isolated from the adipose tissue and grown in tissue culture dish for 5–7 d (passage 0). Images were captured at 10× magnification. Bar indicates 100 μm. S1C = MMP-1 CAT domain, S3C = MMP-3 CAT domain, S12C = MMP-12 CAT domain, S19C = MMP-19 CAT domain, S19FL = full-length MMP-19, and S25C = MMP-25 CAT domain. MMP-1, MMP-8, MMP-3, and MMP-12 refer to the full-length enzymes.
Interestingly, SVF isolated cell numbers and viability did not always correspond to ADSC survival and proliferation. For example, despite robust viability of the initial MMP-9-isolated SVF sample (73.4%), ADSC growth could not be promoted. This could be explained by low total cell numbers resulting from the isolation procedure (3.19 × 10⁵/mL adipose tissue). However, the MMP-1 isolated sample contained very low total cell number (2.89 × 10⁵/mL adipose tissue) as well as low viability (only 38.4%), yet the cell culture survived and could be expanded for subsequent experiments. Since the SVF is a heterogeneous mixture of cells containing not only ADSCs but also preadipocytes, fibroblasts, resident monocytes, lymphocytes, vascular smooth muscle cells, and others, the initial count and viability may have included all of the above cells with no ADSCs surviving MMP-9 isolation. Although some samples took 2 days longer than others to come to confluency due to variable cell number and viability (for example, samples isolated with MMP-1 and MMP-3 took longer to reach confluency and grew slower up to passage 5), all other processed samples resulted in ADSC culture with morphologically similar cells (Figure 6). Furthermore, after 5 passages, the cells from all samples (except for aforementioned MMP-9 isolate) retained over 90% viability, similar morphology, and proliferated at a similar rate (data not shown). No differences were observed in growth parameters such as doubling time and cell spreading among the different samples through passage 10. Due to these similar characteristics of cells isolated by collagenase I (Figure 3) and Liberase™ (Figures 3 and 6), further experiments compared MMP-isolated cells with Liberase™-isolated samples.
3.7. Immunophenotypic characterization of ADSCs
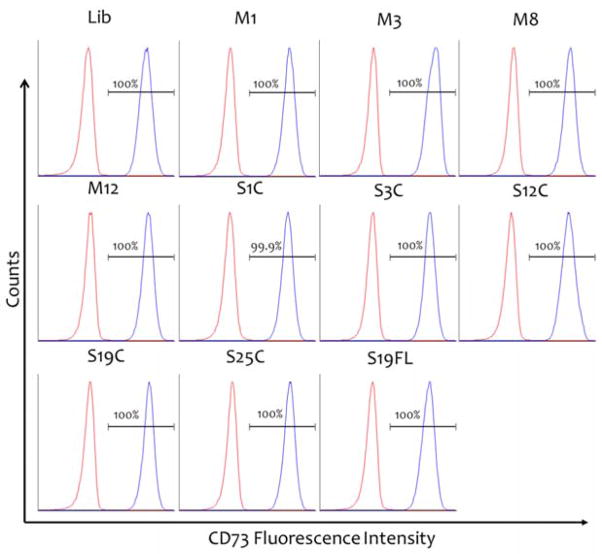
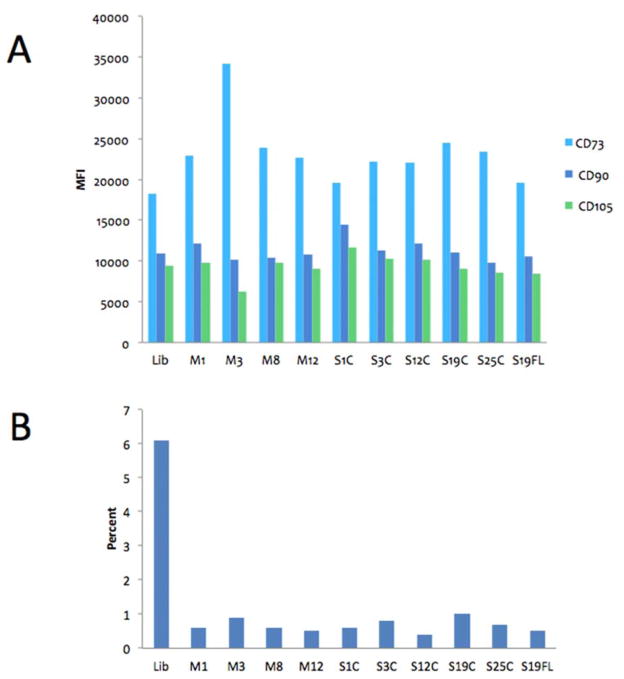
Although there is no surface marker that uniquely defines MSCs, a common surface marker profile [CD34−, CD45− (HSC markers), CD31− (endothelial cell marker), CD44+, CD90+, CD73+, and CD105+] has been frequently used to define MSCs. Flow cytometry analysis of phenotypic ADSC markers in samples isolated by Liberase™ and MMP treatment was performed at passage 5 (Figure 7). All samples were positive for MSC markers CD73, CD90, and CD105 at 99.8% or higher, except for the Liberase™-treated sample, which displayed 93.8% positive staining (Figure 8). ADSCs in these samples displayed very similar levels of marker expression as determined by median fluorescence intensity, with only the CD73 level in the MMP-3 CAT-treated sample being higher than the other samples (Figure 8A). All samples were tested for the expression of MSC negative markers (CD11b, CD19, CD34, CD45, and HLA-DR) and isotype control antibodies (Figure 8B). The presence of MSC negative markers was very low (<1% of non-MSC cells), with the exception of the Liberase™-isolated MSC sample containing 6.1% non-MSC cells (Figure 8B). This is consistent with the result for analysis of MSC positive markers for the Liberase™-isolated MSC sample (see above), and the trends indicate a higher level of purity for MMP isolation of MSCs.
Figure 7.
Immunophenotyping of ADSCs by flow cytometry. Detection of MSC surface marker CD73 expressed by ADSCs after isolation by Liberase™ (Lib), MMP-1 (M1), MMP-3 (M3), MMP-8 (M8), or MMP-12 (M12), CAT domains of MMP-1 (S1C), MMP-3 (S3C), MMP-12 (S12C), MMP-19 (S19C), or MMP-25, or full-length MMP-25 (S25C). Graphs represent positive gate populations. Red histograms represent cells stained with isotype control antibodies, and blue histograms represent the staining with specific marker antibody. The percentage of positive cells is shown in each panel. CD90 and CD105 staining displayed similar distribution (data not shown).
Figure 8.
Flow cytometry MSC-specific marker analysis of ADSCs isolated by Liberase™ and MMP treatments. Panel A: Median Fluorescence Intensity (MFI) of MSC-specific markers CD73 (light blue), CD90 (dark blue), and CD105 (green) of all cells subjected to flow cytometry. Panel B: Percentage of non-MSC marker staining (negative mix) in the same population as shown in panel A. Lib = Liberase™, M1 = MMP-1, M3 = MMP-3, M8 = MMP-8, M12 = MMP-12, S1C = MMP-1 CAT domain, S3C = MMP-3 CAT domain, S12C = MMP-12 CAT domain, S19C = MMP-19 CAT domain, S25C = MMP-25 CAT domain, and S25C = full-length MMP-25.
3.8. Adipogenesis and osteogenesis
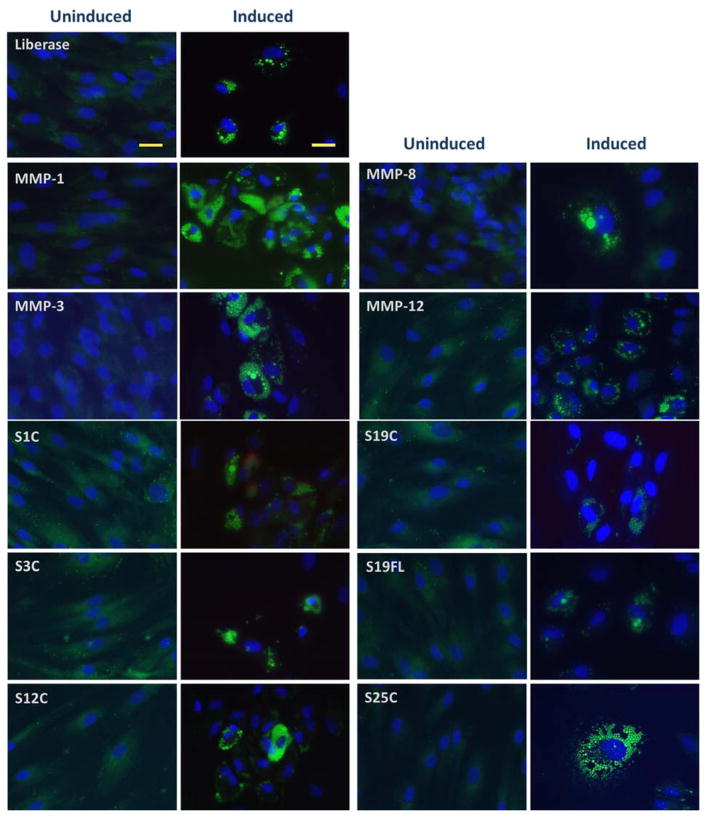
Adipogenesis was induced in confluent cultures isolated by all methods presented here using StemPro® Adipogenesis Differentiation medium and compared to uninduced cells grown in MesenPro RS medium. Adipocyte differentiation potential was detected by monitoring lipid drop formation with LipidToxGreen, a fluorescent stain with an extremely high affinity for neutral lipid droplets. Adipogenesis was observed in all induced groups as indicated by intense fluorescence of accumulated lipid droplets within the cell cytoplasm, while uninduced cells in all samples displayed negligible fluorescence (Figure 9). The most efficient adipogenesis occurred in the MMP-1-isolated sample, while the Liberase™-, MMP-12 CAT-, and MMP-3-isolated samples exhibited comparable, high levels of differentiation (Figure 9). All other samples exhibited lower levels of differentiation. Fibroblasts were treated in similar fashion, and neither induced nor uninduced fibroblasts displayed any indication of adipogenesis (data not shown). While adipogenesis was evoked in all isolated ADSC populations, the amount of lipid droplets formed within cells varied between samples. This difference could be due to downstream effects of the proteases used during ADSC isolation from adipose tissue, the difference in gene expression among samples, the expansion capacity of each culture (as mentioned above, some samples took longer to reach initial confluency), and/or and the differentiation capacity of captured adipogenetic precursors.
Figure 9.
ADSCs were induced into adipogenesis for 10 d (Induced), while control cells (Uninduced) were maintained in MesenPro medium. Lipid droplets were stained with LipidTox (green fluorescence) and nuclei were stained with Hoechst 33342 solution (blue). Images were captured at 10× magnification. Bars indicate 100 μm. S1C = MMP-1 CAT domain, S3C = MMP-3 CAT domain, S12C = MMP-12 CAT domain, S19C = MMP-19 CAT domain, S19FL = full-length MMP-19, and S25C = MMP-25 CAT domain. MMP-1, MMP-8, MMP-3, and MMP-12 refer to the full-length enzymes.
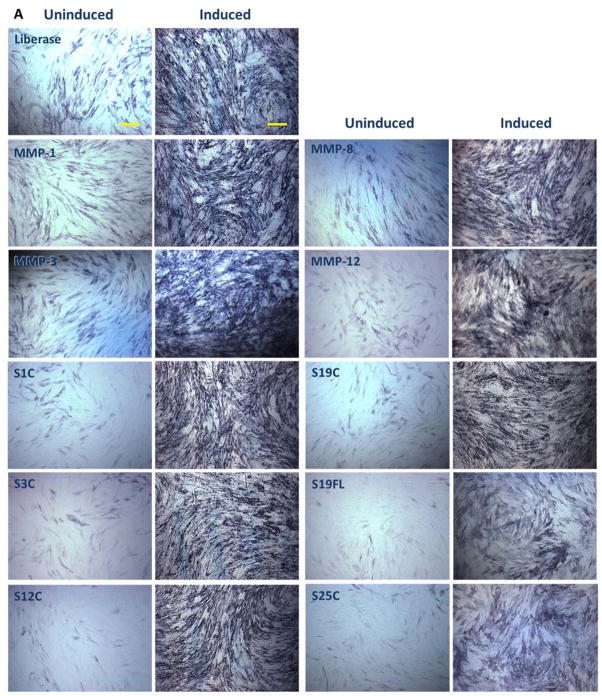
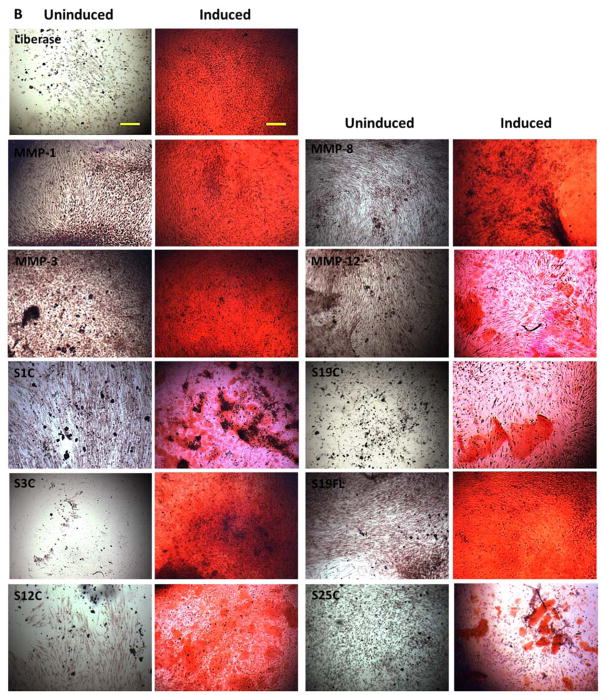
In order to determine osteogenetic potential of isolated ADSCs, confluent cultures were grown in StemPro® Osteogenesis Differentiation Kit for 21 d, and compared to uninduced cells grown in MesenPro RS medium. ADSCs isolated by all methods showed direct evidence of intracellular osteogenic differentiation and extracellular mineral deposition, as detected by chromogenic alkaline phosphatase and Alizarin Red S staining (Figure 10). Osteogenically induced ADSCs stained intensely for alkaline phosphatase and Alizarin Red S. All induced groups displayed osteogenic differentiation, while cells grown in uninducing media displayed weak staining. Fibroblasts were treated in similar fashion, and neither induced nor uninduced fibroblasts displayed any indication of osteogenesis (data not shown).
Figure 10.
Osteogenic differentiation of ADSCs. Cells were cultured in osteogenic induction medium (right panels) or in uninducing MesenPro medium (left panels) for 21 d. Images were captured at 10× magnification. Bars indicate 100 μm. Panel A: Alkaline phosphatase activity, which is indicative of osteoblastic differentiation, is shown as dark blue stain. Panel B: Mineralization of samples was detected by alizarin red S stain. Alizarin Red staining was used to detect precipitated calcium salt, which is a marker of differentiation. S1C = MMP-1 CAT domain, S3C = MMP-3 CAT domain, S12C = MMP-12 CAT domain, S19C = MMP-19 CAT domain, S19FL = full-length MMP-19, and S25C = MMP-25 CAT domain. MMP-1, MMP-8, MMP-3, and MMP-12 refer to the full-length enzymes.
3.9. Endotoxin testing
The maximum level of endotoxin that is considered safe for intravenous application is 5 endotoxin unit (EU)/kg/h. For a 20 g mouse, this can be calculated to be the equivalent of no more than 0.1 EU administered over a 1 h period [29]. At an MMP-12 CAT concentration of 0.3 mg/mL, the endotoxin concentration was <0.05 EU/mL. This was comparable to Liberase™ and the TSB control.
4. Discussion
The present study has examined the isolation of ADSCs with several different MMPs and compared the morphology, phenotype, and differentiation potential of ADSCs isolated with commonly used Liberase™. ADSCs were isolated and propagated by processing adipose tissue with MMP-1, MMP-3, MMP-8, or MMP-12, as well as in-house produced CAT domains of MMP-1 (S1C), MMP-3 (S3C), MMP-12 (S12C), MMP-25 (S25C), or MMP-19 (S19C), or full-length MMP-19 (S19FL). ADSCs were characterized by a combination of criteria, including analysis of both positive and negative cell surface markers and differentiation into distinct cell lineages. Fibroblasts were used for control comparisons.
The majority of MMP treatments resulted in efficient isolation of ADSCs. The best combination of cell confluence, cell concentration, and cell viability was observed following MMP-12 CAT treatment (Table 2). Robust ADSC numbers of MMP-12 and S12C-isolated samples may have resulted because of the ability of the enzyme to hydrolyze a variety of ECM biomolecules [24], several of which contribute to retention of the MSCs in the adipose tissue. Interestingly, the MMP-12 CAT-isolated sample displayed excellent survival and propagation over the initial 48 h culture period, at which time the culture displayed approximately 90% confluence, while the MMP-12 isolated sample displayed approximately 75% confluence. This observation indicates that the MMP-12 hemopexin domain may not be necessary for the processing of the ECM molecules required for release of ADSCs from the adipose tissue. In addition, the presence of the MMP-12 hemopexin domain may aid in processing of some cell surface molecules necessary for cell adhesion and propagation, thus reducing ADSC propagation.
MMP-9 treatment of the adipose tissue did not yield any surviving ADSCs, while MMP-1 isolation resulted in low total cell number and low initial cell viability. This could be explained by non-specific processing of ADSC cell-surface molecules required for adhesion and/or survival, or non-optimal isolation conditions (i.e., the enzyme may need a different buffer composition or incubation time in order to sufficiently digest the ECM network).
The morphological characteristics or ADSCs are fibroblast-like shape in culture, multipotent differentiation, extensive proliferation capacity, and a common surface marker profile [CD34−, CD45−, CD31−, CD44+, CD90+, CD73, and CD105+]. The ADSCs isolated by MMPs displayed essentially identical morphological and phenotypical characteristics to cells isolated by bacterially-derived collagenase I and Liberase™. Samples isolated with MMPs and Liberase™ had comparable levels of CD73, CD90, and CD105. The adipogenic and osteogenic potential of the ADSCs isolated by MMPs was retained as compared to cells isolated with Liberase™. However, and most significantly, ADSCs isolated by Liberase™ displayed 6% contamination with other cells as per negative markers revealed by PE staining, as opposed to <1% for all MMP-treated samples.
There are two primary concerns over the use of Liberase™ for cell isolation: the instability of collagenase I and endotoxin contamination (see Introduction). MMP-12 CAT is a single domain protease, while collagenase I is multidomain [30], and thus MMP-12 CAT is less susceptible to autoproteolysis. MMP-12 exhibited excellent stability over 16 d storage (Figure 5E). Comparable endotoxin contents were measured for Liberase™ and MMP-12 CAT, where both values were well below the accepted limit. Because MMP-12 is produced recombinantly, the protease could eventually be expressed in ClearColi™ to completely eliminate endotoxin [31]. ClearColi™ does not contain the lipopolysaccharide endotoxin [32].
5. Conclusions
The application of recombinant MMPs to isolate ADSCs described here is very significant, because without the highest quality of connective tissue degrading enzymes it is virtually impossible to liberate viable ADSCs without toxic byproducts. The purified recombinant MMPs may have applications in tissue dissociation practice, leading to the replacement of current collagenases of microbial origin and becoming a new standard. Ultimately, MMP-based stem cell isolation may contribute to optimization of transplantation technology. Future studies will consider creation of recombinant MMP cocktails that will be applied to isolation of other cells, such as islets, where the current standard still relies on bacterial collagenases.
HIGHLIGHTS.
Recombinant MMPs were compared to bacterial collagenase for mesenchymal stem cell isolation.
MMP-12 isolated cells as efficiently as bacterial collagenase with a purer population of cells.
A single activation cocktail can be used for MMPs prior to stem cell isolation.
Acknowledgments
We thank Dr. Rafi Fridman for providing the human MMP-25 cDNA. Research reported in this publication was supported by the National Institutes of Health under Award Numbers CA098799 (to GBF) and GM106469 (to CZ).
Footnotes
Competing interests
Akron Biotech sells stem cells and stem cell related products. CZ is the CEO and SM is an employee of Akron Biotech, while GBF is a member of the Akron Biotech Scientific Advisory Board. AK, SA, and ZH have no conflicts of interest.
Author’s contributions
AK carried out cell isolation, cell differentiation, and enzyme activation experiments. SM and SA performed endotoxin analyses. ZH oversaw flow cytometry experiments and analyses. CZ and GBF organized the research project and prepared the manuscript. All authors read and approved the final manuscript.
The content is solely the responsibility of the authors and does not necessarily represent the official views of the National Institutes of Health.
Publisher's Disclaimer: This is a PDF file of an unedited manuscript that has been accepted for publication. As a service to our customers we are providing this early version of the manuscript. The manuscript will undergo copyediting, typesetting, and review of the resulting proof before it is published in its final citable form. Please note that during the production process errors may be discovered which could affect the content, and all legal disclaimers that apply to the journal pertain.
References
- 1.Craik CS, Page MJ, Madison EL. Proteases as therapeutics. Biochem J. 2011;435:1–16. doi: 10.1042/BJ20100965. [DOI] [PMC free article] [PubMed] [Google Scholar]
- 2.Choi KY, Swierczewska M, Lee S, Chen X. Protease-Activated Drug Development. Theranostics. 2012;2:156–78. doi: 10.7150/thno.4068. [DOI] [PMC free article] [PubMed] [Google Scholar]
- 3.Hurst LC, Badalamente MA, Hentz VR, Hotchkiss RN, Kaplan FT, Meals RA, et al. Injectable collagenase Clostridium histolyticum for Dupuytren’s contracture. N Engl J Med. 2009;362:968–79. doi: 10.1056/NEJMoa0810866. [DOI] [PubMed] [Google Scholar]
- 4.Honig SC. Intralesional collagenase in the treatment of Peyronie’s disease. Ther Adv Urol. 2014;6:47–53. doi: 10.1177/1756287213509849. [DOI] [PMC free article] [PubMed] [Google Scholar]
- 5.Overall CM. Molecular determinants of metalloproteinase substrate specificity. Mol Biotech. 2002;22:51–86. doi: 10.1385/MB:22:1:051. [DOI] [PubMed] [Google Scholar]
- 6.Egeblad M, Werb Z. New functions for the matrix metalloproteinases in cancer progression. Nat Rev Cancer. 2002;2:161–74. doi: 10.1038/nrc745. [DOI] [PubMed] [Google Scholar]
- 7.Fingleton B. Matrix metalloproteinases as valid clinical targets. Curr Pharm Design. 2007;13:333–46. doi: 10.2174/138161207779313551. [DOI] [PubMed] [Google Scholar]
- 8.Vandenbroucke RC, Libert C. Is there new hope for therapeutic matrix metalloproteinase inhibition? Nat Rev Drug Discov. 2014;13:904–27. doi: 10.1038/nrd4390. [DOI] [PubMed] [Google Scholar]
- 9.Nakajima I, Yamaguchi T, Ozutsumi K, Aso H. Adipose tissue extracellular matrix: New organized by adipocytes during differentiation. Differentiation. 1998;63:193–200. doi: 10.1111/j.1432-0436.1998.00193.x. [DOI] [PubMed] [Google Scholar]
- 10.Mariman ECM, Wang P. Adipocyte extracellular matrix composition, dynamics and role in obesity. Cell Mol Life Sci. 2010;67:1277–92. doi: 10.1007/s00018-010-0263-4. [DOI] [PMC free article] [PubMed] [Google Scholar]
- 11.Choi JS, Kim BS, Kim JY, Kim JD, Choi YC, Yang HJ, et al. Decellularized extracellular matrix derived from human adipose tissue as a potential scaffold for allograft tissue engineering. J Biomed Mater Res A. 2011;97:292–9. doi: 10.1002/jbm.a.33056. [DOI] [PubMed] [Google Scholar]
- 12.Divoux A, Clément K. Architecture and the extracellular matrix: The still unappreciated components of adipose tissue. Obesity Rev. 2011;12:e494–e503. doi: 10.1111/j.1467-789X.2010.00811.x. [DOI] [PubMed] [Google Scholar]
- 13.Priya N, Sarcar S, Majumdar AS, Sundarraj S. Explant culture: a simple, reproducible, efficient and economic technique for isolation of mesenchymal stromal cells from human adipose tissue and lipoaspirate. J Tissue Eng Regen Med. 2014;8:706–16. doi: 10.1002/term.1569. [DOI] [PubMed] [Google Scholar]
- 14.Brandhorst H, Raimsch-Guenther N, Raemsch C, Friedrich O, Kurfuerst M, Korsgren O, et al. Degraded collagenase deteriorates islet viability. Transplantation Proc. 2008;40:370–1. doi: 10.1016/j.transproceed.2008.01.013. [DOI] [PubMed] [Google Scholar]
- 15.Vargas F, Vives-Pi M, Somoza N, Fernández-Llamazares J, Pujol-Borrell R. Endotoxin activity of collagenase and human islet transplantation. Lancet. 1997;350:641. doi: 10.1016/s0140-6736(05)63331-4. [DOI] [PubMed] [Google Scholar]
- 16.Jahr H, Pfeiffer G, Hering BJ, Federlin K, Bretzel RG. Endotoxin-mediated activation of cytokine production in human PBMCs by collagenase and Ficoll. J Mol Med (Berl) 1999;77:118–20. doi: 10.1007/s001090050316. [DOI] [PubMed] [Google Scholar]
- 17.Linetsky E, Inverardi L, Kenyon NS, Alejandro R, Ricordi C. Endotoxin contamination of reagents used during isolation and purification of human pancreatic islets. Transplantation Proc. 1998;30:345–6. doi: 10.1016/s0041-1345(97)01297-9. [DOI] [PubMed] [Google Scholar]
- 18.Salamone M, Seidita G, Cuttitta A, Rigogliuso S, Mazzola S, Bertuzzi F, et al. A new method to value efficiency of enzyme blends for pancreatic tissue digestion. Transplantation Proc. 2010;42:2043–8. doi: 10.1016/j.transproceed.2010.05.107. [DOI] [PubMed] [Google Scholar]
- 19.Nagase H, Fields CG, Fields GB. Design and characterization of a fluorogenic substrate selectively hydrolyzed by stromelysin 1 (matrix metalloproteinase-3) J Biol Chem. 1994;269:20952–7. [PubMed] [Google Scholar]
- 20.Neumann U, Kubota H, Frei K, Ganu V, Leppert D. Characterization of Mca-Lys-Pro-Leu-Gly-Leu-Dpa-Ala-Arg-NH2, a fluorogenic substrate with increased specificity constants for collagenases and tumor necrosis factor converting enzyme. Anal Biochem. 2004;328:166–73. doi: 10.1016/j.ab.2003.12.035. [DOI] [PubMed] [Google Scholar]
- 21.Minond D, Lauer-Fields JL, Cudic M, Overall CM, Pei D, Brew K, et al. The roles of substrate thermal stability and P2 and P1’ subsite identity on matrix metalloproteinase triple-helical peptidase activity and collagen specificity. J Biol Chem. 2006;281:38302–13. doi: 10.1074/jbc.M606004200. [DOI] [PubMed] [Google Scholar]
- 22.Sun Q, Weber CR, Sohail A, Bernardo MM, Toth M, Zhao H, et al. MMP25 (MT6-MMP) Is Highly Expressed in Human Colon Cancer, Promotes Tumor Growth, and Exhibits Unique Biochemical Properties. J Biol Chem. 2007;282:21998–2010. doi: 10.1074/jbc.M701737200. [DOI] [PMC free article] [PubMed] [Google Scholar]
- 23.Wünsch E, Heidrich H. On the quantitative determination of collagenase. Z Physiol Chem. 1963;333:149–59. doi: 10.1515/bchm2.1963.333.1.149. [DOI] [PubMed] [Google Scholar]
- 24.Woessner JF, Nagase H. Matrix Metalloproteinases and TIMPs. Oxford: Oxford University Press; 2000. [Google Scholar]
- 25.Radichev IA, Remacle AG, Shiryaev SA, Purves AN, Johnson SL, Pellecchia M, et al. Biochemical characterization of the cellular glycosylphosphatidylinositol-linked membrane type-6 matrix metalloproteinase. J Biol Chem. 2010;285:16076–86. doi: 10.1074/jbc.M110.107094. [DOI] [PMC free article] [PubMed] [Google Scholar]
- 26.Starr AE, Bellac CL, Dufour A, Goebeler V, Overall CM. Biochemical characterization and N-terminomics analysis of leukolysin, the membrane-type 6 matrix metalloprotease (MMP25) J Biol Chem. 2012;287:13382–95. doi: 10.1074/jbc.M111.314179. [DOI] [PMC free article] [PubMed] [Google Scholar]
- 27.English WR, Velasco G, Stracke JO, Knauper V, Murphy G. Catalytic activities of membrane-type 6 matrix metalloproteinase (MMP25) FEBS Lett. 2001;491:137–42. doi: 10.1016/s0014-5793(01)02150-0. [DOI] [PubMed] [Google Scholar]
- 28.Kang T, Yi J, Guo A, Wang X, Overall CM, Jiang W, et al. Subcellular distribution and cytokine- and chemokine-regulated secretion of leukolysin/MT6-MMP/MMP-25 in neutrophils. J Biol Chem. 2001;276:21960–8. doi: 10.1074/jbc.M007997200. [DOI] [PubMed] [Google Scholar]
- 29.Magalhães PO, Lopes AM, Mazzola PG, Rangel-Yagui C, Penna TCV, Pessoa JA. Methods of endotoxin removal from biological preparations: A review. J Pharm Pharm Sci. 2007;10:388–404. [PubMed] [Google Scholar]
- 30.Zhang YZ, Ran LY, Li CY, Chen XL. Diversity, Structures, and Collagen-Degrading Mechanisms of Bacterial Collagenolytic Proteases. Appl Environ Microbiol. 2015;81:6098–107. doi: 10.1128/AEM.00883-15. [DOI] [PMC free article] [PubMed] [Google Scholar]
- 31.Steinmetz E. Low endotoxin plasmid production from E. coli. Gen Eng Biotechnol News. 2014 Feb 15;:16–7. [Google Scholar]
- 32.DePalma A. Advances in protein expression. Gen Eng Biotechnol News. 2014 Jan 1;:24–7. [Google Scholar]


