

Abstract
Although seen frequently during dissections and autopsies, Hyperostosis frontalis interna (HFI) – a morphological pattern of the frontal bone thickening – is often ignored and its nature and development are not yet understood sufficiently. Current macroscopic classification defines four grades/stages of HFI based on the morphological appearance and size of the affected area; however, it is unclear if these stages also depict the successive phases in the HFI development. Here we assessed 3D‐microarchitecture of the frontal bone in women with various degrees of HFI expression and in an age‐ and sex‐matched control group, hypothesizing that the bone microarchitecture bears imprints of the pathogenesis of HFI and may clarify the phases of its development. Frontal bone samples were collected during routine autopsies from 20 women with HFI (age: 69.9 ± 11.1 years) and 14 women without HFI (age: 74.1 ± 9.7 years). We classified the HFI samples into four groups, each group demonstrating different macroscopic type or stage of HFI. All samples were scanned by micro‐computed tomography to evaluate 3D bone microarchitecture in the following regions of interest: total sample, outer table, diploe and inner table. Our results revealed that, compared to the control group, the women with HFI showed a significantly increased bone volume fraction in the region of diploe, along with significantly thicker and more plate‐like shaped trabeculae and reduced trabecular separation and connectivity density. Moreover, the inner table of the frontal bone in women with HFI displayed significantly increased total porosity and mean pore diameter compared to controls. Microstructural reorganization of the frontal bone in women with HFI was also reflected in significantly higher porosity and lower bone volume fraction in the inner vs. outer table due to an increased number of pores larger than 100 μm. The individual comparisons between the control group and different macroscopic stages of HFI revealed significant differences only between the control group and the morphologically most pronounced type of HFI. Our microarchitectural findings demonstrated clear differences between the HFI and the control group in the region of diploe and the inner table. Macroscopic grades of HFI could not be distinguished at the level of bone microarchitecture and their consecutive nature cannot be supported. Rather, our study suggests that only two different types of HFI (moderate and severe HFI) have microstructural justification and should be considered further. It is essential to record HFI systematically in human postmortem subjects to provide more data on the mechanisms of its development.
Keywords: frontal bone, hyperostosis, micro‐architecture, women
Introduction
Hyperostosis frontalis interna (HFI) is the morphological pattern of frontal bone thickening (Hershkovitz et al. 1999). This condition was first reported by Morgagni in 1769, as a ‘specific variety of bone accretion localized on the inner table of the frontal bone’ (Moore, 1955). Even though HFI was identified almost 300 years ago, this common condition has rarely been investigated in the medical literature.
Hyperostosis frontalis interna shows age and sex dependence: the prevalence is significantly higher in females than males, and both the prevalence and severity of HFI increase with aging, reaching a peak in postmenopausal women (40–60%) (Hershkovitz et al. 1999; Nikolic et al. 2010). Although HFI is frequently seen at autopsies and during routine radiological practice, it usually remains unrecorded. The presence of HFI has a clinical relevance. Initially, HFI was considered one of the entities within various clinical syndromes that affect multiple organ systems, such as the syndromes of Morgagni–Stewart–Morel–Moore (obesity, virilism, neuropsychiatric symptoms, headaches), Troell–Junet (acromegaly, toxic goiter, diabetes mellitus), Frolich (obesity, growth retardation, pituitary hypocrinism) and Klippel–Trenaunay–Weber (varicose veins, port‐wine stain, bone and soft tissue hypertrophy) (Raikos et al. 2011). Recent research has suggested that various symptoms may occur as a consequence of HFI, independent of these syndromes (Attanasio et al. 2013; Djonic et al. 2016). Specifically, intrusive bone growth in patients with HFI may reduce intracranial volume or compress the cerebral cortex, resulting in various neurological symptoms (May et al. 2012). HFI is associated with cognitive slowing, mood disturbance, epilepsy, dementia, schizoaffective disorders, headache and intracranial hypertension (Hershkovitz et al. 1999; Devriendt et al. 2005; Djonic et al. 2016). In addition there are studies that correlate HFI with Alzheimer's and Parkinson's diseases (May et al. 2012; Cetiner Batun et al. 2015).
Previous research into bone microarchitecture in patients with HFI showed that frontal bone thickening occurs as a result of expansion of the internal part of diploe, while the external part remains unaffected (Ruhli et al. 2007). In patients with HFI, apart from frontal bone thickening, there is a trend of increased bone thickness in other cranial bones as well (Nikolic et al. 2010; Djonic et al. 2016). Still, HFI was shown to be a local phenomenon which affects only the skull, other parts of the skeleton remaining unaffected (Djonic et al. 2016). HFI shows variable morphological characteristics and degree of frontal bone involvement among different individuals, reflected in the current macroscopic classification of HFI describing four types or stages of HFI (Hershkovitz et al. 1999).
Although the etiology of HFI is still unclear, its higher prevalence and severity in females has led to the suggestion that prolonged and/or increased estrogen stimulation during the reproductive period is the most probable cause of HFI (Hershkovitz et al. 1999). Some authors have reported a rapid increase in the frequency of HFI in the modern era (Hershkovitz et al. 1999; Raikos et al. 2011). Historically, women spent most of their reproductive life either pregnant or nursing, which resulted in lower estrogen exposures, whereas nowadays low parity and breastfeeding, as well as consumption of dietary phytoestrogens from sources such as soy, grains and linseed, result in increased estrogen stimulation (May et al. 2011; Raikos et al. 2011).
Over the years, several possible models of the HFI pathogenesis have been put forward. The most recent is the ‘global model’ proposed by Hershkovitz et al. (1999), who speculated that osteogenic cells cause diploization of the inner table and the formation of new lamellar bone. Blood vessels from the dura penetrate the lamellar bone, which is followed by bone proliferation, and finally the inner plate reorganizes and expands towards both the diploic space and cranial cavity. According to this theory, neovascularization originating from the dura might be one of the key processes in HFI development.
However, previous studies focusing on HFI provided limited insights into the pathogenesis of this phenomenon. Moreover, it remains unclear whether different macroscopic stages of HFI can be regarded as successive phases in the process of HFI development. Therefore in this study we assessed microarchitecture of the frontal bone in women with various levels of HFI expression and in an age‐ and sex‐matched control group, hypothesizing that bone microarchitecture bears imprints of the pathogenesis of HFI and may clarify the phases of its development.
Material and method
Frontal bone samples were collected during routine autopsies from human donor cadavers at the Institute of Forensic Medicine, School of Medicine, University of Belgrade. Exclusion criteria encompassed the presence of bone‐related pathological conditions other than HFI in the HFI group, as well as a history of brain tumor, meningioma, renal disease, primary hyperparathyroidism and Paget's disease. Ethical approval for collection of the sample was granted by the Ethics Committee of the School of Medicine, University of Belgrade.
The study sample comprised a group of women with HFI (n = 20, mean age: 69.9 ± 11.1) and an age‐matched control group of women (n = 14; mean age 74.1 ± 9.7). We used macroscopic classification of HFI proposed by Hershkovitz et al. (1999), which is based on morphological characteristics and extension of frontal bone involvement and includes four types: type A – isolated elevated bony islands, generally under 10 mm in size, type B – nodular bony overgrowths, identified on less than 25% of the frontal bone surface, type C – thickening of up to 50% the frontal endocranial surface, and type D – bony overgrowth, involving more than 50% of the frontal endocranial surface (Hershkovitz et al. 1999). In this context, we subdivided the women with HFI in four groups, each group demonstrating a different macroscopic type of HFI (Table 2).
Frontal bone samples of approximately 1 × 1 cm were harvested using a slow rotating medical saw from the part where the frontal bone was the thickest (Fig. 1). They were stored in 70% ethanol and cleaned of adherent soft tissue. Each frontal bone specimen was placed in a sample holder with a consistent orientation and scanned in dry conditions by micro‐computed tomography (micro‐CT; Skyscan 1172, Bruker, Belgium). The micro‐CT was operated at 80 kV, 124 μA and 1200 μs exposure time, with an isotropic resolution of 10 μm and applied Al+Cu filter. The following regions of interest were determined for each investigated sample: total sample, outer table, diploe and inner table (Fig. 1). The micro‐architecture of the cortical and trabecular bone was evaluated automatically using micro‐CT evaluation program ct. An ‐ ver. 1.14 (Skyscan, Belgium), with direct 3D morphometry. The threshold was set at 110/255. Investigated microstructural parameters for each region of interest were: total sample [bone volume fraction (BV/TV, %), outer table (bone volume fraction (BV/TV, %), pore diameter (Po.Dm, mm), total porosity (Po.Tot, %) and fractal dimension (FD)], diploe [bone volume fraction (BV/TV, %), trabecular number (Tb.N, mm−1), trabecular thickness (Tb.Th, mm), trabecular separation (Tb.Sp, mm), structure model index (SMI), connectivity density (Conn.D, mm−3), degree of anisotropy (DA), total porosity (Po.Tot, %) and fractal dimension (FD)] and inner table [bone volume fraction (BV/TV, %), pore diameter (Po.Dm, mm), total porosity (Po.Tot, %) and fractal dimension (FD)]. The Kolmogorov–Smirnov test was used to verify the normality of the data distribution. Independent samples t‐test was used to detect the differences in microstructural parameters between the group of women with HFI and control group. Paired samples t‐test was used to evaluate the differences in microstructural parameters between the inner table and outer table in the group with HFI, as well as in control group. One‐way analysis of variance (anova) was used to assess the differences in microstructural parameters between the control group and different types of HFI, followed by post‐hoc multiple‐comparison procedures with Bonferroni correction. All analyses were conducted using spss statistical software (version 15.0) and the results were considered statistically significant at the 0.05 level.
Figure 1.

(Left panel) A macroscopic view on the internal surface of the frontal bone in a woman with HFI (black rectangle shows the location of the analyzed frontal bone sample). (Right panel) A 3D micro‐computed tomography reconstruction in a woman with HFI, showing the segmentation of the frontal bone samples to the regions of outer table, diploe and inner table.
Results
Bone volume fraction in women with HFI significantly increased in the region of diploe when compared with the control group (Table 1). However, no significant inter‐group differences in bone volume fraction were detected either in the whole analyzed volume or in the regions of the outer and inner tables. Increased BV/TV in the region of diploe in women with HFI was accompanied by significantly thicker and more plate‐like shaped trabeculae, along with reduced trabecular separation and connectivity density (Fig. 2). Conversely, in the region of the inner table HFI was associated with a significant increase in total porosity and mean pore diameter (Table 1 Fig. 2).
Table 1.
Differences of microstructural parameters between control group and women with HFI for different regions of the frontal bone
| Microstructural parameters | Control group (N = 14) | HFI (N = 20) |
|---|---|---|
| Total sample | ||
| BV/TV | 62.33 ± 11.63 | 69.53 ± 10.68 |
| Outer table | ||
| BV/TV | 95.06 ± 1.55 | 95.06 ± 2.38 |
| Po.Dm | 0.08 ± 0.01 | 0.08 ± 0.03 |
| FD | 2.38 ± 0.05 | 2.40 ± 0.06 |
| Po.Tot | 4.94 ± 1.55 | 4.94 ± 2.38 |
| Diploe | ||
| BV/TVa | 46.07 ± 11.19 | 56.12 ± 13.03 |
| SMIa | −1.02 ± 1.75 | −2.74 ± 2.57 |
| Tb.Tha | 0.23 ± 0.03 | 0.27 ± 0.06 |
| Tb.N | 1.96 ± 0.33 | 2.09 ± 0.40 |
| Tb.Spa | 0.52 ± 0.14 | 0.44 ± 0.11 |
| DA | 1.95 ± 0.54 | 2.09 ± 0.69 |
| FD | 2.60 ± 0.06 | 2.60 ± 0.05 |
| Po.Tot | 50.36 ± 16.99 | 43.87 ± 13.03 |
| Conn.Da | 39.96 ± 17.74 | 27.28 ± 14.51 |
| Inner table | ||
| BV/TV | 93.32 ± 4.09 | 89.67 ± 6.47 |
| Po.Dma | 0.08 ± 0.03 | 0.11 ± 0.03 |
| FD | 2.31 ± 0.09 | 2.37 ± 0.10 |
| Po.Tota | 5.46 ± 3.09 | 10.27 ± 6.49 |
BV/TV, bone volume fraction (%); Po.Dm, pore diameter (mm); FD, fractal dimension; Po.Tot, total porosity (%); Tb.N, trabecular number (mm−1); Tb.Th, trabecular thickness (mm); Tb.Sp, trabecular separation (mm); SMI, structure model index; Conn.D, connectivity density (mm−3); DA, degree of anisotropy.
Significant difference between the groups; t‐test, P < 0.05.
Figure 2.

Representative 3D micro‐computed tomography reconstructions of the frontal bone in women with HFI and control group. Note between‐group differences in the regions of diploe and inner table.
When analyzing the differences between the control group and the types A, B, C and D of HFI, significant differences were detected only in the region of diploe (Table 2 Fig. 3). Overall, bone volume fraction in the diploic region differed significantly between the investigated groups, but the post‐hoc multiple comparison procedures revealed no significant differences in mean values between the individual groups. Structure model index and trabecular thickness in the region of diploe differed significantly between the groups, with post‐hoc tests revealing significant inter‐group difference between the control group and the type D of HFI (Table 2).
Table 2.
Differences of microstructural parameters between control group and types A, B, C and D of HFI for different regions of the frontal bone
| Microstructural parameters | Control group (n = 14) | HFI type A (n = 4) | HFI type B (n = 4) | HFI type C (n = 4) | HFI type D (n = 8) |
|---|---|---|---|---|---|
| Total sample | |||||
| BV/TV | 62.33 ± 11.63 | 78.11 ± 6.11 | 65.18 ± 6.52 | 68.58 ± 7.29 | 67.90 ± 14.01 |
| Outer table | |||||
| BV/TV | 95.06 ± 1.55 | 95.72 ± 1.14 | 93.79 ± 1.93 | 96.38 ± 1.00 | 94.71 ± 3.24 |
| Po.Dm | 0.08 ± 0.01 | 0.08 ± 0.02 | 0.10 ± 0.01 | 0.08 ± 0.01 | 0.08 ± 0.04 |
| FD | 2.38 ± 0.05 | 2.42 ± 0.04 | 2.43 ± 0.04 | 2.40 ± 0.05 | 2.39 ± 0.08 |
| Po.Tot | 4.94 ± 1.55 | 4.28 ± 1.14 | 6.21 ± 1.93 | 3.61 ± 1.00 | 5.29 ± 3.24 |
| Diploe | |||||
| BV/TVa | 46.07 ± 11.197 | 62.79 ± 11.84 | 48.71 ± 11.55 | 47.86 ± 8.83 | 60.63 ± 13.84 |
| SMIb | −1.02 ± 1.75 | −2.83 ± 1.74 | −1.23 ± 1.28 | −1.58 ± 1.00 | −4.04 ± 3.40 |
| Tb.Thb | 0.23 ± 0.03 | 0.27 ± 0.06 | 0.24 ± 0.07 | 0.25 ± 0.03 | 0.30 ± 0.06 |
| Tb.N | 1.96 ± 0.33 | 2.43 ± 0.76 | 2.03 ± 0.11 | 1.93 ± 0.31 | 2.02 ± 0.24 |
| Tb.Sp | 0.52 ± 0.14 | 0.35 ± 0.15 | 0.44 ± 0.29 | 0.53 ± 0.85 | 0.43 ± 0.88 |
| DA | 1.95 ± 0.54 | 2.16 ± 0.58 | 2.57 ± 1.01 | 1.90 ± 0.49 | 1.90 ± 0.66 |
| FD | 2.60 ± 0.06 | 2.62 ± 0.07 | 2.56 ± 0.05 | 2.59 ± 0.04 | 2.61 ± 0.04 |
| Po.Tot | 50.36 ± 16.99 | 37.20 ± 11.84 | 51.28 ± 11.55 | 52.14 ± 8.83 | 39.37 ± 13.84 |
| Conn.D | 39.96 ± 17.74 | 36.74 ± 21.05 | 32.75 ± 21.20 | 28.07 ± 8.94 | 19.42 ± 3.92 |
| Inner table | |||||
| BV/TV | 93.32 ± 4.09 | 92.62 ± 3.96 | 88.21 ± 7.41 | 91.42 ± 2.83 | 88.04 ± 8.30 |
| Po.Dm | 0.08 ± 0.03 | 0.1 ± 0.03 | 0.12 ± 0.01 | 0.12 ± 0.03 | 0.11 ± 0.05 |
| FD | 2.32 ± 0.09 | 2.40 ± 0.07 | 2.28 ± 0.04 | 2.36 ± 0.09 | 2.41 ± 0.12 |
| Po.Tot | 5.46 ± 3.09 | 7.37 ± 3.96 | 11.78 ± 7.41 | 8.57 ± 2.83 | 11.82 ± 8.38 |
BV/TV, bone volume fraction (%); Po.Dm, pore diameter (mm); FD, fractal dimension; Po.Tot, total porosity (%); Tb.N, trabecular number (mm−1); Tb.Th, trabecular thickness (mm); Tb.Sp, trabecular separation (mm); SMI, structure model index; Conn.D, connectivity density (mm−3); DA, degree of anisotropy.
Significant overall inter‐group differences but not between individual groups; anova, P < 0.05.
Significant difference between the control group and type D of HFI; anova, P < 0.05.
Figure 3.
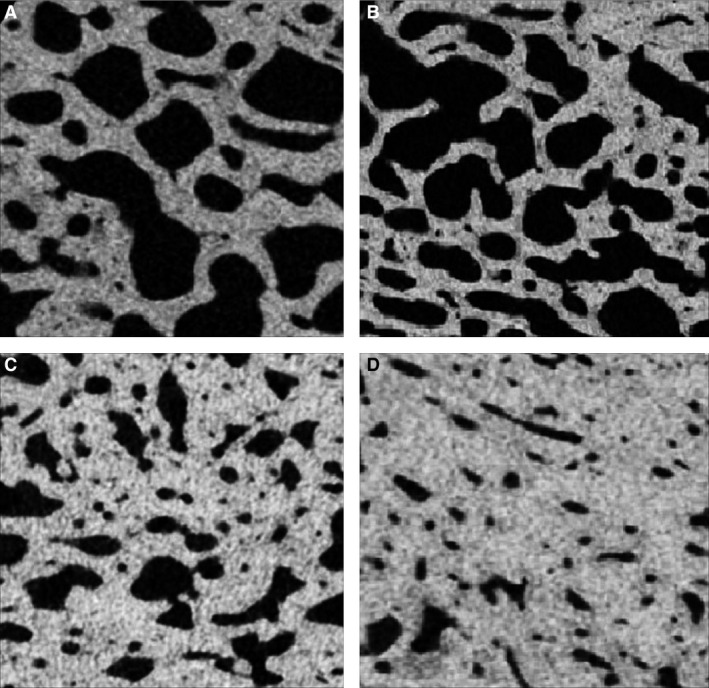
Cross‐section micro‐computed tomography images of the diploic region of the frontal bone in women demonstrating different macroscopic types (A, B, C and D) of HFI.
Since the comparison between the control group and the groups with different types of HFI reported significant differences only between the control group and the group with type D HFI, we reclassified the group with HFI into two groups: moderate HFI (comprising original types A, B and C) and severe HFI (type D). When comparing the control group with the groups with moderate and severe HFI, significant inter‐group differences were detected in the regions of diploe and the inner table (Table 3). Specifically, in the region of diploe bone volume fraction and trabecular thickness were significantly higher in the group with severe HFI than in the control group, whereas structure model index and connectivity density showed significantly lower values in severe HFI compared with the controls (Table 3). In the inner table region, pore diameter varied significantly among the investigated groups, showing the highest value in the group with severe HFI, although in post‐hoc pairwise comparisons, significant differences between the particular groups were not reached. Total porosity in the inner table region was generally affected by the group, with post‐hoc multiple comparisons again revealing significant inter‐group differences only between the control and severe HFI groups.
Table 3.
Differences of microstructural parameters between control group, moderate form of HFI (comprising types A, B and C of HFI) and severe form of HFI (type D) for different regions of the frontal bone
| Microstructural parameters | Control group (n = 14) | Moderate HFI (types A, B and C) (n = 12) | Severe HFI (type D) (n = 8) |
|---|---|---|---|
| Total sample | |||
| BV/TV | 62.33 ± 11.63 | 70.62 ± 8.30 | 67.90 ± 14.01 |
| Outer table | |||
| BV/TV | 95.06 ± 1.55 | 95.30 ± 1.72 | 60.63 ± 13.84 |
| Po.Dm | 0.08 ± 0.01 | 0.08 ± 0.02 | 0.08 ± 0.04 |
| FD | 2.38 ± 0.05 | 2.42 ± 0.04 | 2.39 ± 0.08 |
| Po.Tot | 4.94 ± 1.55 | 4.70 ± 1.72 | 5.29 ± 3.24 |
| Diploe | |||
| BV/TVa | 46.07 ± 11.19 | 53.12 ± 12.12 | 60.63 ± 13.84 |
| SMIa | −1.02 ± 1.75 | −1.88 ± 1.44 | −4.04 ± 3.40 |
| Tb.Tha | 0.23 ± 0.03 | 0.25 ± 0.05 | 0.30 ± 0.06 |
| Tb.N | 1.96 ± 0.33 | 2.13 ± 0.48 | 2.02 ± 0.24 |
| Tb.Spa | 0.52 ± 0.14 | 0.44 ± 0.12 | 0.43 ± 0.88 |
| DA | 1.95 ± 0.54 | 2.21 ± 0.72 | 1.90 ± 0.66 |
| FD | 2.60 ± 0.06 | 2.59 ± 0.06 | 2.61 ± 0.04 |
| Po.Tot | 50.36 ± 16.99 | 46.88 ± 12.12 | 39.37 ± 13.84 |
| Conn.Da | 39.96 ± 17.74 | 32.52 ± 16.70 | 19.42 ± 3.92 |
| Inner table | |||
| BV/TV | 93.32 ± 4.09 | 90.75 ± 5.02 | 88.04 ± 8.30 |
| Po.Dma | 0.08 ± 0.03 | 0.11 ± 0.03 | 0.11 ± 0.05 |
| FD | 2.31 ± 0.09 | 2.35 ± 0.08 | 2.41 ± 0.12 |
| Po.Tota | 5.46 ± 3.09 | 9.24 ± 5.02 | 11.82 ± 8.38 |
BV/TV, bone volume fraction (%); Po.Dm, pore diameter (mm); FD, fractal dimension; Po.Tot, total porosity (%); Tb.N, trabecular number (mm−1); Tb.Th, trabecular thickness (mm); Tb.Sp, trabecular separation (mm); SMI, structure model index; Conn.D, connectivity density (mm−3); DA, degree of anisotropy.
Significant difference between the HFI type D and the control group; anova, P < 0.05.
Additionally, comparing microstructural parameters between the outer and inner tables in the group with HFI revealed a significantly higher porosity and lower bone volume fraction in the inner table than in the outer table. No significant differences in these parameters were detected between the regions of inner and outer tables in the control group. Distribution of pore diameters in women with HFI suggests that the increased porosity of the inner table compared with the outer table occurred due to higher number of large pores (larger than 100 μm) (Fig. 4).
Figure 4.

The distribution of pore diameters in the inner and outer tables in women with HFI. Note the dominance of larger pores in the inner table.
Discussion
Although it could be expected that HFI ultimately leads to bone sclerosis, our microstructural analysis of the whole bone thickness showed no significant differences in the total bone volume fraction between the frontal bone samples from HFI at any stage and control groups. However, micro‐CT evaluation of the bone samples showed a different pattern of bone microarchitectural organization in women with HFI than the age‐ and sex‐matched control group. Specifically, the samples with HFI displayed more porous inner table of the frontal bone, whereas the diploic space showed an increased bone volume fraction due to thicker and more plate‐like trabeculae (Fig. 2).
Pathogenesis of HFI is not yet well understood. The ‘global model’ of HFI proposed by Hershkovitz et al. (1999) considers vascularization originating from the dura as one of the key factors in the pathogenesis of HFI (Hershkovitz et al. 1999). Talarico et al. (2008) reported that in the woman with HFI inner table exhibited extensive remodeling, consisted almost exclusively of large sinuses, and extended to the external periosteal layer of the dura (Talarico et al. 2008). Our findings of significantly higher porosity of the inner table in women with HFI than in controls may suggest increased penetration of dural vessels to the inner table. Furthermore, in women with HFI a significantly higher porosity was evident in the inner table than in the outer table. Analysis of the distribution of pore diameters between the outer and inner tables in women with HFI revealed that increased porosity of the inner table originates from more abundant pores larger than 100 μm (Fig. 4). Considering that the control group did not show such differences between the inner and outer table it is likely that increased porosity of the inner table is related to the pathogenesis of HFI. Therefore it is possible that larger pores occur as a result of penetration of blood vessels from the dura, ultimately leading to diploization of the inner table.
The fact that HFI is more frequent in females may suggest that estrogen is an important factor in its development. Although direct experimental evidence is still insufficient, it is likely that estrogen effects on development and proliferation of blood vessels may be involved. In general, estrogen receptors are localized mostly on the vascular tissue of dura and estrogen is known to play an important role in meningeal vascularity (Glinskii et al. 2007). Angiogenesis under estrogen stimulation has been widely investigated (Yun et al. 2009; Liu et al. 2015). It has been suggested that estrogen activates the hypoxia‐inducible factor‐α (HIFα) signaling pathway leading to activation of proangiogenic genes, primarily for vascular endothelial growth factor (VEGF; Yun et al. 2009; Peng et al. 2014). In this way estrogen can stimulate angiogenesis. There is much evidence that bone turnover is related to bone vasculature (Brandi & Collin‐Osdoby, 2006; Pufe et al. 2007; Griffith et al. 2010). In particular, the endothelium of blood vessels may be a key factor in such a relationship, not only being an essential barrier limiting the movement of cells and molecules between the circulation and bone surface but also being able to directly communicate with adjacent tissue and circulating blood cells (Brandi & Collin‐Osdoby, 2006). Endothelial cells (EC) are capable of responding to bone modulators (such as sex steroid hormones) and can release regulatory molecules (growth factors, BMPs, cytokines, endothelins, free radicals, prostanoids) known to affect the differentiation, metabolism, survival and function of bone‐forming cells (Streeten et al. 1989; Brandi & Collin‐Osdoby, 2006). As EC also separate mesenchymal stem cells (MSC) in peripheral circulation from the bone surface, MSC migration may be directly orchestrated by endothelial cells (Imai et al. 1999). Additionally, bone marrow stromal cells exhibit osteogenic potential under EC guidance (von Schroeder et al. 2003).
Although the ‘global model’ of HFI pathogenesis (Hershkovitz et al. 1999) suggests that diploic space is not directly involved in HFI, our microarchitectural findings demonstrated clear differences between HFI and control group in the region of diploe (Fig. 2). Clearly, after blood vessels from the dura penetrate the inner table and enter the diploic space, they can branch extensively within the intertrabecular pores and could modulate bone remodeling (Brandi & Collin‐Osdoby, 2006). Our micro‐CT analysis showing thickened trabeculae and significantly increased bone volume fraction of the diploe in women with HFI compared with the control group clearly emphasized an osteogenic phenotype of the diploic region in women with HFI. Based on molecular studies, increased osteogenesis can be accomplished by HIFα‐mediated estrogen modulation of EC functional interactions (increased migration of osteoblast precursors from circulation, increased production of VEGF, increased proliferation and differentiation of BMSC). Thus, the changes in bone microarchitecture in the region of diploe observed in our study could occur as a result of previously reported effects of activated HIF‐α signaling pathway, such as an increase in BV/TV, trabecular thickness and microvascular density (Peng et al. 2014; Weng et al. 2014). Previous studies in the patients with HFI also demonstrated a similar trend of altered bone structure in the region of diploe, such as trabecular thickening (She & Szakacs, 2004) and a sclerotic and dense internal part of diploe with small cavities (Ruhli et al. 2007). Common macroscopic classification of HFI describes four types of this phenomenon (A, B, C and D) that are often regarded as ‘phases’ or consecutive ‘stages’ in the course of HFI development. However, our study showed that these macroscopic phases could not be distinguished at the level of bone microarchitecture and their consecutive nature cannot be further supported. Specifically, the comparisons of types A, B, C and D of HFI and control group suggested that significant inter‐group differences in microstructural parameters existed only between the type D of HFI and the control group (Table 2). Therefore, based on our microarchitectural evaluation of macroscopic stages of HFI we can suggest that only two different types of HFI should be considered: moderate (comprising the types A, B and C) and severe HFI (comprising type D).
This study is limited by its cross‐sectional design, which did not permit an assessment of temporal relations among the variables; therefore, we were unable to directly show evolution of bone changes during development of HFI. Also, to support the association between an increased porosity and vascularization of the frontal bone, it is necessary to conduct further histological studies to visualize the vasculature in conjunction with the micro‐CT findings.
Conflicts of interest
The authors have no conflicts of interest to declare.
Author contributions
D.B., D.D. and M.D. conceived and designed the experiments. V.Z., Z.R., S.N, P.M. and D.B. performed the experiments. D.D., D.B., M.D., P.M. and S.N. acquired and analyzed the data. D.D., P.M., Z.R. and D.B. wrote the paper. D.B., D.D., S.N., P.M., Z.R., V.Z. and M.D. critically revised the paper.
Acknowledgements
This study was supported by the Ministry of Science and Technology of the Republic of Serbia.
References
- Attanasio F, Granziera S, Giantin V, et al. (2013) Full penetrance of Morgagni‐Stewart‐Morel syndrome in 75‐years old women: case report and review of the literature. J Clin Endocrinol Metab 98, 453–457. [DOI] [PubMed] [Google Scholar]
- Brandi ML, Collin‐Osdoby P (2006) Vascular biology and the skeleton. J Bone Miner Res 21, 183–192. [DOI] [PubMed] [Google Scholar]
- Cetiner Batun G, Yuruyen M, Vatankulu B, et al. (2015) Hyperostosis frontalis interna presenting as depression and parkinsonism in an older woman. Psychogeriatrics doi: 10.1111/psyg.12166. [Epub ahead of print]. [DOI] [PubMed] [Google Scholar]
- Devriendt W, Piercecchi‐Marti MD, Adalian P, et al. (2005) Hyperostosis frontalis interna: forensic issues. J Forensic Sci 50, 143–146. [PubMed] [Google Scholar]
- Djonic D, Bracanovic D, Rakocevic Z, et al. (2016) Hyperostosis frontalis interna in postmenopausal women – possible relation to osteoporosis. Women Health 19, 1–14. [DOI] [PubMed] [Google Scholar]
- Glinskii OV, Abraha TW, Turk JR, et al. (2007) Microvascular network remodeling in dura mater of ovariectomized pigs: role for angiopoietin‐1 in estrogen‐dependent control of vascular stability. Am J Physiol Heart Circ Physiol 293, H1131–H1137. [DOI] [PMC free article] [PubMed] [Google Scholar]
- Griffith JF, Wang YX, Zhou H, et al. (2010) Reduced bone perfusion in osteoporosis: likely causes in an ovariectomy rat model. Radiology 254, 739–746. [DOI] [PubMed] [Google Scholar]
- Hershkovitz I, Greenwald C, Rotschild BM, et al. (1999) Hyperostosis frontalis interna: an anthroplogical perspective. Am J Phys Anthropol 109, 303–325. [DOI] [PubMed] [Google Scholar]
- Imai K, Kobayashi M, Wang J, et al. (1999) Selective secretion of chemoattractants for haemopoietic progenitor cells by bone marrow endothelial cells: a possible role in homing of haemopoietic progenitor cells to bone marrow. Br J Haematol 106, 905–911. [DOI] [PubMed] [Google Scholar]
- Liu LH, Lai Y, Linghu LJ, et al. (2015) Effect of different concentrations of medroxy‐progesterone acetate combined with 17β‐estradiol on endothelial progenitor cells. Eur Rev Med Pharmacol Sci 19, 1790–1795. [PubMed] [Google Scholar]
- May H, Peled N, Dar G, et al. (2011) Hyperostosis frontalis interna: what does it tell us about our health?. Am J Hum Biol 23, 392–397. [DOI] [PubMed] [Google Scholar]
- May H, Mali Y, Dar G, et al. (2012) Intracranial volume, cranial thickness, and hyperostosis frontalis interna in the elderly. Am J Hum Biol 24, 812–819. [DOI] [PubMed] [Google Scholar]
- Moore S (1955) Hyperostosis cranii. Springfield: CC Thomas. [Google Scholar]
- Nikolic S, Djonic D, Zivkovic V, et al. (2010) Rate of occurrence, gross appearance, and age relation of hyperostosis frontalis interna. Am J Forensic Med Pathol 31, 205–207. [DOI] [PubMed] [Google Scholar]
- Peng J, Lai ZG, Fang ZL, et al. (2014) Dimethyloxalylglycine prevents bone loss in ovariectomized c57bl/6j mice through enhanced angiogenesis and osteogenesis. PLoS ONE 9, e112744. [DOI] [PMC free article] [PubMed] [Google Scholar]
- Pufe T, Claassen H, Scholz‐Ahrens KE, et al. (2007) Influence of estradiol on vascular endothelial growth factor expression in bone: a study in Gottingen miniature pigs and human osteoblasts. Calcif Tissue Int 80, 184–191. [DOI] [PubMed] [Google Scholar]
- Raikos A, Paraskevas G, Yusuf F, et al. (2011) Etiopathogenesis of hyperostosis frontalis interna: a mistery still. Ann Anat 193, 453–458. [DOI] [PubMed] [Google Scholar]
- Ruhli FJ, Kuhn G, Evison R, et al. (2007) Diagnostic value of micro‐CT in comparison with histology in the qualitative assessment of historical human skull bone pathologies. Am J Phys Anthropol 133, 1099–1111. [DOI] [PubMed] [Google Scholar]
- von Schroeder HP, Veillette CJ, Payandeh J, et al. (2003) Endothelin‐1 promotes osteoprogenitor proliferation and differentiation in fetal rat calvarial cell cultures. Bone 33, 673–684. [DOI] [PubMed] [Google Scholar]
- She R, Szakacs J (2004) Hyperostosis frontalis interna: case report and review of literature. Ann Clin Lab Sci 34, 206–208. [PubMed] [Google Scholar]
- Streeten EA, Ornberg R, Curcio F, et al. (1989) Cloned endothelial cells from fetal bovine bone. Proc Natl Acad Sci U S A 86, 916–920. [DOI] [PMC free article] [PubMed] [Google Scholar]
- Talarico E, Prather A, Hardt K (2008) A case of extensive hyperostosis frontalis interna in an 87‐year‐old female human cadaver. Clin Anat 21, 259–268. [DOI] [PubMed] [Google Scholar]
- Weng T, Xie Y, Huang J, et al. (2014) Inactivation of Vhl in osteochondral progenitor cells causes high bone mass phenotype and protects against age‐related bone loss in adult mice. J Bone Miner Res 29, 820–829. [DOI] [PMC free article] [PubMed] [Google Scholar]
- Yun SP, Lee MY, Ryu JM, et al. (2009) Role of HIF‐1alpha and VEGF in human mesenchymal stem cell proliferation by 17beta‐estradiol: involvement of PKC, PI3K/Akt, and MAPKs. Am J Physiol Cell Physiol 296, C317–C326. [DOI] [PubMed] [Google Scholar]