

Abstract
Background and Purpose
Although clinically useful for their immunomodulatory, antiproliferative and antiviral properties, type I interferons (IFNs) are involved in the pathogenesis of several neurodegenerative/neuroinflammatory diseases. In the present study, we investigated the ability of cholinergic stimulation to protect from IFN‐β‐induced neuronal apoptosis.
Experimental Approach
The effects of the ACh receptor agonist carbachol (CCh) on IFN‐β‐induced apoptosis of human SH‐SY5Y neuroblastoma cells were examined by using western blots, immunofluorescence and cytofluorimetry. The involvement of muscarinic acetylcholine receptors (mAChRs) was assessed by using selective antagonists and siRNA transfection. Pharmacological inhibitors and overexpression of ERK2 and an ERK2 constitutively active form (ERK2‐CA) were employed to study ERK1/2 signalling. The effects of oxotremorine‐M (Oxo‐M) on IFN‐β‐induced apoptosis of mouse hippocampal neurons were examined by measuring cleaved caspase 3 expression.
Key Results
In SH‐SY5Y cells, CCh inhibited IFN‐β‐induced mitochondrial cytochrome c release, activation of caspases 9, 7 and 3, PARP cleavage and DNA fragmentation. The anti‐apoptotic effect of CCh was mediated by M3 receptors, blocked by Gq/11 antagonist YM254890 and PKC inhibitor Go 6983, impaired by inhibition of ERK1/2 pathway, potentiated by overexpression of ERK2 and mimicked by ERK2‐CA. Blockade of JNK activation enhanced the CCh anti‐apoptotic response. IFN‐β inhibited JNK activation and up‐regulated CCh‐induced ERK1/2 signalling. In hippocampal neurons, Oxo‐M reduced IFN‐β‐induced apoptosis; this effect was antagonized by blockade of M1/M3 receptors and ERK1/2.
Conclusions and Implications
Stimulation of mAChRs counteracted IFN‐β‐induced neuronal apoptosis through the activation of ERK1/2 signalling. The data indicate that activation of ERK1/2‐coupled mAChRs may be an effective strategy for preventing IFNs neurotoxicity.
Abbreviations
- AMPK
AMP activated protein kinase
- CCh
carbachol
- CYT IV
cytochrome c oxidase IV
- ERK2‐CA
a constitutively active form of ERK2
- mAChRs
muscarinic acetylcholine receptors
- MARCKS
myristoylated alanine‐rich PKC substrate
- MS
multiple sclerosis
- MT‐3
muscarinic toxin 3
- MT‐7
muscarinic toxin 7
- NF
neurofilamen
- Oxo‐M
oxotremorine‐M
- RA
all‐trans retinoic acid
- siRNA
small interfering RNA
Tables of Links
| TARGETS | |
|---|---|
| GPCRs a | Enzymes d |
| M1 receptor | AMPK |
| M3 receptor | Caspase 3 |
| Catalytic receptors b | ERK1 |
| IFN receptors | ERK2 |
| Other protein targets c | JNK |
| Bcl‐2 | p38 MAPK |
| Mcl‐1 | PKC |
| PKR | |
| PARPs | |
| Tyk2 |
| LIGANDS | |
|---|---|
| AG1478 | Methoctramine |
| Atropine | MT‐3 |
| BIRB0796 | MT‐7 |
| Carbachol | Oxotremorine‐M |
| Compound C | PD98059 |
| Darifenacin | Pilocarpine |
| Eserine (physostigmine) | U0126 |
| Go 6983 | VX745 |
| IFN‐β1b |
These Tables list key protein targets and ligands in this article which are hyperlinked to corresponding entries in http://www.guidetopharmacology.org, the common portal for data from the IUPHAR/BPS Guide to PHARMACOLOGY (Southan et al., 2016) and are permanently archived in the Concise Guide to PHARMACOLOGY 2015/16 (a,b,c,dAlexander et al., 2015a, 2015b, 2015c, 2015d).
Introduction
Type I interferons (IFNs) are a family of cytokines that mediate the host innate immune response against invading microorganisms (Borden et al., 2007). Although IFN‐α and IFN‐β are employed for treating chronic viral infections, various types of malignant tumours and multiple sclerosis (MS) (George et al., 2012; Gibbert et al., 2013), their therapeutic use has been found to exacerbate neuroinflammatory diseases in some patients (Axtell et al., 2011) and is often accompanied by a number of neuropsychiatric side effects, including cognitive impairment, psychosis and depression (Raison et al., 2005). Moreover, an increasing body of evidence indicates that these cytokines can also play a central role in the pathogenesis of different neuroinflammatory diseases. Thus, an abnormal production of IFN‐α has been implicated as a causative factor in Aicardi–Goutieres syndrome, Cree encephalitis, congenital and HIV‐associated encephalitis and systemic lupus erithematosus‐associated psychosis (Hofer and Campbell, 2013). Animal studies have demonstrated that chronic exposure to type I IFNs has deleterious effects on brain structure and function. Transgenic mice bearing astrocyte‐targeted production of IFN‐α develop an inflammatory process in different brain areas associated with neuronal loss and enhanced expression of classical IFN‐stimulated genes (Campbell et al., 1999). Type I IFNs have also been implicated in pathological ageing, as in aged mice intra‐cerebrospinal fluid administration of anti‐type I IFN receptor neutralizing antibodies restored cognitive functions and hippocampal neurogenesis (Baruch et al., 2014).
Although the cellular and molecular mechanisms of type I IFN neurotoxicity are not completely understood, several studies have shown that type I IFNs can alter central monoamine, opioid and glutamate neurotransmission, and promote release of pro‐inflammatory cytokines and chemokines from microglia (Dafny and Yang, 2005). In vitro studies have demonstrated that type I IFNs can act directly on neurons (Wang and Campbell, 2005) and induce neuronal cell death by triggering apoptosis (Dedoni et al. 2010), a pathological process common to neurodegenerative and neuropsychiatric disorders (Mattson, 2000; McKernan et al., 2009). In this context, the identification of pharmacological agents that inhibit type I IFN‐induced neuronal apoptosis may be useful to develop new therapeutic strategies for preventing or limiting type I IFNs neurotoxicity.
In different cell types activation of muscarinic acetylcholine receptors (mAChRs) has been shown to exert anti‐apoptotic effects (Resende and Adhikari, 2009). In neuroblastoma SH‐SY5Y cells, which are widely used as a human neuroblast‐like cell system to study neurodegenerative and neuroadaptive processes, mAChR stimulation has been reported to prevent apoptosis induced by different agents, including camptothecin, hydrogen peroxyde and rotenone. However, mAChR stimulation did not counteract caspase‐3 activation by staurosporine, indicating that the protection was limited to a defined set of pro‐apoptotic insults (De Sarno et al., 2003). Moreover, little information is available on whether mAChR activation can counteract neuronal cell death elicited by pro‐inflammatory cytokines involved in neurodegenerative diseases, such as type I IFNs.
In the present study, we examined whether mAChR stimulation was capable of protecting SH‐SY5Y neuroblastoma cells and mouse primary hippocampal neurons from apoptosis induced by exposure to IFN‐β.
Methods
Cell culture
SH‐SY5Y cells were obtained from the European Cell Culture Collection (Salisbury, UK). Cells were grown in Ham's F12/MEM medium (1:1) supplemented with 2 mM L‐glutamine,1% non‐essential amino acids, 10% FCS and 100 U·mL−1 penicillin‐100 μg·mL−1 streptomycin (Invitrogen/Life Technologies, Monza, Italy) at 37°C in a humidified atmosphere of 5% CO2 in air. The cell doubling time was 46–50 h.
Cells were differentiated by exposure to all‐trans retinoic acid (RA) (Sigma‐Aldrich, St. Louis, MO, USA) dissolved in DMSO for 6–8 days. The final RA concentration (10 μM) was obtained by diluting stock solution in the culture medium. The medium was replaced by fresh medium every other day and during the RA treatment care was taken to avoid cell culture exposure to light.
Primary cultures of neurons from mouse hippocampus
Animal studies are reported in compliance with the ARRIVE guidelines (Kilkenny et al., 2010; McGrath and Lilley, 2015).
CD‐1 mice were obtained from Harlan (Udine, Italy). Experiments were performed in accordance with the European Communities Council Directive (86/609EEC) and the Principles of Laboratory Animal Care in Italy, and were approved by the Institutional Ethical Committee. One day‐old mice of both sexes were used to prepare primary cultures of hippocampal neurons as previously described (Dedoni et al., 2014b). Briefly, the brains were placed in ice‐cold Neurobasal A medium and the hippocampus was isolated under a dissection microscope, triturated and dissociated by incubation in Neurobasal A medium containing 0.05% trypsin for 30 min at 30°C and treatment with 50 μg·mL−1 of DNase I (Sigma‐Aldrich) for 5 min. Cells were collected by centrifugation and resuspended in Neurobasal A medium containing B‐27 serum‐free supplement, 0.5 mM L‐glutamine, 50 μM β‐mercaptoethanol and penicillin–streptomycin (Invitrogen). Cells were plated on glass coverslips placed in 24‐well plates and pre‐coated with 0.01% poly‐L‐lysine (Sigma‐Aldrich) at a density of 0.8–1.0 × 10⁵ cells per well. The medium was removed 4 h later and replaced by fresh medium. Cultures were used 6–8 days after plating and contained 90–95% neuronal cells as assessed by immunofluorescence staining with anti‐neurofilament of 160/200 kDa (NF) and anti‐glial fibrillary acidic protein antibodies (Sigma‐Aldrich). Six separate culture preparations were used.
Cell transfections
SH‐SY5Y cells were transfected with either human M3 receptor Silencer® Select small interfering RNA (siRNA) or Silencer® negative control (Ambion/Life Technologies, Monza, Italy) using Lipofectamine RNAiMAX (Invitrogen/Life Technologies) as transfection reagent. Cells were grown in 6‐well plates and were incubated in antibiotic‐free medium for 24 h. The medium was substituted with Opti‐MEM I reduced serum medium (Invitrogen/Life Technologies), and with 24 h time interval, the cells were transfected twice with siRNA duplexes (100 nM) for 12 h at 37°C. Cells were analysed 48 h post‐transfection. The transfection efficiency was ~55% as determined by fluorescein‐conjugated control siRNA‐A (Santa Cruz Biotechnology, Santa Cruz, CA, USA).
Cell transfections with either pcDNA3‐HA‐ERK2 (HA‐ERK2) (Dimitri et al., 2005), pCMV‐myc‐ERK2‐L4A‐MEK1 fusion construct (ERK2‐CA), a constitutively active form of ERK2 (Robinson et al., 1998), both obtained from Addgene (Cambridge, MA, USA) or Gαq Q209L (UMR cDNA Resource Center, Rolla, USA), a constitutive active form of Gαq (Quian et al., 1993) were performed in antibiotic‐free growth medium containing 2% FCS by using Lipofectamine 2000 as transfection reagent and 2 μg cDNA. Control samples were transfected with an equal amount of the vectors pcDNA3.1(+) (Invitrogen/Life Technologies) in the experiments using HA‐ERK2 and Gαq Q209L and p‐FLAG‐CMV‐6a‐BAP (Sigma‐Aldrich) in the experiments using ERK2‐CA. Cells were used 48 h post‐transfection.
Cell treatment
Unless otherwise specified, SH‐SY5Y cells randomly distributed into the wells were incubated at 37°C in a humidified atmosphere of 5% CO2 in serum‐free medium containing the various agents as described in the text. Agents were dissolved either in sterile saline solution or in DMSO (final concentration < 0.5%). Control samples received an equal amount of vehicle. At the end of the incubation period, cells were washed with PBS and incubated with ice‐cold RIPA buffer containing PBS, 0.1% SDS, 1% Nonidet P‐40, 0.5% sodium deoxycholate, 2 mM EDTA, 2 mM EGTA, 4 mM sodium pyrophosphate, 2 mM sodium orthovanadate, 10 mM sodium fluoride, 20 nM okadaic acid, 1 mM PMSF, 0.5% phosphatase inhibitor cocktail 3 and 1% protease inhibitor cocktail (Sigma‐Aldrich). The samples were sonicated for 5 s in an ice‐bath and aliquots of cell extracts were taken for protein determination (Bio‐Rad, Hercules, CA, USA) using BSA as a standard.
Cytochrome c release from mitochondria
Cytocrome c release was determined as previously described (Dedoni et al., 2014a). Briefly, SH‐SY5Y cells were treated with the indicated agents, harvested in ice‐cold PBS, centrifuged and resuspended in ice‐cold homogenization buffer (100 mM Tris/MOPS, 0.2 M sucrose, 1 mM EGTA, pH 7.4, supplemented with 10 mM sodium fluoride, 1 mM PMSF, 0.1% phosphatase inhibitor cocktail 3 and 1% protease inhibitor cocktail). Cells were homogenized by using a Teflon/glass tissue grinder operated at 800 rpm (20 strokes) at ice‐bath temperature. The cell lysate was centrifuged at 1000 g for 10 min to remove unbroken cells and nuclei and the supernatant was centrifuged at 12 000 g for 15 min at 4°C to obtain a supernatant and a pellet. The supernatant was used as cytosolic fraction, whereas the pellet containing the mitochondria was washed and resuspended in homogenization buffer. Aliquots of each fraction containing an equal amount of protein were mixed with sample buffer.
Western blot analysis
Cell proteins were applied onto either 10 or 12% SDS‐polyacrylamide gels, separated by electrophoresis, and electrophoretically transferred to PVDF membranes (Amersham Biosciences, Piscataway, NJ, USA). Following blocking with either 5% BSA or 5% non‐fat dry milk (Santa Cruz Biotechnology) and washing, the membranes were incubated overnight at 4°C with one of the following primary antibodies: phospho‐ERK 1 (Thr202/Tyr204)/ERK2(Thr185/Tyr187) (Neuromics, Northfield, MN, USA); phospho‐p38 MAPK (Thr180/Tyr182), phospho‐JNK (Thr183/Tyr185), phospho‐c‐Jun (Ser63), phospho‐Tyk2 (Tyr1054/1055), Tyk2, ERK1/2, phospho‐AMP activated protein kinase (AMPK) α subunit (Thr172), phospho‐myristoylated alanine‐rich protein kinase C substrate (MARCKS) (Ser152/156), phospho‐MAPKAPK‐2 (MK2) (Thr334), phospho‐Bad (Ser112), Bad, phospho‐Mcl‐1 (Thr163), protein kinase R (PKR), cleaved PARP (Asp214), PARP, cleaved caspase 9, procaspase 9, cleaved caspase 7, procaspase 7 (Cell Signaling Technology, Beverly, MA, USA); AMPKα1/2 (sc‐25 792), p38α/β MAPK (sc‐7972), JNK (sc‐571), MK2 (sc‐6221), STAT1 (sc‐592), Bcl‐2 (sc‐492), Mcl‐1 (sc‐819), cytochrome c oxidase IV (CYT IV) (sc‐69 359) (Santa Cruz Biotechnology); phospho‐STAT1 (Tyr701) (Thermo Fisher, Rockford, IL, USA); M3 mAChRs (Alomone Labs, Jerusalem, Israel); cytochrome c (Millipore, Temecula, CA, USA); MARCKS (Signalway Antibody, Baltimore, MD, USA); GAPDH (Synaptic Systems, Gottingen, Germany); anti‐HA epitope tag (Thermo Fisher Scientific, Rockford, IL, USA); Gαq/11 (PerkinElmer Life Sciences/NEN, Waltham, MA, USA); actin (Sigma‐Aldrich). Thereafter, the membranes were washed and incubated with an appropriate horseradish peroxidase‐conjugated secondary antibody (Santa Cruz Biotechnology). Immunoreactive bands were detected by using Clarity Western ECL substrate (Bio‐Rad) and ECL Hyperfilm (Amersham). Band densities were determined by densitometric analysis using Image Scanner III (GE Healthcare, Milan, Italy) and NIH imagej software (US National Institutes of Health, Bethesda, MA, USA). The optical density of phosphoproteins was normalized to the density of the corresponding total protein in the same samples. For cleaved PARP and cleaved caspases, the formation of the cleaved protein was normalized to the level of the uncleaved form determined in the same samples. For the remaining proteins, the densitometric values were normalized to the levels of either actin or GAPDH.
Assay of caspase 3/7 activity
Cells were grown in 96 well plates (ViewPlate‐96, PerkinElmer, Waltham, MA, USA), serum‐starved overnight and incubated in serum‐free medium with the test agents for 24 h. Cells were then washed and assayed for caspase 3/7 activity by using the Caspase‐Glo 3/7 assay kit (Promega, Madison, WI, USA) according to the manufacturer's instructions. Luminescence intensity was measured by using a Wallac Victor III microplate reader (PerkinElmer).
Immunofluorescence analysis
SH‐SY5Y cells and primary mouse hippocampal neurons grown onto poly‐L‐lysine‐coated coverslips were incubated in medium without FCS or B27 supplement, respectively, in the presence of the agents as indicated in the text. Thereafter, the cells were fixed in 4% paraformaldehyde, permeabilized with 0.2% Triton X‐100 and blocked with 3% BSA and 1% normal goat serum. Cells were then incubated overnight at 4°C with rabbit anti‐cleaved caspase 3 antibody (1:200) (Cell Signaling Technology). Hippocampal neurons were also stained with mouse monoclonal anti‐NF(1:500) (Sigma‐Aldrich). Following incubation with Alexa 488‐conjugated goat anti‐rabbit IgG (1:3000) (Molecular Probes/Life Technologies, Monza, Italy) (SH‐SY5Y cells) or the combination of this secondary antibody with Alexa‐594‐conjugated goat anti‐mouse IgG (1:4000) (Molecular Probes/Life Technologies) (hippocampal neurons). Cell nuclei were stained with 0.1 μg·mL−1 DAPI (Sigma‐Aldrich). Cells were examined by fluorescence microscopy by using an Olympus IX71 microscope and an Olympus Fwiew charge‐coupled device camera. Images were captured over randomly selected fields and analysed with the software cell p (Olympus Soft Imaging Solutions, Hamburg, Germany). Cells were deemed to be positive for cleaved caspase 3 if the average pixel intensity of the green fluorescence was equal to, or above, a threshold value corresponding to one SD above the average pixel intensity of the cells in control samples (Olianas et al., 2011). The % of positive cells was calculated as the number of positive cells/total number of nuclei stained by DAPI X 100. Five separate culture preparations were analysed.
TUNEL assay
SH‐SY5Y cells grown on glass coverslips were treated as indicated in the text. An in situ TUNEL assay was performed using the DeadEnd fluorimetric TUNEL system (Promega, Madison, USA), according to the manufacturer's instructions. Cell nuclei were stained with DAPI. Images were captured over randomly selected fields and analysed with Cell P software as described for cleaved caspase 3. Five separate culture preparations were analysed.
Cell number and viability and annexin V analysis
Cell number and viability and annexin V expression were determined by fluorescence‐based analysis using the Muse Cell Count and Viability kit and the Muse Annexin V Cell kit provided by Millipore. Briefly, serum‐starved cells were exposed to the experimental agents for the indicated times in serum‐free medium, detached by trypsin/EDTA treatment, washed in medium containing 10% FCS and incubated with the assay reagent solutions for 5–15 min as specified by the manufacturer's protocols. Cells were then analysed by using the Muse Cell Analyzer (Millipore).
Blinding
All the data were analysed by an investigator who was unaware of the treatment protocol.
Statistical analysis
The data and statistical analysis comply with the recommendations on experimental design and analysis in pharmacology (Curtis et al., 2015). Results are reported as mean ± SEM. Concentration‐response curves were analysed by the programme Graph Pad Prism (San Diego, CA, USA.), which yielded EC50 values.
As raw values varied between experiments, data were routinely expressed as % or fold stimulation of control, which was included in each independent experiment. The control group was set as 100 or 1 with a variance obtained by expressing each control value as a ratio or % of the mean of the raw values of the control group. In the experiments where control values were equal to zero, values of experimental groups were expressed as a % of the effect elicited by IFN‐β alone, set as 100. The variance of this value was determined in the same manner as for the control group. Statistical analysis was performed by either Student's unpaired t test or one‐way ANOVA followed by Newman–Keuls post hoc test as appropriate. A value of P < 0.05 was considered to be statistically significant.
Materials
Recombinant human IFN‐β1b (32 × 106 UI·mg−1 protein) and mouse IFN‐β1b were obtained from Schering (Milano, Italy) and ProSpec‐Tany TechnoGene Ltd (Rehovot, Israel), respectively. Muscarinic toxin 7 (MT‐7) was from Peptide International (Louisville, KY, USA), whereas muscarinic toxin 3 (MT‐3) isolated from the venoms of Dendroaspis angusticeps was kindly provided by Profs. E. Karlsson and A. Adem (Karolinska Institute, Stockholm, Sweden). The cyclic depsipeptide YM‐254 890 was generously provided by Dr. Jun Takasaki, Yamanouchi Pharmaceutical Co. Ltd (Tsukuba, Ibaraki, Japan). Recombinant human epidermal growth factor (hEGF) was from Cell Signaling Technology. BIRB0796 was obtained from Axon Medchem BV (Groningen, The Netherlands). PD98059, U0126, N‐(4‐amino‐5‐cyano‐6‐ethoxy‐2‐pyridinyl)‐2,5‐dimethoxybenzeneacetamide (TCS JNK6o) and tyrphostin AG1478 were obtained from Tocris Bioscience (Bristol, UK). Benzyloxycarbonyl‐Val‐Ala‐Asp(OMe)‐fluoromethylketone (Z‐VAD‐FMK) was obtained from Biovision Research Products (Mountain View, CA, USA). Go 6983 was from Merck (La Jolla, CA, USA). Darifenacin hydrobromide and 5‐(2,6‐dichlorophenyl)‐2‐(2,4‐difluorophenylthio)‐6H‐pyrimido[1,6‐b]pyridazin‐6‐one (VX745) and cycloheximide were obtained from Santa Cruz Biotechnology. Carbachol (CCh), atropine sulphate, methoctramine hydrate, eserine (physostigmine) sulphate, 6‐[4‐(2‐piperidin‐1‐ylethoxy)phenyl]‐3‐pyridin‐4ylpyrazolo[1,5‐a]pyrimidine (Compound C), oxotremorine‐M (Oxo‐M), pilocarpine, and the other reagents were from Sigma‐Aldrich.
Results
CCh protects from IFN‐β‐induced apoptosis of SH‐SY5Y cells
As previously reported (Dedoni et al., 2010), exposure of SH‐SY5Y cells to IFN‐β (30 ng·mL−1) for 24 h decreased cell viability as compared with vehicle‐treated cells (Figure 1A). The ACh receptor agonist CCh (10 μM) failed to affect cell number and viability per se, but almost completely antagonized the cytotoxic effect of IFN‐β. Examination of cell morphology showed that CCh (10 μM) prevented the main morphological alterations induced by IFN‐β, namely cell shrinkage and neurite loss (Figure 1B). Cytofluorimetric analysis showed that cells treated for 16 h with IFN‐β displayed a significant increase in annexin V staining, an early marker of the apoptotic process (Figure 1C). This response was suppressed in cells co‐treated with CCh (10 μM).
Figure 1.

CCh protects from IFN‐β‐induced apoptosis. (A) SH‐SY5Y cells were incubated with either vehicle,10 μM CCh, IFN‐β (30 ng·mL−1) or CCh + IFN‐β for 24 h and then analysed for cell viability. Values are the mean ± SEM of six separate experiments. (B) Cells treated as in (A) were analysed by phase contrast microscopy. The arrows indicate the presence of cell shrinkage and neurite loss in IFN‐β‐treated samples. These morphological changes were prevented by the addition of CCh. Images are from one experiment representative of five independent experiments. Bar = 50 μm. (C) Cells were treated as indicated in (A) for 16 h and then analysed for annexin V staining by cytofluorimetry. Values are expressed as % of control (vehicle) and are the mean ± SEM of five separate experiments. (D) Cells were treated as in (A) and then cytosol and mitochondrial fractions were analysed for cytochrome c (cyt c), cytochrome c oxidase IV (CYT IV) and actin by western blots. Values are the mean ± SEM of five separate experiments. (E) Cells were treated as in (A) and then cell lysates were analysed for cleaved caspase 9 (cleav casp 9) and procaspase 9 (procasp 9) by western blots. Values are the mean ± SEM of five separate experiments. *P < 0.05 versus vehicle; # P < 0.05 by ANOVA followed by Newman–Keuls post hoc test.
In SH‐SY5Y cells, IFN‐β enhances cytochrome c release from mitochondria, consistent with the activation of the intrinsic mitochondrial apoptotic pathway (Dedoni et al., 2010, 2014a). CCh (10 μM) significantly inhibited the increase in cytosolic cytochrome c levels elicited by IFN‐β (Figure 1D), indicating that it counteracted the cytokine‐induced apoptosis by opposing the alteration of mitochondrial permeability.
Cytochrome c release triggers apoptosis by activating procaspase 9, which then activates the executioner caspases 3 and 7. As shown in Figure 1E, CCh (10 μM) inhibited the activation of procaspase 9 stimulated by IFN‐β, as indicated by the reduced formation of the cleaved/active caspase 9 form. Immunofluorescence analysis showed that CCh reduced the increase in the number of cleaved caspase 3‐positive cells induced by IFN‐β (Figure 2A). Moreover, a significant inhibition of IFN‐β‐stimulated caspase 3/7 activity was detected in lysates of cells co‐treated with CCh (Figure 2B). In SH‐SY5Y cells, IFN‐β increases DNA fragmentation, which is considered as a hallmark of apoptosis (Dedoni et al., 2010, 2014a). In situ TUNEL assays showed that the cytokine‐induced increase of cell nuclei displaying DNA fragmentation was significantly attenuated by CCh (Figure 2C).
Figure 2.

Suppression of IFN‐β‐induced caspase cascade by stimulation of mAChRs. (A) SH‐SY5Y cells were treated with either vehicle,10 μM CCh, IFN‐β (30 ng·mL−1) or CCh + IFN‐β for 24 h. The expression of cleaved caspase 3 (green colour) was determined by immunofluorescence. Cell nuclei were stained with DAPI (blue colour). Values are the mean ± SEM of five independent experiments. Bar = 100 μm. (B) Cells were treated as indicated in (A) and caspase 3/7 activity was measured in cell extracts by a luminescence assay. Values are the mean ± SEM of six separate experiments. (C) Cells were treated as in (A) and DNA fragmentation was detected by using an in situ fluorimetric TUNEL assay. The green colour indicates the fragmented DNA. Nuclei are stained in blue with DAPI. Values are expressed as percent of positive nuclei and are the mean ± SEM of five separate experiments. Bar = 50 μm. (D) Cells were treated as in (A) and cell lysates were analysed for cleaved PARP (cleav PARP) and PARP levels by western blots. Values are expressed as % of the effect induced by IFN‐β alone and are the mean ± SEM of five independent experiments. (E) Cells were treated for 24 h with either vehicle or IFN‐β (30 ng·mL−1) alone and in combination with the indicated concentrations of CCh. Cell extracts were analysed for cleaved PARP and PARP by western blots. Values are the mean ± SEM of five independent experiments. (F, G) Cells were incubated for 24 h with either vehicle, 30 μM oxotremorine‐M (Oxo‐M), 1 mM pilocarpine (pilocar), 30 ng·mL−1 IFN‐β or the combination of each mAChR agonist with IFN‐β. Cleaved PARP and PARP levels were determined in cell lysates by western blots. Values are the mean ± SEM of five independent experiments. (H) RA‐differentiated SH‐SY5Y cells were treated for 10 min with vehicle, 10 μM eserine (eser) or eserine plus 100 nM atropine (atrop) and then incubated for 24 h with either vehicle or IFN‐β (30 ng·mL−1). Cleaved PARP and PARP levels were determined in cell lysates by western blots. Values are the mean ± SEM of five independent experiments. *P < 0.05 versus control (vehicle only); # P < 0.05 by ANOVA followed by Newman–Keuls post hoc test.
The proteolytic cleavage of PARP, a DNA repair enzyme and a main downstream target of activated caspases 3 and 7, is stimulated by prolonged exposure of SH‐SY5Y cells to IFN‐β (Dedoni et al., 2010, 2014a). IFN‐β‐induced PARP cleavage was suppressed by the pan‐caspase inhibitor Z‐VAD‐FMK (50 μM) (results not shown), indicating that it was a reliable marker of caspase activation. Co‐treatment with CCh (10 μM) inhibited the cytokine‐induced proteolytic degradation of PARP (116 kDa) into the cleaved fragment (89 kDa) (Figure 2D). The inhibitory effect of CCh was concentration‐dependent, displaying an IC50 value of 0.442 ± 0.07 μM (n = 5) (Figure 2E), and was mimicked by the mAChRs agonists Oxo‐M (30 μM) and pilocarpine (1 mM) (Figure 2F,G). Moreover, in RA‐differentiated SH‐SY5Y cells, which express higher levels of choline acetyltransferase than undifferentiated cells (Adem et al., 1987), the AChE inhibitor eserine (10 μM) decreased basal and IFN‐β‐stimulated PARP cleavage, and this effect was blocked by atropine (100 nM) (Figure 2H).
The M3 receptor mediates CCh protection of SH‐SY5Y cells
In SH‐SY5Y cells, CCh inhibition of IFN‐β‐induced PARP cleavage was completely blocked by the non‐selective mACh receptor antagonist atropine (100 nM) and the M3 receptor‐preferring antagonist darifenacin (1 μM) (Figure 3A, B), whereas the selective M1 receptor antagonist MT‐7 (30 nM) (Olianas et al., 2000), the M2 receptor preferring antagonist methoctramine (1 μM) (Caulfield and Birdsall, 1998) and the M4 receptor preferring antagonist MT‐3 (100 nM) (Onali and Olianas, 2002) were without effect (Figure 3C‐E). Cell treatment with M3 receptor siRNA, which reduced M3 receptor protein levels by 62 ± 5% as compared with control siRNA‐treated cells (n = 6, P < 0.05 by Student's t test) (Figure S1), completely prevented the inhibition of PARP cleavage elicited by a submaximal concentration (0.2 μM) of CCh (Figure 3F). Collectively, the results indicate that in SH‐SY5Y cells M3 receptor mediated CCh protection from IFN‐β‐induced apoptosis.
Figure 3.

Cells were pre‐incubated for 30 min in the presence of either vehicle or 100 nM atropine (A), 1 μM darifenacin (Darifen) (B), 30 nM MT‐7 (C), 1 μM methoctramine (Methoctr) (D), and 100 nM MT‐3 (E) and then exposed for 24 h to either IFN‐β (30 ng·mL−1) or IFN‐β plus 10 μM CCh. Cell extracts were analysed for cleaved PARP and PARP by Western blot. Values are expressed as % of the effect induced by IFN‐β + vehicle and are the mean ± SEM of five independent experiments. (F) Cells were treated with either control or M3 receptor siRNA and then incubated for 24 h with either vehicle, 30 ng·mL−1 IFN‐β or IFN‐β plus 0.2 μM CCh. Cell lysates were analysed for cleaved PARP and PARP. Values are expressed as % of IFN‐β stimulation in control siRNA‐treated cells and are the mean ± SEM of six separate experiments. # P < 0.05 by ANOVA followed by Newman–Keuls post hoc test.
Effects of CCh on IFN‐β‐induced JAK–STAT signalling in SH‐SY5Y cells
Activation of JAK‐STAT signalling, which follows cytokine binding to its receptor (Borden et al., 2007), is required for IFN‐β‐induced apoptosis of SH‐SY5Y cells (Dedoni et al., 2010). Pretreatment with CCh (10 μM) had no effect on IFN‐β‐induced phosphorylation of the JAK Tyk2 (Figure 4A). Similarly, CCh failed to affect IFN‐β‐stimulated STAT1 phosphorylation at Tyr701, which is necessary for STAT1 activation (Figure 4A), and induction of STAT1 and PKR (Figure 4B, C), which plays an important role in type I IFNs antiviral (Borden et al., 2007) and pro‐apoptotic (Dedoni et al., 2010) activities. In cells, undergoing apoptosis cleavage of PKR by caspase 3 has been demonstrated to generate an active PKR catalytic fragment of ~40 kDa (Saelens et al., 2001). As shown in Figure 4D, in SH‐SY5Y cells, IFN‐β induced a robust increase in the formation of the 40 kDa PKR fragment, indicating a possible activation of the enzyme through caspase 3. Consistent with the inhibition of caspase 3, CCh suppressed IFN‐β‐induced PKR cleavage, and this effect was completely prevented by either atropine (Figure 4D), or darifenacin (Figure S2). As previously reported (Dedoni et al., 2010), IFN‐β increased the expression level and proteolytic cleavage of procaspase 7 (Figure 4E). CCh had no effect on procaspase 7 induction, but markedly suppressed the formation of the active caspase 7 fragment. Addition of CCh (10 μM) to cells pre‐exposed to IFN‐β for 2 h, a time sufficient to allow STAT‐dependent gene transcription, inhibited IFN‐β‐induced PARP cleavage to an extent equal to that observed when CCh was added just before the cytokine (Figure 4F). Collectively, these data indicate that mACh receptor stimulation did not impair IFN‐β activation of JAK–STAT signalling.
Figure 4.
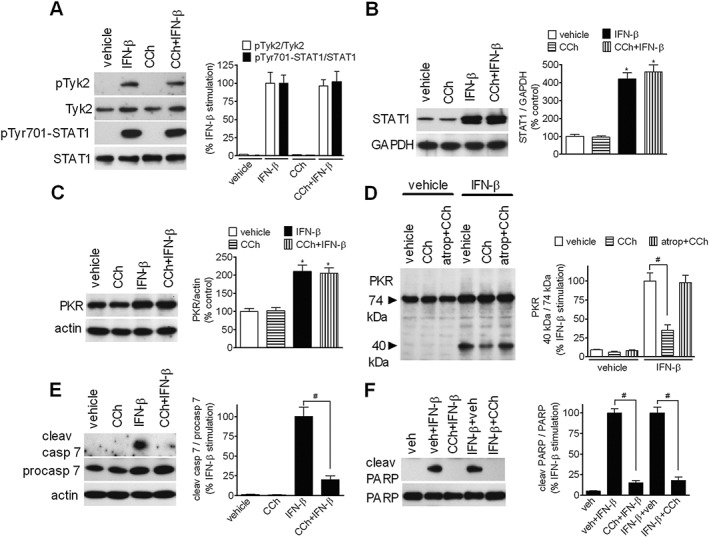
Effects of CCh on IFN‐β activation of JAK–STAT signalling. (A) SH‐SY5Y cells were serum‐starved for 24 h, exposed to either vehicle or 10 μM CCh for 30 min and then treated with either vehicle or 30 ng·mL−1 IFN‐β for additional 30 min. Cell lysates were analysed for phospho‐Tyk2 (pTyk2), Tyk2, phospho‐Tyr701‐STAT1 (pTyr701‐STAT1), and STAT1 by Western blot. Values are expressed as % of the effect induced by IFN‐β alone and are the mean ± SEM of five independent experiments. (B, C) Cells were incubated for 24 h in the presence of vehicle, 10 μM CCh, 30 ng·mL−1 IFN‐β or CCh plus IFN‐β. The levels of STAT1 and PKR were determined by Western blots and normalized to the levels of GAPDH and actin, respectively. Values are the mean ± SEM of five independent experiments. (D) Cells were incubated in serum‐free medium for 10 min in the presence of either vehicle, 10 μM CCh or CCh plus 100 nM atropine and the exposed for 24 h to either vehicle or IFN‐β (30 ng·mL−1). Cell lysates were analysed for 74 kDa and 40 kDa PKR immunoreactive bands by Western blots. The densitometric ratio of 40 kDa / 74 kDa bands is presented as % of the stimulation induced by IFN‐β alone. Values are the mean ± SEM of five independent experiments. (E) Cells were treated as described in (B, C) and the levels of cleaved caspase 7, procaspase 7 and actin were determined by Western blot analyses. Values are the mean ± SEM of five independent experiments. (F) Cells were incubated in serum‐free medium with either vehicle (veh) or 30 ng·mL−1 IFN‐β for 24 h. Vehicle or 10 μM CCh was added either concomitantly with IFN‐β (veh + IFN‐β, CCh + IFN‐β) or 2 h after the addition of IFN‐β (IFN‐β + veh, IFN‐β + CCh). Values are the mean ± SEM of five independent experiments. *P < 0.05 vs control (vehicle); # P < 0.05 by ANOVA followed by Newman–Keuls post hoc test.
Role of Gq/11, protein kinase C and EGFR transactivation in M3 receptor‐induced anti‐apoptotic effect
Pre‐treatment of SH‐SY5Y cells with the Gαq/11 inhibitor YM‐254 890 (10 μM) (Takasaki et al., 2004) prevented CCh‐induced stimulation of ERK1/2 (Figure 5A) and almost completely attenuated the inhibition of IFN‐β‐induced PARP cleavage (Figure 5B). Cell transfection with Gαq Q209L, a constitutively active form of Gαq, failed to stimulate ERK1/2 phosphorylation and had no effect on IFN‐β‐induced PARP cleavage (Figure S3).
Figure 5.

The anti‐apoptotic activity of mACh receptors involves Gq/11 and PKC, and is independent of EGFR transactivation. (A) Serum‐starved SH‐SY5Y cells were pre‐incubated for 30 min with either vehicle or 10 μM YM‐254 890 (YM) and then treated for 10 min with either vehicle or 10 μM CCh. Cell lysates were analysed for phospho‐ERK1/2 and ERK1/2. Values are the mean ± SEM of five separate experiments. (B) Cells were incubated for 30 min with either vehicle or 10 μM YM‐254 890 and then treated with vehicle, 30 ng·mL−1 IFN‐β or 10 μM CCh + IFN‐β for 24 h. Levels of cleaved PARP and PARP were determined in cell lysates. Values are the mean ± SEM of five independent experiments. (C) Cells were incubated with 10 μM CCh for the indicated periods of time and the levels of phospho‐MARCKS (pMARCKS) and MARCKS determined in cell lysates. Values are the mean ± SEM of five independent experiments. (D, E) Serum‐starved cells were pre‐incubated for 60 min with either vehicle or 1 μM Go 6983 and then exposed to either vehicle or 10 μM CCh for 10 min. Cell lysates were analysed for pMARCKS and pERK1/2. Values are the mean ± SEM of five separate experiments. (F) Cells were pretreated with either vehicle or 1 μM Go 6983 for 30 min and then incubated with either vehicle, 30 ng·mL−1 IFN‐β or 10 μM CCh + IFN‐β for 24 h. Values are the mean ± SEM of five independent experiments. (G) Cells serum‐starved for 24 h were pretreated for 30 min with either vehicle or 250 nM AG 1478 and then exposed to either vehicle, 10 μM CCh or 50 ng·mL−1 hEGF for 10 min. Values are the mean ± SEM of five independent experiments. (H) Cells were pretreated as in (G) and then incubated in the presence of 30 ng·mL−1 IFN‐β or 10 μM CCh + IFN‐β for 24 h. Values are the mean ± SEM of five independent experiments. *P < 0.05 versus zero time; # P < 0.05 by ANOVA followed by Newman–Keuls post hoc test.
PKC regulates a vast array of intracellular events, including the pro‐survival Ras–Raf‐MEK1/2‐ERK1/2 pathway (Kang, 2014). CCh induced a rapid and long‐lasting increase in the phosphorylation of MARCKS, a main cellular substrate of several members of the PKC family (Herget et al., 1995) (Figure 5C). This effect was completely blocked by the broad spectrum PKC inhibitor Go6983 (1 μM) (Figure 5D). Go6983 also reduced the stimulation of ERK1/2 phosphorylation and the inhibition of IFN‐β‐induced PARP cleavage elicited by CCh (Figure 5E, F).
GPCRs, including mAChRs, have been reported to induce ERK1/2 stimulation through transactivation of the EGFR (Wetzker and Bohmer, 2003). Acute treatment of SH‐SY5Y cells with hEGF (50 ng·mL−1) induced a robust activation of ERK1/2, which was completely blocked by the EGFR tyrosine kinase inhibitor AG 1478 (250 nM) (Figure 5G). This inhibitor, however, had no effect on CCh‐induced ERK1/2 stimulation and suppression of IFN‐β‐stimulated PARP cleavage (Figure 5H), indicating that in SH‐SY5Y cells M3 receptors activate ERK1/2 and inhibit IFN‐β‐induced apoptosis independently of EGFR transactivation.
M3 receptors regulate multiple signalling pathways controlling cell survival
Besides ERK1/2, M3 receptors regulate a broad range of signalling pathways affecting cell survival, including p38 MAPK and JNK. As shown in Figure 6A, B and C, in SH‐SY5Y cells CCh (10 μM) induced a prolonged increment in the phosphorylation/activation of ERK1/2, p38 MAPK and JNK, which lasted for at least 24 h. Consistent with previous observations (King et al., 2006; Olianas et al. 2014), CCh also triggered a robust and persistent increment in the phosphorylation/activation of the cellular energy sensor AMPK, a relevant regulator of neuronal apoptosis (Ronnett et al., 2009) (Figure 6D).
Figure 6.

Time‐dependent regulation of ERK1/2, p38 MAPK, JNK, and AMPK phosphorylation by CCh. Cells were incubated with 10 μM CCh for the indicated periods of time. Zero time samples were treated with vehicle. Thereafter, cell lysates were then analysed for phospho‐ERK1/2, ERK1/2, phospho‐p38 MAPK (pp38), p38 MAPK (p38), phospho‐JNK (p‐JNK), JNK, phospho‐AMPK (pAMPK) and AMPK. Values are the mean ± SEM of five independent experiments. *P < 0.001 versus zero time by ANOVA followed by Newman–Keuls post hoc test.
Involvement of ERK1/2 in M3 receptor anti‐apoptotic activity
We next examined the contribution of the distinct MAPK signalling pathways to the anti‐apoptotic effects of M3 receptors by using selective pharmacological inhibitors. In SH‐SY5Y cells, blockade of ERK1/2 by the MEK1/2 inhibitor PD98059 (25 μM) counteracted the CCh inhibition of IFN‐β‐induced PARP cleavage (Figure 7A). U0126 (0.5 μM), another selective MEK1/2 inhibitor, enhanced IFN‐β‐induced procaspase 7 activation, and PARP cleavage and almost completely antagonized the CCh inhibitory responses (Figure 7B, C). Cell transfection with HA‐ERK2 (Figure S4) potentiated the inhibition of IFN‐β‐induced PARP cleavage by submaximal CCh concentrations (Figure 7D), whereas expression of ERK2‐CA (Figure S4) mimicked the inhibitory effect of CCh (Figure 7E). Blockade of p38 MAPK with the selective inhibitors BIRB 0796 and VX745 (Bain et al., 2007; Duffy et al., 2011), used at concentrations that effectively blocked CCh‐induced phosphorylation of MK2 (Figure S5), a direct target of p38 MAPK, enhanced IFN‐β‐stimulated PARP cleavage but had no significant effect on the CCh inhibition (Figure 7F, G). The JNK inhibitor TCS JNK6o (10 μM), which is more than 1000 fold selective over other kinases including ERK2 and p38 MAPK (Szczepankiewicz et al., 2006), completely prevented CCh‐induced phosphorylation of the transcription factor c‐Jun at Ser63 (Figure 7H). This inhibitor was found to potentiate the CCh suppression of IFN‐β‐induced PARP cleavage (Figure 7I). The CCh stimulation of either JNK or ERK1/2 appeared to be mediated by M3 rather than M1 receptors, as it was inhibited by darifenacin but not MT‐7 (Figure S6). Blockade of AMPK activity with 10 μM Compound C, which inhibited CCh‐induced AMPK phosphorylation (Figure S7), increased basal and IFN‐β‐induced PARP cleavage, but did not affect the CCh anti‐apoptotic response (Figure 7J). Thus, the data indicate that activation of the ERK1/2 signalling pathway by CCh plays a major role in the protection from IFN‐β‐induced apoptosis, whereas the concomitant activation of JNK activity has opposite effects.
Figure 7.

Involvement of ERK1/2 in the protection from IFN‐β‐induced apoptosis mediated by mACh receptors. (A) Cells were incubated with either vehicle or 25 μM PD98059 for 60 min and then treated with either vehicle, 30 ng·mL−1 IFN‐β or 10 μM CCh + IFN‐β for 24 h. Values are expressed as % of the effect induced by IFN‐β + vehicle and are the mean ± SEM of five independent experiments. (B, C) Cells were incubated with either vehicle or 0.5 μM U0126 for 60 min and then treated as in (A). Thereafter, cell lysates were analysed for cleaved caspase 7 and cleaved PARP. Values are the mean ± SEM of five independent experiments. (D) Cells were transfected with either empty vector (vector) or pcDNA3‐HA‐ERK2 (ERK2) and then incubated with either vehicle, 0.1 μM CCh (CCh 0.1) or 0.3 μM CCh (CCh 0.3) in the presence of IFN‐β (30 ng·mL−1) for 24 h. Values are expressed as % of control (IFN‐β + vehicle in vector‐treated cells) and are the mean ± SEM of five separate experiments. *P < 0.05 versus control; # P < 0.05 versus the corresponding sample treated with empty vector by ANOVA followed by Newman–Keuls post hoc test. (E) Cells were transfected with either empty vector or the constitutively active ERK2 form (ERK2‐CA) and then exposed to either vehicle or IFN‐β (30 ng·mL−1) for 24 h. Values are expressed as % of IFN‐β stimulation in vector‐treated cells and are the mean ± SEM of five separate experiments. (F, G) Cells were pre‐incubated for 30 min with either vehicle, 5 μM VX745 (VX) or 1 μM BIRB0796 (BIRB) and then treated as indicated in (A). Values are the mean ± SEM of five separate experiments. (H) Cells were pre‐incubated for 60 min with either vehicle or 10 μM TCS JNK6o (TCS) and then treated with either vehicle or 10 μM CCh for 10 min. Cell lysates were then analysed for the levels of phospho‐c‐Jun and total c‐Jun. Values are expressed as % of control (vehicle) and are the mean ± SEM of five separate experiments. (I) Cells were pre‐incubated with either vehicle or 10 μM TCS JNK6o for 60 min and then treated for 24 h as indicated in (A). Values are the mean ± SEM of five separate experiments. (J) Cells were pre‐incubated with either vehicle or 10 μM Compound C for 30 min and then treated as in (A) for 24 h. Values are the mean ± SEM of five separate experiments. *P < 0.05 versus control (vehicle); # P < 0.05 by ANOVA followed by Newman–Keuls post hoc test.
M3 receptors regulate the phosphorylation and expression of Bcl‐2 proteins
ERK1/2 signalling exerts a pro‐survival action by regulating the phosphorylation and expression of several components of the cell death machinery, including the Bcl‐2 family members, which control mitochondrial permeability (Lu and Xu, 2006; Thomas et al., 2010). As shown in Figure 8A, in SH‐SY5Y cells CCh (10 μM) induced a rapid and prolonged increase in the phosphorylation of the pro‐apoptotic protein Bad at Ser112, which inhibits Bad binding to the anti‐apoptotic Bcl‐xL and Bcl‐2. With a similar kinetic profile, CCh stimulated the phosphorylation at Ser159/Thr163 of the anti‐apoptotic protein Mcl‐1 (Figure 8B), a Bcl‐2 family member which blocks the pro‐apoptotic proteins Bak and Bax (Thomas et al., 2010). The enhanced Mcl‐1 phosphorylation was associated with an increased expression of Mcl‐1, which was significant at 1 and 4 h of CCh treatment (Figure 8B). Mcl‐1 phosphorylation at Thr163 increases the protein stability against proteasomal degradation (Domina et al., 2004). CCh antagonized the decline of Mcl‐1 protein levels that occurred following protein synthesis inhibition with cycloheximide, indicating that CCh increased Mcl‐1 stability (Figure 8C). As previously reported (Itano et al., 1996), CCh increased the levels of the anti‐apoptotic protein Bcl‐2, an effect that became significant at 4 h and persisted for at least 24 h (Figure 8D). CCh‐induced phosphorylations of Bad and Mcl‐1 were reduced by cell pretreatment with either U0126 or PD98059 (Figure 8E, F). Conversely, blockade of p38 MAPK by VX745 had no effect, whereas inhibition of JNK by TCS JNK6o enhanced both responses (Figure 8G, H). Importantly, cell treatment with the JNK inhibitor markedly potentiated ERK1/2 phosphorylation by CCh (Figure 8I). Furthermore, cell treatment with U0126 (10 μM) significantly increased PARP cleavage, and this response was enhanced in cells co‐treated with CCh (Figure 8L). The addition of TCS JNK 6o inhibited U0126‐induced apoptosis and curtailed the potentiation by CCh. These data are consistent with the idea that concurrent stimulation of JNK by M3 receptors opposes the anti‐apoptotic action exerted via activation of ERK1/2 signalling.
Figure 8.

CCh regulates Mcl‐1 and Bad phosphorylation through ERK1/2. (A, B) Cells were treated with 10 μM CCh for the indicated periods of time and cell lysates were analysed for phospho‐Bad (pBad), total Bad, phospho‐Mcl‐1 (pMcl‐1), total Mcl‐1 and GAPDH. Values are expressed as % of control (zero time) and are the mean ± SEM of five separate experiments. *P < 0.05 versus the corresponding value at zero time. (C) Cells were treated with cycloheximide (cyclohex) (25 μg·mL−1) for the indicated periods of time in the presence of vehicle or 10 μM CCh. Zero time samples were treated with vehicle. The levels of Mcl‐1 in cell lysates were normalized to the levels of GAPDH. Values are expressed as % of the corresponding zero time value and are the mean ± SEM of five separate experiments. # P < 0.05 versus the corresponding value treated with vehicle. (D) Cells were treated with CCh as indicated in (A) and the levels of Bcl‐2 and actin were determined in cell lysates. Values are the mean ± SEM of five separate experiments. *P < 0.05 versus zero time. (E, F) Cells were pre‐incubated for 60 min with either vehicle, 0.5 μM U0126 or 25 μM PD 98059 (PD) and then treated with either vehicle or 10 μM CCh for 4 h. Values are the mean ± SEM of five separate experiments. *P < 0.05 versus vehicle; # P < 0.05, versus CCh alone. (G, H) Cells were pre‐incubated with either vehicle, 5 μM VX745 (VX) or 10 μM TCS JNK6o (TCS) for 60 min and then treated with either vehicle or 10 μM CCh for 4 h. Values are the mean ± SEM of five separate experiments. *P < 0.05 versus vehicle; # P < 0.05 versus CCh alone. (I) Cells were pre‐incubated with either vehicle or TCS JNK 6o for 60 min and then treated with either vehicle or 10 μM CCh for 4 h. Values are the mean ± SEM of five separate experiments. *P < 0.05 versus vehicle; # P < 0.05 versus CCh alone. (L) Cells were pre‐incubated with either vehicle, 10 μM U0126 or 10 μM TCS JNK6o + U0126 for 60 min and then treated with either vehicle or 10 μM CCh for 24 h. Values are the mean ± SEM of five separate experiments. # P < 0.05 versus U0126 + CCh by ANOVA followed by Newman–Keuls post hoc test.
IFN‐β enhances ERK1/2 stimulation and inhibits JNK activation by CCh
In SH‐SY5Y cells co‐treated with CCh and IFN‐β the levels of phospho‐ERK1/2, phospho‐Bad and phospho‐Mcl‐1 were higher than those induced by CCh alone (Figure 9A‐C). Per se, IFN‐β caused a small but significant increase in the phosphorylation state of ERK1/2, Bad and Mcl‐1. When the effects on JNK were examined, we found that IFN‐β inhibited basal JNK phosphorylation and suppressed the stimulatory effect of CCh (Figure 9D). These data indicate that IFN‐β differentially affected MAPK pathways to induce potentiation of ERK1/2 and inhibition of JNK in response to stimulation of mAChRs.
Figure 9.
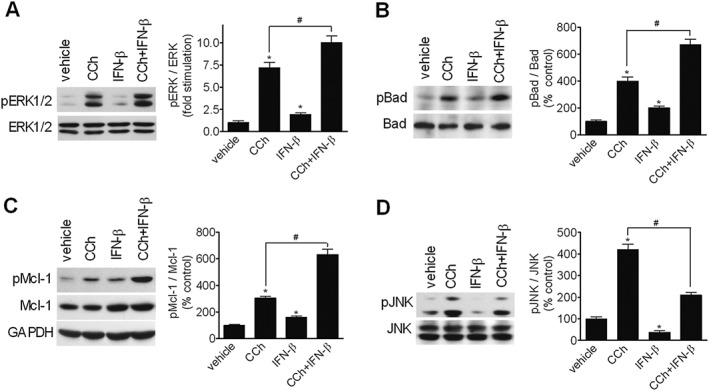
IFN‐β enhances ERK1/2 stimulation and inhibits JNK activation by CCh. Cells were treated for either 6 (A‐C) or 12 h (D) with vehicle, 10 μM CCh, 30 ng · mL−1 IFN‐β or CCh + IFN‐β. Values are the mean ± SEM of five independent experiments. *P < 0.05 vs control (vehicle); # P < 0.05 by ANOVA followed by Newman–Keuls post hoc test.
Stimulation of mAChRs inhibits IFN‐β‐induced expression of cleaved caspase 3 in mouse primary hippocampal neurons
Primary mouse hippocampal cells cultured in vitro for 6–8 days comprised numerous small neurons with short neurites, and sparse large neurons with long neurites and intense NF staining, which resembled pyramidal cells (Figure 10). Exposure to mouse IFN‐β (30 ng·mL−1) induced a significant increase in the percentage of cleaved caspase 3‐positive cells, and this effect was prevented by co‐treatment with Oxo‐M (30 μM) (Figure 10A, B). MT‐7 (30 nM) and darifenacin (1 μM) abolished the protective effect of Oxo‐M (Figure 10A). Moreover, blockade of ERK1/2 pathway with U0126 (0.5 μM) prevented the effect of Oxo‐M (Figure 10B).
Figure 10.

Stimulation of mACh receptors inhibits IFN‐β‐induced apoptosis of mouse primary hippocampal neurons. (A) Hippocampal neurons were incubated in Neurobasal medium without B27 supplement in the presence of either vehicle, MT‐7 (30 nM) or darifenacin (Darifen) (1 μM) for 10 min and then exposed to either vehicle, Oxo‐M (30 μM), mouse IFN‐β (30 ng · mL−1) , or the combination of Oxo‐M + IFN‐β for 24 h. Thereafter, cells were analysed for cleaved caspase 3 (green colour) and NF (red colour) by immunofluorescence. Cell nuclei were stained with DAPI (blue colour). Values are the mean ± SEM of five independent experiments. Bar = 100 μm. (B) Hippocampal neurons were incubated as in (A) in the presence of either vehicle or U0126 (0.5 μM) for 1 h and then exposed to either vehicle, mouse IFN‐β (30 ng · mL−1) or Oxo‐M (30 μM) + IFN‐β for 24 h. Thereafter, cells were stained and analysed as in (A). Values are the mean ± SEM of five independent experiments. Bar = 100 μm. *P < 0.05 versus vehicle, # P < 0.05 by ANOVA followed by Newman–Keuls post hoc test.
Discussion
Although there is evidence that type I IFNs are involved in the pathogenesis of different neuroinflammatory and neurodegenerative diseases, there is limited knowledge on pharmacological interventions that can prevent or lessen the neuronal damage produced by these cytokines. To identify druggable receptor systems that could counteract type I IFNs’ neurotoxicity, we employed neuroblastoma SH‐SY5Y cells and mouse primary neurons, which express functional IFN receptors and undergo apoptotic cell death upon exposure to type I IFNs (Dedoni et al., 2010, 2014b). We found that in both cell systems, activation of mAChRs provided a strong protection from IFN‐β‐induced apoptosis. In SH‐SY5Y cells, M3 receptor anti‐apoptotic activity was associated with suppression of the cytokine‐induced cytochrome c release from mitochondria and consequent activation of caspase cascade, PARP cleavage and DNA fragmentation. The anti‐apoptotic signal generated by M3 receptor stimulation was dependent on the activation of the ERK1/2 pathway and the downstream regulation of Bcl‐2 family proteins controlling mitochondrial membrane stability.
The finding that in SH‐SY5Y cells the anti‐apoptotic effect of CCh was mediated by M3 receptors agrees with previous studies demonstrating that these cells predominantly express M3 receptors with much lower levels of the M1 and M2 subtypes (Lambert et al., 1989; Wall et al., 1991).
The Gαq/11 antagonist YM‐254 890 blocked M3 receptor‐induced stimulation of ERK1/2 phosphorylation and inhibition of IFN‐β‐induced apoptosis, thus implying the involvement of Gq/11. This compound has been shown to stabilize the GDP‐bound inactive form of Gαq (Nishimura et al., 2010) and to block [35S]‐GTPγS binding to Gαq stimulated by M1 receptors (Takasaki et al., 2004). On the other hand, the expression of Gαq Q209L did not mimic the effects elicited by CCh, a result apparently in contrast with the involvement of Gq/11. However, this finding is in line with previous studies showing that expression of Gαq Q209L failed to stimulate ERK1/2 (Quian et al., 1993; Crespo et al., 1994). It has been demonstrated that G protein βγ subunits can mediate ERK1/2 stimulation by GPCRs, including mAChRs, thus providing a likely explanation of the inability of Gαq Q209L to activate ERK1/2 (Crespo et al., 1994). One possibility, that remains to be investigated, is that in SH‐SY5Y cells blockade of Gq/11 activation by YM‐254 890 impairs the release of βγ subunits, thus inhibiting the coupling of M3 receptors to ERK1/2.
In SH‐SY5Y cells, M3 receptors protected from IFN‐β‐induced apoptosis without affecting the cytokines’ ability to activate JAK–STAT signalling, as indicated by the lack of effects on Tyk2 and STAT1 phosphorylation and induction of IFN‐regulated genes, such as STAT1, PKR and procaspase 7. Moreover, CCh elicited a substantial anti‐apoptotic response when added after IFN‐β had sufficient time to trigger STAT‐dependent gene transcription. The failure of mAChRs’ stimulation to impair IFN‐β‐stimulated JAK–STAT activation cells may constitute a favourable property; as in neurons, this signalling pathway is required for IFN‐induced expression of a variety of antiviral genes (Wang and Campbell, 2005). Moreover, STAT1 deficiency has been shown to be associated with exacerbation of the neurological damage induced by excessive formation of IFN‐α (Wang et al., 2002).
The results obtained with pharmacological inhibition of MEK1/2, cell transfection with ERK2 and expression of ERK2‐CA pointed out that ERK1/2 was a critical mediator of receptor anti‐apoptotic activity. In SH‐SY5Y cells, M3 receptors induced a long‐lasting increase in ERK1/2 activity and Bcl‐2 expression, ERK1/2‐dependent phosphorylation/inactivation of Bad and phosphorylation/stabilization of Mcl‐1. The altered balance between pro‐ and anti‐apoptotic Bcl‐2 proteins elicited by ERK1/2 is likely to be responsible for the inhibition of mitochondrial permeabilization and cytocrome c release associated with IFN‐β‐induced apoptosis. The involvement of ERK1/2 signalling in the anti‐apoptotic action of M3 receptors is consistent with the known role of ERK1/2 in promoting cell survival (Xia et al., 1995; Lu and Xu, 2006) and with the observation that in serum‐deprived SK‐N‐SH neuroblastoma cells M3 receptors increase cell viability in an ERK1/2‐dependent manner (Greenwood and Dragunow, 2010). However, other studies in different cell types have reported that heterologously expressed M1 or M3 receptors protect from apoptosis induced by serum deprivation or the DNA‐damaging agent etoposide independently of ERK1/2 (Leloup et al., 2000; Budd et al., 2004). Moreover, in SH‐SY5Y cells, Oxo‐M has been shown to protect from hydrogen peroxide‐ and camptothecin‐induced apoptosis through a mechanism that was blocked by the Rho kinase inhibitor HA‐1077, but insensitive to Go6983 (De Sarno et al., 2005). A possible explanation for this discrepancy is that mAChRs counteract different pro‐apoptotic insults by regulating distinct signalling pathways.
An important finding of the present study is that in SH‐SY5Y cells, M3 receptors not only exert an anti‐apoptotic action through ERK1/2, but also generate a pro‐apoptotic signal via JNK. ERK1/2 and JNK have been shown to exert opposing effects on apoptosis and activation of JNK is known to mediate stress‐induced cell death in a variety of cell types (Xia et al., 1995; Waetzig and Herdegen, 2005). We found that, concurrently to ERK1/2 activation, CCh elicited a robust and long‐lasting stimulation of JNK. This effect was accompanied by JNK‐dependent phosphorylation of c‐Jun at Ser63, which activates c‐Jun transcriptional activity and is required for c‐Jun pro‐apoptotic action in neuronal cells (Watson et al., 1998). JNK inhibition by TCS JNK6o potentiated CCh suppression of IFN‐β‐induced apoptosis, indicating that concomitant JNK activation opposed the pro‐survival effect. Moreover, CCh enhanced PARP cleavage induced by blockade of ERK1/2 signalling and this effect was prevented by JNK inhibition. While these findings indicate that M3 receptors can generate opposing signals on cell survival, the anti‐apoptotic outcome indicates that activation of the ERK1/2 pathway overrides the JNK‐induced death signalling.
In addition to JAK–STAT signalling, type I IFNs activate ancillary pathways which participate in orchestrating the cellular responses to these cytokines (Borden et al. 2007). In SH‐SY5Y cells, IFN‐β causes a delayed activation of p38 MAPK which counter‐regulates its pro‐apoptotic activity (Dedoni et al., 2014a). In the present study, we found that blockade of p38 MAPK had no significant effects on the anti‐apoptotic activity of CCh, although it enhanced IFN‐β‐induced PARP cleavage. On the other hand, consistent with a previous observation (Dedoni et al., 2012), IFN‐β enhanced ERK1/2 activation elicited by CCh. In addition, IFN‐β per se increased ERK1/2 signalling, while inhibiting basal and CCh‐induced JNK phosphorylation. Although it is not yet understood how IFN‐β differentially regulates ERK1/2 and JNK, it is possible that these responses are part of a counter‐regulatory loop activated by the cytokine to attenuate or delay neuronal cell death. These counter‐regulatory mechanisms establish a favourable interaction with M3 receptor signalling by amplifying ERK1/2 and attenuating JNK activation.
In mouse primary hippocampal neurons, Oxo‐M prevented the increase of cleaved caspase 3 induced by IFN‐β, indicating that mAChRs protect from the cytokine‐induced apoptosis in this neuronal model. As observed in SH‐SY5Y cells, inhibition of ERK1/2 abrogated Oxo‐M protection, suggesting that the activity of this pathway is required for the action of mAChRs also in hippocampal neurons. In this cell system, both MT‐7 and darifenacin prevented the anti‐apoptotic effect of Oxo‐M, implying the participation of M1 receptors. This finding is consistent with a previous study showing that M1 receptors activate ERK1/2 in CA1 pyramidal neurons in mouse hippocampal slices (Berkeley et al., 2001).
Stimulation of mAChRs has been shown to protect from cell death induced by a number of exogenous chemical agents. To our knowledge, the present study is the first to demonstrate that mAChRs coupled to ERK1/2 signalling can counteract neuronal apoptosis induced by pro‐inflammatory cytokines such as type I IFNs. Although the neuropathological implications of our findings remain to be defined, it is noteworthy that the administration of mAChR agonists and AChE inhibitors can improve symptoms and exert neuroprotective effects in Alzheimer’ s disease (Bodick et al., 1997; Francis et al., 2005; Caccamo et al., 2006), a pathology in which type I IFNs may promote neuroinflammation and neuronal death (Yamada et al., 1994; Taylor et al., 2014). IFN‐β is generally used as a safe and efficacious drug to treat MS. However, this cytokine may exacerbate MS in a subtype of patients (Axtell et al., 2011) and induce neuropsychiatric disturbances (Fragoso et al., 2010). The present study suggests that pharmacological interventions that stimulate ERK1/2‐coupled mAChRs may be beneficial in controlling the neurotoxic consequences of an abnormal type I IFNs’ activity in the brain.
Author contributions
M.C.O. and P.O. designed the research study and wrote the manuscript. M.C.O. and S.D. performed the experiments and analysed the data. M.C.O., S.D. and P.O. contributed to the discussion and review of the manuscript. All authors read and approved the final manuscript.
Conflict of interest
The authors declare no conflicts of interest.
Declaration of transparency and scientific rigour
This Declaration acknowledges that this paper adheres to the principles for transparent reporting and scientific rigour of preclinical research recommended by funding agencies, publishers and other organisations engaged with supporting research.
Supporting information
Figure S1 Down‐regulation of M3 mAChRs expression by siRNA treatment of SHSY5Y cells. Cells were transfected with either control siRNA or M3 mAChRs siRNA and analysed for M3 mAChRs and actin expression 48 h post‐transfection. Immunoblots are from one experiment representative of six independent experiments. The migration of molecular mass standard is indicated by the arrows.
Figure S2 Darifenacin prevents the CCh inhibition of IFN‐β‐induced PKR cleavage. SH‐SY5Y cells were incubated in serum‐free medium for 10 min in the presence of either vehicle, 10 μM CCh or CCh plus 1 μM darifenacin (Darifen) and then exposed for 24 h to either vehicle or IFN‐β (30 ng ml‐1). Cell lysates were analysed for 74 kDa and 40 kDa PKR immunoreactive bands by Western blot. The densitometric ratio of 40 kDa / 74 kDa bands is reported as percent of the stimulation induced by IFN‐β alone. Values are the mean ± SEM of five independent experiments. # P < 0.05 by ANOVA followed by Newman–Keuls post hoc test.
Figure S3 Effects of Gαq Q209L on ERK1/2 phosphorylation and IFN‐β‐induced PARP cleavage. SH‐SY5Y cells were transfected with either empty vector or pcDNA3‐Gαq Q209L (GαqQ209L) and analysed for Gαq/11 expression and ERK1/2 phosphorylation 48 h post‐transfection (A).Values are expressed as percent of control (empty vector) and are the mean ± SEM of five independent experiments. * P < 0.05 vs control by Student's t test. (B) SH‐SY5Y cells were transfected with either empty vector or pcDNA3‐Gαq Q209L (GαqQ209L). Forty‐eight hours post‐transfection cells were incubated with either vehicle or IFN‐β (30 ng ml‐1) for 24 h. Cell lysates were analysed for cleaved PARP (cleav PARP) and PARP by Western blot. Values are the mean ± SEM of five independent experiments. * P < 0.05 vs vehicle by ANOVA followed by Newman–Keuls post hoc test.
Figure S4 Over‐expression of ERK2‐L4 A‐MEK1 fusion protein and HA‐ERK2 in SHSY5Y cells. (A) Cells were transfected with either empty vector or ERK2‐L4 A‐MEK1 fusion protein (ERK2‐CA) and 48 h post‐transfection cell lysates were analysed for the expression of the fusion protein, migrating with an apparent molecular mass of ~100 kDa, by Western blot using an antibody that recognizes dually phosphorylated ERK1/2. (B) Cells were transfected with either empty vector or HA‐ERK2 and 48 h post‐transfection cell lysates were analysed for the expression of HA‐ERK2, migrating with an apparent molecular mass of 43 kDa, with either an anti‐ERK1/2 antibody (upper panel) or anti‐HA antibody (lower panel). Immunoblots are from one experiment representative of five independent experiments.
Figure S5 Inhibition of MK‐2 phosphorylation by BIRB0796 and VX745. Serumstarved SH‐SY5Y cells were pre‐incubated for 60 min with either vehicle, 1 μM BIRB 0796 (BIRB) or 5 μM VX745 (VX) and then treated with either vehicle or 10 μM CCh for 10 min. The levels of phospho‐MK2 (p‐MK2) and total MK2 were determined in cell lysates by Western blot. Values are the mean ± SEM of five experiments.
Figure S6 Blockade of CCh‐induced JNK and ERK1/2 phosphorylations by darifenacin but not MT‐7. Serum‐starved SH‐SY5Y cells were pre‐incubated for 10 min with either vehicle, 30 nM MT‐7 or 1 μM darifenacin (Darifen) and then exposed to either vehicle or 10 μM CCh for 10 min. Cell lysates were analysed for phospho‐JNK (p‐JNK), total JNK, phospho‐ERK1/2 and ERK1/2 by Western blot. Values are the mean ± SEM of five independent experiments. * P < 0.05 vs vehicle; # P < 0.05 vs CCh alone by ANOVA followed by Newman–Keuls post hoc test.
Figure S7 Cell treatment with Compound C prevents CCh‐induced AMPK phosphorylation. Cells were pre‐incubated with either vehicle or 10 μM Compound C (Comp C) for 30 min and then treated with either vehicle or 10 μM CCh for 5 min. Values are the mean of five experiments. * P < 0.05 vs vehicle, # P < 0.05 by ANOVA followed by Newman–Keuls post hoc test.
Supporting info item
Supporting info item
Supporting info item
Supporting info item
Supporting info item
Supporting info item
Supporting info item
Supporting info item
Acknowledgements
The study was supported by Regione Autonoma della Sardegna, L.R. n.7/2007‐ CRP 10810/2012.
Olianas, M. C. , Dedoni, S. , and Onali, P. (2016) Protection from interferon‐β‐induced neuronal apoptosis through stimulation of muscarinic acetylcholine receptors coupled to ERK1/2 activation. British Journal of Pharmacology, 173: 2910–2928. doi: 10.1111/bph.13570.
References
- Adem A, Mattsson ME, Nordberg A, Pahlman S (1987). Muscarinic receptors in human SH‐SY5Y neuroblastoma cell line: regulation by phorbol ester and retinoic acid‐induced differentiation. Brain Res 430: 235–242. [DOI] [PubMed] [Google Scholar]
- Alexander SPH, Davenport AP, Kelly E, Marrion N, Peters JA, Benson HE et al. (2015a). The concise guide to PHARMACOLOGY 2015/16: G protein coupled receptors. Br J Pharmacol 172: 5744–5869. [DOI] [PMC free article] [PubMed] [Google Scholar]
- Alexander SPH, Fabbro D, Kelly E, Marrion N, Peters JA, Benson HE et al. (2015b). The concise guide to PHARMACOLOGY 2015/16: Catalytic receptors. Br J Pharmacol 172: 5979–6023. [DOI] [PMC free article] [PubMed] [Google Scholar]
- Alexander SPH, Kelly E, Marrion N, Peters JA, Benson HE, Faccenda E et al. (2015c). The concise guide to PHARMACOLOGY 2015/16: overview. Br J Pharmacol 172: 5729–5743. [DOI] [PMC free article] [PubMed] [Google Scholar]
- Alexander SPH, Fabbro D, Kelly E, Marrion N, Peters JA, Benson HE et al. (2015d). The concise guide to PHARMACOLOGY 2015/16: enzymes. Br J Pharmacol 172: 6024–6109. [DOI] [PMC free article] [PubMed] [Google Scholar]
- Axtell RC, Raman C, Steinman L (2011). Interferon‐β exacerbates Th17‐mediated inflammatory disease. Trends Immunol 32: 272–277. [DOI] [PMC free article] [PubMed] [Google Scholar]
- Bain J, Plater L, Elliott M, Shpiro N, Hastie CJ, McLauchlan H et al. (2007). The selectivity of protein kinase inhibitors: a further update. Biochem J 408: 297–315. [DOI] [PMC free article] [PubMed] [Google Scholar]
- Baruch K, Deczkowska A, David E, Castellano JM, Miller O, Kertser A et al. (2014). Aging‐induced type I interferon response at the choroid plexus negatively affects brain function. Science 346: 89–93. [DOI] [PMC free article] [PubMed] [Google Scholar]
- Berkeley JL, Gomeza J, Wess J, Hamilton SE, Nathanson NM, Levey AI (2001). M1 muscarinic acetylcholine receptors activate extracellular signal‐regulated kinase in CA1 pyramidal neurons in mouse hippocampal slices. Mol Cell Neurosci 18: 512–524. [DOI] [PubMed] [Google Scholar]
- Bodick NC, Offen WW, Levey AI, Cutler NR, Gauthier SG, Satlin A et al. (1997). Effects of xanomeline, a selective muscarinic receptor agonist, on cognitive function and behavioural symptoms in Alzheimer's disease. Arch Neurol 54: 465–473. [DOI] [PubMed] [Google Scholar]
- Borden EC, Sen GC, Uze G, Silverman RH, Ransohoff RM, Foster G et al. (2007). Interferons at age 50: past, current and future impact on biomedicine. Nat Rev Drug Discov 6: 975–990. [DOI] [PMC free article] [PubMed] [Google Scholar]
- Budd DC, Spragg EJ, Ridd K, Tobin AB (2004). Signalling of the M3‐muscarinic receptors to the anti‐apoptotic pathway. Biochem J 381: 43–49. [DOI] [PMC free article] [PubMed] [Google Scholar]
- Caccamo A, Oddo S, Billlings LM, Green KN, Martinez‐Coria H, Fisher A et al. (2006). M1 receptors play a central role in modulating AD‐like pathology in transgenic mice. Neuron 49: 671–682. [DOI] [PubMed] [Google Scholar]
- Campbell IL, Krucker T, Steffensen S, Akwa Y, Powell H, Lane T et al. (1999). Structural and functional neuropathology in transgenic mice with expression of IFN‐alpha. Brain Res 835: 46–61. [DOI] [PubMed] [Google Scholar]
- Caulfield MP, Birdsall NJM (1998). International Union of Pharmacology. XVII. Classification of muscarinic acetylcholine receptors. Pharmacol Rev 50: 279–290. [PubMed] [Google Scholar]
- Crespo P, Xu N, Simonds WF, Gutkind JS (1994). Ras‐dependent activation of MAP kinase pathway mediated by G‐protein βγ subunits. Nature 369: 418–420. [DOI] [PubMed] [Google Scholar]
- Curtis MJ, Bond RA, Spina D, Ahluwalia A, Alexander SP, Giembycz MA et al. (2015). Experimental design and analysis and their reporting: new guidance for publication in BJP. Br J Pharmacol 172: 3461–3471. [DOI] [PMC free article] [PubMed] [Google Scholar]
- Dafny N, Yang PB (2005). Interferon and the central nervous system. Eur J Pharmacol 523: 1–15. [DOI] [PubMed] [Google Scholar]
- De Sarno P, Shestopal SA, King TD, Zmijewska A, Song L, Jope RS (2003). Muscarinic receptor activation protects cells from apoptotic effects of DNA damage, oxidative stress, and mitochondrial inhibition. J Biol Chem 278: 11086–11093. [DOI] [PMC free article] [PubMed] [Google Scholar]
- De Sarno P, Shestopal SA, Zmijewska A, Jope RS (2005). Anti‐apoptotic effects of muscarinic receptor activation are mediated by Rho kinase. Brain Res 1041: 112–115. [DOI] [PubMed] [Google Scholar]
- Dedoni S, Olianas MC, Onali P (2010). Interferon‐β induces apoptosis in human SH‐SY5Y neuroblastoma cells through activation of JAK–STAT signaling and down‐regulation of PI3K‐Akt pathway. J Neurochem 115: 1421–1433. [DOI] [PubMed] [Google Scholar]
- Dedoni S, Olianas MC, Ingianni A, Onali P (2012). Type I interferons impair BDNF‐induced cell signaling and neurotrophic activity in differentiated human SH‐SY5Y neuroblastoma cells and mouse primary cortical neurons. J Neurochem 122: 58–71. [DOI] [PubMed] [Google Scholar]
- Dedoni S, Olianas MC, Onali P (2014a). Interferon‐β counter‐regulates its own pro‐apoptotic action by activating p38 MAPK signalling in human SH‐SY5Y neuroblastoma cells. Apoptosis 19: 1509–1526. [DOI] [PubMed] [Google Scholar]
- Dedoni S, Olianas MC, Ingianni A, Onali P (2014b). Type I interferons up‐regulate the expression of p75NTR/TrkA receptor complex in differentiated human SH‐SY5Y neuroblastoma cells. Neuropharmacology 79: 321–334. [DOI] [PubMed] [Google Scholar]
- Dimitri CA, Dowdle W, MacKeigan JP, Blenis J, Murphy LO (2005). Spatially separate docking sites on ERK2 regulate distinct signaling events in vivo. Curr Biol 15: 1319–1324. [DOI] [PubMed] [Google Scholar]
- Domina AM, Vrana JA, Gregory MA, Hann SR, Craig RW (2004). MCL1 is phosphorylated in the PEST region and stabilized upon ERK activation in viable cells, and at additional sites with cytotoxic okadaic acid or taxol. Oncogene 23: 5301–5315. [DOI] [PubMed] [Google Scholar]
- Duffy JP, Harrington EM, Salituro FG, Cochran JE, Green J, Gao H et al. (2011). The discovery of VX‐745: a novel and selective p38α kinase inhibitor. ACS Med Chem Lett 2: 758–763. [DOI] [PMC free article] [PubMed] [Google Scholar]
- Fragoso YD, Comini Frota ER, Silva Lopes J, Silveira Noal J, Giacomo MC, Gomes S et al. (2010). Severe depression, suicide attempts, and ideation during the use of interferon beta by patients with multiple sclerosis. Clin Neuropharmcol 33: 312–316. [DOI] [PubMed] [Google Scholar]
- Francis PT, Nordberg A, Arnold SE (2005). A preclinical view of cholinesterase inhibitors in neuroprotection: do they provide more than symptomatic benefits in Alzheimer's disease ? Trends Pharmacol Sci 26: 104–111. [DOI] [PubMed] [Google Scholar]
- George PM, Badiger R, Alazawi W, Foster GR, Mitchell JA (2012). Pharmacology and therapeutic potential of interferons. Pharmacol Ther 135: 44–53. [DOI] [PubMed] [Google Scholar]
- Gibbert K, Schlaak JF, Yang D, Dittmer U (2013). IFN‐α subtypes: distinct biological activities in anti‐viral therapy. Br J Pharmacol 168: 1048–1058. [DOI] [PMC free article] [PubMed] [Google Scholar]
- Greenwood JM, Dragunow M (2010). M3 muscarinic receptors promote cell survival through activation of the extracellular regulated kinase (ERK1/2) pathway. Eur J Pharmacol 640: 38–45. [DOI] [PubMed] [Google Scholar]
- Herget T, Oerhlein SA, Pappin DJ, Rozengurt E, Parker PJ (1995). The myristoylated alanine‐rich C‐kinase substrate (MARKS) is sequentially phosphorylated by conventional, novel and atypical isotypes of protein kinase C. Eur J Biochem 233: 448–457. [DOI] [PubMed] [Google Scholar]
- Hofer MJ, Campbell IL (2013). Type I interferon in neurological disease‐The devil from within. Cytokine Growth Factor Rev 24: 257–267. [DOI] [PubMed] [Google Scholar]
- Itano Y, Ito A, Uehara T, Nomura Y (1996). Regulation of Bcl‐2 protein expression in human neuroblastoma SH‐SY5Y cells: positive and negative effects of protein kinase C and A, respectively. J Neurochem 67: 131–137. [DOI] [PubMed] [Google Scholar]
- Kang J‐H (2014). Protein kinase C (PKC) and cancer. N J Science 2014: 1–36. [Google Scholar]
- Kilkenny C, Browne W, Cuthill IC, Emerson M, Altman DG (2010). NC3Rs Reporting Guidelines Working Group. Br J Pharmacol 160: 1577–1579. [DOI] [PMC free article] [PubMed] [Google Scholar]
- King TD, Song L, Jope RS (2006). AMP‐activated protein kinase (AMPK) activating agents cause dephosphorylation of Akt and glycogen synthase kinase‐3. Biochem Pharmacol 71: 1637–1647. [DOI] [PMC free article] [PubMed] [Google Scholar]
- Lambert DG, Ghataorre AS, Nahorski SR (1989). Muscarinic receptor binding characteristics of a human neuroblastoma SK‐N‐SH and its clones SH‐SY5Y and SH‐EP1. Eur J Pharmacol 165: 71–77. [DOI] [PubMed] [Google Scholar]
- Leloup C, Michaelsion DM, Fisher A, Hartmann T, Beyreuther K, Stein R (2000). M1 muscarinic receptors block caspase activation by phosphoinositide‐3‐kinase‐ and MAPK/ERK‐independent pathways. Cell Death Differ 7: 825–833. [DOI] [PubMed] [Google Scholar]
- Lu Z, Xu S (2006). ERK1/2 MAP kinases in cell survival and apoptosis. IUBMB Life 58: 621–631. [DOI] [PubMed] [Google Scholar]
- Mattson MP (2000). Apoptosis in neurodegenerative disorders. Nat Rev Mol Cell Biol 1: 120–130. [DOI] [PubMed] [Google Scholar]
- McGrath JC, Lilley E (2015). Implementing guidelines on reporting research using animals (ARRIVE etc.): new requirements for publication in BJP. Br J Pharmacol 172: 3189–3193. [DOI] [PMC free article] [PubMed] [Google Scholar]
- McKernan DP, Dinan T, Cryan JF (2009). “Killing the Blues”: a role for cellular suicide (apoptosis) in depression and the antidepressant response ? Prog Neurobiol 88: 246–263. [DOI] [PubMed] [Google Scholar]
- Nishimura A, Kitano K, Takasaki J, Taniguchi M, Mizuno N, Tago K et al. (2010). Structural basis for the specific inhibition of heterotrimeric Gq protein by a small molecule. Proc Natl Acad Sci U S A 107: 13666–13671. [DOI] [PMC free article] [PubMed] [Google Scholar]
- Olianas MC, Maullu C, Adem A, Mulugeta E, Karlsson E, Onali P (2000). Inhibition of acetylcholine muscarinic M1 receptor function by the M1‐selective ligand muscarinic toxin 7 (MT‐7). Br J Pharmacol 131: 447–452. [DOI] [PMC free article] [PubMed] [Google Scholar]
- Olianas MC, Dedoni S, Onali P (2011). Regulation of PI3K/Akt signaling by N‐desmethylclozapine through activation of δ‐opioid receptors. Eur J Pharmacol 660: 341–350. [DOI] [PubMed] [Google Scholar]
- Olianas MC, Dedoni S, Onali P (2014). Involvement of store‐operated Ca2 + entry in activation of AMP‐activated protein kinase and stimulation of glucose uptake by M3 muscarinic acetylcholine receptors in human neuroblastoma cells. BBA Mol Cell Res 1843: 3004–3017. [DOI] [PubMed] [Google Scholar]
- Onali P, Olianas MC (2002). Muscarinic M4 receptor inhibition of dopamine D1‐like receptor signalling in rat nucleus accumbens. Eur J Pharmacol 448: 105–111. [DOI] [PubMed] [Google Scholar]
- Quian N‐X, Winitz S, Johnson GL (1993). Epitope‐tagged Gq α subunits: expression of GTPase‐deficient α subunits persistently stimulates phosphatidylinositol‐specific phospholipase C but not mitogen‐activated protein kinase activity regulated by the M1 muscarinic acetylcholine receptor. Proc Natl Acad Sci U S A 90: 4077–4081. [DOI] [PMC free article] [PubMed] [Google Scholar]
- Raison CL, Demetrashvili M, Capuron L, Miller A (2005). Neuropsychiatric effects of interferon‐α: recognition and management. CNS Drugs 19: 105–123. [DOI] [PMC free article] [PubMed] [Google Scholar]
- Resende RR, Adhikari A (2009). Cholinergic receptor pathways involved in apoptosis, cell proliferation and neuronal differentiation. Cell Commun Sign 7: 20. [DOI] [PMC free article] [PubMed] [Google Scholar]
- Robinson MJ, Stippec SA, Goldsmith E, White MA, Cobb MH (1998). A constitutively active and nuclear form of the MAP kinase ERK2 is sufficient for neurite outgrowth and cell transformation. Curr Biol 8: 1141–1150. [DOI] [PubMed] [Google Scholar]
- Ronnett GV, Ramamurthy S, Kleman AM, Landree LE, Aja S (2009). AMPK in the brain: its roles in energy balance and neuroprotection. J Neurochem 109: 17–23. [DOI] [PMC free article] [PubMed] [Google Scholar]
- Saelens X, Kalai M, Vandenabeele P (2001). Translation inhibition in apoptosis. J Biol Chem 276: 41620–41628. [DOI] [PubMed] [Google Scholar]
- Southan C, Sharman JL, Benson HE, Faccenda E, Pawson AJ, Alexander SPH et al. (2016). The IUPHAR/BPS Guide to Pharmacology in 2016: toward curated quantitative interactions between 1300 protein targets and 6000 ligands. Nucleic Acids Res 44: D1054–D1068. [DOI] [PMC free article] [PubMed] [Google Scholar]
- Szczepankiewicz BG, Kosogof C, Nelson LTJ, Liu G, Liu B, Zhao H et al. (2006). Aminopyridine‐based c‐Jun N‐terminal kinase inhibitors with cellular activity and minimal cross‐kinase activity. J Med Chem 49: 3563–3580. [DOI] [PubMed] [Google Scholar]
- Takasaki J, Saito T, Taniguchi M, Kawasaki T, Moritani Y, Hayashi K et al. (2004). A novel Gαq/11‐selective inhibitor. J Biol Chem 279: 47438–47445. [DOI] [PubMed] [Google Scholar]
- Taylor JM, Minter MR, Newman AG, Zhang M, Adlard PA, Crack PJ (2014). Type‐1 interferon signaling mediates neuro‐inflammatory events in models of Alzheimer's disease. Neurobiol Aging 35: 1012–1023. [DOI] [PubMed] [Google Scholar]
- Thomas LW, Lam C, Edwards SW (2010). Mcl‐1; the molecular regulation of protein function. FEBS Lett 584: 2981–2989. [DOI] [PubMed] [Google Scholar]
- Waetzig V, Herdegen T (2005). Context‐specific inhibition of JNKs: overcoming the dilemma of protection and damage. Trends Pharmacol Sci 26: 455461. [DOI] [PubMed] [Google Scholar]
- Wall SJ, Yasuda RP, Li M, Wolfe BB (1991). Development of an antiserum against m3 muscarinic receptors: distribution of m3 receptors in rat tissues and clonal cell lines. Mol Pharmacol 40: 783–789. [PubMed] [Google Scholar]
- Wang J, Campbell IL (2005). Innate STAT1‐dependent genomic response of neurons to the antiviral cytokine alpha interferon. J Virol 79: 8295–8302. [DOI] [PMC free article] [PubMed] [Google Scholar]
- Wang J, Schreiber RD, Campbell IL (2002). STAT1 deficiency unexpectedly and markedly exacerbates the pathophysiological actions of IFN‐α in the central nervous system. Proc Natl Acad Sci U S A 99: 16209–16214. [DOI] [PMC free article] [PubMed] [Google Scholar]
- Watson A, Eilers A, Lallemand D, Kyriakis J, Rubin LL, Ham J (1998). Phosphorylation of c‐Jun is necessary for apoptosis induced by survival signal withdrawal in cerebellar granule neurons. J Neurosci 18: 751–762. [DOI] [PMC free article] [PubMed] [Google Scholar]
- Wetzker R, Bohmer F‐D (2003). Transactivation joins multiple tracks to the ERK/MAPK cascade. Nat Rev 4: 651–657. [DOI] [PubMed] [Google Scholar]
- Xia Z, Dickens M, Raingeaud J, Davis RJ, Greenberg ME (1995). Opposing effects of ERK and JNK‐p38 MAP kinases on apoptosis. Science 270: 1326–1331. [DOI] [PubMed] [Google Scholar]
- Yamada T, Horisberger MA, Kawaguchi N, Moroo I, Toyoda T (1994). Immunohistochemistry using antibodies to α‐interferon and its induced protein, MxA, in Alzheimer's and Parkinson's disease brain tissues. Neurosci Lett 181: 61–64. [DOI] [PubMed] [Google Scholar]
Associated Data
This section collects any data citations, data availability statements, or supplementary materials included in this article.
Supplementary Materials
Figure S1 Down‐regulation of M3 mAChRs expression by siRNA treatment of SHSY5Y cells. Cells were transfected with either control siRNA or M3 mAChRs siRNA and analysed for M3 mAChRs and actin expression 48 h post‐transfection. Immunoblots are from one experiment representative of six independent experiments. The migration of molecular mass standard is indicated by the arrows.
Figure S2 Darifenacin prevents the CCh inhibition of IFN‐β‐induced PKR cleavage. SH‐SY5Y cells were incubated in serum‐free medium for 10 min in the presence of either vehicle, 10 μM CCh or CCh plus 1 μM darifenacin (Darifen) and then exposed for 24 h to either vehicle or IFN‐β (30 ng ml‐1). Cell lysates were analysed for 74 kDa and 40 kDa PKR immunoreactive bands by Western blot. The densitometric ratio of 40 kDa / 74 kDa bands is reported as percent of the stimulation induced by IFN‐β alone. Values are the mean ± SEM of five independent experiments. # P < 0.05 by ANOVA followed by Newman–Keuls post hoc test.
Figure S3 Effects of Gαq Q209L on ERK1/2 phosphorylation and IFN‐β‐induced PARP cleavage. SH‐SY5Y cells were transfected with either empty vector or pcDNA3‐Gαq Q209L (GαqQ209L) and analysed for Gαq/11 expression and ERK1/2 phosphorylation 48 h post‐transfection (A).Values are expressed as percent of control (empty vector) and are the mean ± SEM of five independent experiments. * P < 0.05 vs control by Student's t test. (B) SH‐SY5Y cells were transfected with either empty vector or pcDNA3‐Gαq Q209L (GαqQ209L). Forty‐eight hours post‐transfection cells were incubated with either vehicle or IFN‐β (30 ng ml‐1) for 24 h. Cell lysates were analysed for cleaved PARP (cleav PARP) and PARP by Western blot. Values are the mean ± SEM of five independent experiments. * P < 0.05 vs vehicle by ANOVA followed by Newman–Keuls post hoc test.
Figure S4 Over‐expression of ERK2‐L4 A‐MEK1 fusion protein and HA‐ERK2 in SHSY5Y cells. (A) Cells were transfected with either empty vector or ERK2‐L4 A‐MEK1 fusion protein (ERK2‐CA) and 48 h post‐transfection cell lysates were analysed for the expression of the fusion protein, migrating with an apparent molecular mass of ~100 kDa, by Western blot using an antibody that recognizes dually phosphorylated ERK1/2. (B) Cells were transfected with either empty vector or HA‐ERK2 and 48 h post‐transfection cell lysates were analysed for the expression of HA‐ERK2, migrating with an apparent molecular mass of 43 kDa, with either an anti‐ERK1/2 antibody (upper panel) or anti‐HA antibody (lower panel). Immunoblots are from one experiment representative of five independent experiments.
Figure S5 Inhibition of MK‐2 phosphorylation by BIRB0796 and VX745. Serumstarved SH‐SY5Y cells were pre‐incubated for 60 min with either vehicle, 1 μM BIRB 0796 (BIRB) or 5 μM VX745 (VX) and then treated with either vehicle or 10 μM CCh for 10 min. The levels of phospho‐MK2 (p‐MK2) and total MK2 were determined in cell lysates by Western blot. Values are the mean ± SEM of five experiments.
Figure S6 Blockade of CCh‐induced JNK and ERK1/2 phosphorylations by darifenacin but not MT‐7. Serum‐starved SH‐SY5Y cells were pre‐incubated for 10 min with either vehicle, 30 nM MT‐7 or 1 μM darifenacin (Darifen) and then exposed to either vehicle or 10 μM CCh for 10 min. Cell lysates were analysed for phospho‐JNK (p‐JNK), total JNK, phospho‐ERK1/2 and ERK1/2 by Western blot. Values are the mean ± SEM of five independent experiments. * P < 0.05 vs vehicle; # P < 0.05 vs CCh alone by ANOVA followed by Newman–Keuls post hoc test.
Figure S7 Cell treatment with Compound C prevents CCh‐induced AMPK phosphorylation. Cells were pre‐incubated with either vehicle or 10 μM Compound C (Comp C) for 30 min and then treated with either vehicle or 10 μM CCh for 5 min. Values are the mean of five experiments. * P < 0.05 vs vehicle, # P < 0.05 by ANOVA followed by Newman–Keuls post hoc test.
Supporting info item
Supporting info item
Supporting info item
Supporting info item
Supporting info item
Supporting info item
Supporting info item
Supporting info item