Figure 3. The instructive role of Wnt5a in the establishment of Pk3 polarity.
(A) Experimental scheme. RNAs encoding GFP-Pk3 (150 pg) and Xenopus HA-Vangl2 (60 pg) were injected animally into a ventral blastomere of 32-cell embryos, followed by injection of TurboFP635 (TFP) RNA (150 pg, lineage tracer) with or without Wnt5a RNA (500 pg) into a blastomere either to the right (L–R) or anterior (A–P) of the Pk3-injected blastomere. The injected embryos were fixed at indicated stages, ectodermal explants were dissected, and the orientation of Pk3 crescents was evaluated by GFP fluorescence. (B–D) Cell orientation in L-R-positioned clones. (B) Low magnification view of a stage 11.5 explant. Orientation of individual cells was quantified relative to the dashed line approximating TFP clone border (boxed area). The antero-posterior and left-right axes are indicated. (C) Control embryo, (D) Wnt5a-expressing embryo. (E–H) Cell orientation in A–P-positioned clones at indicated stages. (E) Low magnification view. (F) Control embryo, (G, H) Wnt5a RNA-injected embryos. Arrows indicate cell orientation relative to the TFP clone (D, G, H). Scale bar, 50 µm. (I, K) Rose diagrams show Pk3 patch orientation in L–R (I) or A–P (K) experimental groups. Cell orientation was defined by an angle between the line joining the two ends of each Pk3 patch and the line approximating TFP clone border. (M) Orientation of Pk3 crescents in the A–P group at stage 15. See Figure 1F–H legend for quantification details. n, number of scored cells. p values were obtained by comparing the Wnt group to the control group using Chi-squared test. (J, L, N) Polar plots derived from (I, K, M), respectively, depict the mean Pk3 orientation in individual embryos. Arrow length is 1 minus the circular variance around the mean. Data were collected from two independent experiments.

Figure 3—figure supplement 1. Effect of Wnt5a on microtubule orientation.

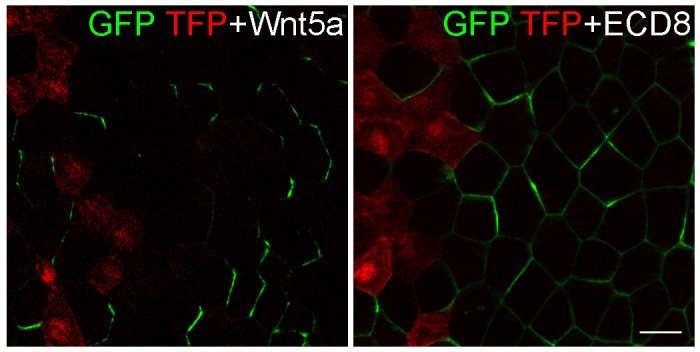
Figure 3—figure supplement 2. ECD8 does not direct GFP-Pk3 polarization.