

Abstract
A ready-to-eat food product in the form of compressed bar from beetroot, enriched with dates and oats was developed. Levels of intermediate moisture beetroot shreds (60–100 g), dates (10–30 g) and oats (5–15 g) were optimized using response surface methodology and its quality attributes were investigated over a period of 6 months at different temperature conditions (ambient temperature; 22–32 and 37 °C). Optimum formulation for best beetroot bar consisted of beetroot shreds, dates and oat were derived as 71.8, 21.2, and 8.4 g, respectively. Developed product was found rich in fibers and minerals and recorded 38.4 mg/100 g betacyanains, 23.1 mg/100 g betaxanthins, 295 mg/100 g total phenolics (TP) and 160 mg/100 g total flavonoids (TF). The shelf stability studies of bar revealed predominant changes in bioactive compounds was caused by storage temperature. A loss of around 30, 15, 25, 31 and 32 % was observed for betacyanins, betaxanthins, TP, TF and radical scavenging activity, respectively during storage of 6 months at 6 °C compared to AT or 37 °C temperature conditions. The product had high overall sensory acceptability as well as microbial safety up to 6 months when stored at AT. The study indicated that beetroot could be effectively utilized into a novel shelf-stable ready-to-eat nutritious compressed product.
Keywords: Intermediate moisture, Beetroot, Bar, Betacyanin, Shelf stability
Introduction
Consumer preference for convenience foods has increased tremendously mainly due to their ease of consumption by reducing the input required from users in preparation and cooking (Igual et al. 2013). Convenience foods are usually ready-to-eat in nature, easily portable and have a longer shelf life. Ready-to-eat snacks are one of the sections of mostly consumed convenience foods which include confectionary, biscuits, fried chips and savoury snacks (Besbes et al. 2009). However, in the past decade a paradigm shift towards healthy foods rich in fruits and vegetables has also been increased among the consumers due to awareness of their associated benefits with health maintenance and well-being (Saxena et al. 2009). Fruits and vegetables are an essential part of a balanced diet and play an important role in reducing the risk of chronic diseases including cardiovascular diseases and some cancers and premature death (Sun-Waterhouse et al. 2010). Food manufacturers are looking for ways to make healthy ready-to-eat food products, particularly, from fruits and vegetables, in order to improve public health (Taoukis and Richardson 2007).
Beetroot (Beta vulgaris) is cultivated worldwide for its large edible flashy taproots. Beetroot is rich in carbohydrates, fibres, proteins and minerals such as sodium, potassium, calcium, phosphorous and iron. They also contain several bioactive compounds such as carotenoids betacyanines, folates, biologically accessible anti-oxidants and polyphenols and flavonoids (Gokhale and Lele 2011). The characteristic colour of beetroot is due to pigment called betalain, a class of betalamic acid derivatives which are composed of betacyanins and betaxanthins (Pitalua et al. 2010). The beetroot juice has been reported to be used for development of nutritious pasta (Mridula et al. 2016) while its extract was reported beneficial in preservation of chicken meat (Packer et al. 2015). Though rich in so many nutrients the consumption of beetroot is restricted to salads and in the form of juice. Moreover, fresh beetroots have limited shelf-life and spoil quickly due to their high moisture content. Therefore, value addition by processing of beetroots to a ready-to-eat product is an attractive alternative.
One of the preservation methods of fruits and vegetables along with fresh character is to convert them into intermediate moisture (IM) foods. IM foods are heterogeneous group of foods including meat, bakery and fruits and vegetable based products that are stabilized by lowering their water activity (a w) to a level insufficient to support bacterial growth, typically in the range of 0.6–0.9 (Taoukis and Richardson 2007). The IM food products are becoming popular because of their shelf-stability, retention of nutrition value, and convenience with restricted transportation and storage costs (Mishra et al. 2015). IM foods have the advantage of longer shelf-life without refrigeration, freezing, or thermal processing. Further fortification with bioactive extract such as green tea has also been reported to increase stability of intermediate moisture apple (Lavelli et al. 2011). They do not require special storage and processing conditions and retain higher amounts of nutrients and quality compared to thermally treated foods. The objective of the present study was to develop a fibre rich ready-to-eat beetroot bar with intermediate moisture content and to evaluate its nutritional quality and shelf-stability during 6 months storage under different temperature conditions (6, 22–32 ambient temperature and 37 °C).
Materials and methods
Preparation of IM beetroot shreds
Beetroots devoid of any blemishes such as visible signs of microbial infections and physical injuries were procured from the market in Mysore, India. Food grade commercial cane sugar was also procured from the local market. Beetroots were surface sanitized with chlorinated water (100 ppm) and peeled manually with SS scraping knives. Peeled beetroots were grated in a food processor (Philips, India) into 18–20 mm long and 2 mm thick shreds. Grated beetroot were steam blanched (2 min) and dipped in an osmotic solution of food grade commercial cane sugar (30°brix, 6 % glycerol and 3.8 pH) for 4 h at ambient temperature with continuous stirring. Potassium sorbate (0.3 % w/v; S.D. Fine Chemicals Ltd., Mumbai, India), and potassium metabisulfite (0.4 % w/v; Qualigen, Mumbai, India) as anti-microbial agents were added to the soak solution during the osmotic process. A ratio of 1:5 for beetroot to solution was kept to prevent the possibility of excessive dilution. After completion of dip-treatment, the osmotic solution was drained using a basket centrifuge (500 rpm, 1 min) and beetroot shreds were kept in a cabinet crier (65 °C, 1 h) to remove the surface moisture. The a w of the shreds after removal of surface moisture was 0.821.
Optimization of bar
The various ingredients used to prepare bar were IM beetroot shreds, dates paste, oats powder, skim milk powder (SMP), sesame seeds, roasted nuts and cardamom powder as flavouring agent. The level of beetroot shreds (g), dates paste (g) and oats powder (g) (experimental variables) was optimized using response surface methodology (RSM) with Box Behnken response surface design. The design was generated using commercial statistical package, Design-Expert version 7.1.3 (Statease Inc., Minneapolis, USA, Trial version). Seventeen experiments were carried out with different permutations of selected variable components. The ranges of values were 60–100 g beetroot shreds, 10–30 g dates and 5–15 g oats. The experimental plan in the actual form of process variables (level of beetroot shreds, dates and oat) along with responses (firmness, Hunter L-, a- and b-values and overall acceptability scores) is given in Table 1. The experimental format for the uncoded form of process variables was randomized to maximize the effect of unexplained variability in the observed responses due to extraneous factors.
Table 1.
Experimental design used and values of response
| Experiment run | Beetroot (g) | Dates (g) | Oats (g) | Firmness (N) | L-value | a-value | b-value | OAA |
|---|---|---|---|---|---|---|---|---|
| 1 | 70 | 10 | 15 | 38.1 | 29.4 | 10.53 | −2.75 | 6.10 |
| 2 | 80 | 10 | 10 | 37.6 | 29.4 | 11.08 | −3.49 | 7.31 |
| 3 | 70 | 20 | 10 | 39.2 | 28.2 | 10.70 | −2.08 | 7.09 |
| 4 | 80 | 30 | 10 | 40.9 | 27.3 | 10.85 | −2.72 | 8.38 |
| 5 | 70 | 20 | 10 | 38.8 | 27.7 | 10.53 | −2.28 | 6.92 |
| 6 | 60 | 20 | 5 | 36.5 | 24.4 | 10.16 | −2.42 | 7.01 |
| 7 | 60 | 30 | 10 | 38.6 | 24.9 | 10.06 | −1.82 | 7.19 |
| 8 | 60 | 10 | 10 | 34.6 | 27.0 | 10.28 | −2.67 | 5.83 |
| 9 | 60 | 20 | 15 | 38.5 | 26.4 | 9.91 | −2.02 | 5.95 |
| 10 | 70 | 30 | 15 | 41.8 | 27.1 | 10.32 | −1.90 | 7.46 |
| 11 | 80 | 20 | 15 | 41.0 | 28.1 | 10.64 | −2.96 | 7.12 |
| 12 | 70 | 20 | 10 | 38.8 | 27.8 | 10.58 | −2.38 | 6.94 |
| 13 | 70 | 30 | 5 | 39.5 | 25.4 | 10.49 | −2.66 | 8.37 |
| 14 | 70 | 20 | 10 | 39.2 | 28.1 | 10.68 | −2.08 | 7.07 |
| 15 | 80 | 20 | 5 | 39.5 | 27.4 | 10.98 | −3.40 | 8.45 |
| 16 | 70 | 20 | 10 | 38.8 | 27.7 | 10.53 | −2.38 | 6.92 |
| 17 | 70 | 10 | 5 | 36.3 | 27.7 | 10.76 | −3.43 | 7.34 |
Compression and packaging
Various ingredients was of the selected formulation were mixed manually and compressed in a compressing machine (Sumuki Ltd., Mysore, India) to form bars (40 × 40 × 10 mm3). Compression was achieved at a pressure of 125 kg/cm2. Unit sizes (25 g each) of processed material in the form of compressed bars were filled in polypropylene (PP) pouches (30 gauges thickness, 12 × 10 cm2) and sealed using an impulse heat sealer. Packaged samples were stored at 6, ambient temperature (22–32) and 37 °C for further analyses.
Physico-chemical analyses
Moisture, protein, crude fat, ash, and crude fibre contents of the samples were determined using standard procedures as described in AOAC (1990). Mineral content of the samples was evaluated using flame atomic absorption spectrophotometry (F-AAS) (Varian 280 FS model, Switzerland). The pH was estimated with a digital pH meter (Cyberscan, Eutech instrument, Singapore). Total soluble solids of the osmotic solutions were determined using a hand refractometer (Atago Co. Ltd, Tokyo, Japan). A dew point equipment (Aqua Laboratory, Decagon CX-2, Decagon Devices Inc., Pullman, Washington, USA) was used to determine the a w of the samples at 25 °C. Color coordinates of the surface of bar on were determined using a tri-stimulus Hunter colorimeter (M/s Miniscan XE plus, Model No. 45/O-S, Hunter Associates Laboratory, Inc., Reston, VA, USA) with D65 illuminator at an observer angle of 10°. The firmness of the bars was measured as shear force using a texture analyser (TAHdi; Stable Micro Systems, London, UK) equipped with a 5 kg load cell and Warner Bartzler shear blade operated at a test speed of 0.5 mm/s. The pre and post speeds were set at 1 mm/s and 5 mm/s, respectively. All the estimations were replicated three times and the results were expressed by mean ± standard deviation.
Browning index
Non-enzymatic browning in terms of browning index (BI) was estimated as described by Saxena et al. (2009). 5 g sample was extracted with 100 ml ethanol (67 %) for 1 h. This extract was filtered through Whatman No. 1 filter paper and browning index in terms of absorbance at 420 nm of the filtrate was measured with 67 % ethanol as blank.
Betalain content
The betalains were estimated in terms of betacyanin and betaxanthin contents. The betacyanins and betaxanthins in the sample extract of fresh as well as processed beetroot bar were determined spectrophotometrically at 536 and 485 nm, respectively with a UV–Vis spectrometer as described by Stintzing et al. (2003) using following formula:
| 1 |
where A is absorbance at 536 nm for betacyanins or 485 nm for betaxanthins; DF is dilution factor; molecular weight (MW) is 550 g/mol (for betacyanins) or 339 g/mol (for betaxanthins); ε is 60,000 (molar extinction coefficient cm−1 mol−1 L for betacyanins) or 48,000 (for betaxanthins); and L is the path length (1 cm) of the cuvette. Samples were measured in triplicate.
Total phenolics
Total phenolics were estimated using Folin–Ciocalteau reagent (Singleton et al. 1999). Five grams of beetroot bar sample were extracted with 50 ml methanol. To 1 ml of the extract, 9 ml H2O, 1 ml Folin–Ciocalteau reagent were added, and after 6 min, 10 ml of 10 % Na2CO3 and the contents were mixed and allowed to stand for 90 min. The absorbance of samples was measured at 750 nm. A standard curve of known concentrations of gallic acid against respective absorbance measured at 750 nm was plotted. The amount of total phenolics in sample solutions was expressed as a gallic acid equivalent (GAE) in mg per 100 g using this curve.
Total flavonoids
Total flavonoid content was determined according to the method described by Zhishen et al. (1999). One millilitre of the methanolic extract of the bar sample was mixed with 4 ml distilled water and 0.3 ml of sodium nitrite (5 %) were added. After 5 min, 0.3 ml of 10 % AlCl3 solution was added and after 6 min, 2 ml of sodium hydroxide (1 M) was added. The mixture was made up to 10 ml with distilled water and absorbance at 510 nm was measured. A standard curve of known concentrations of catechin against respective absorbance measured at 510 nm was plotted. Total flavonoids content in sample solutions was expressed as a catechin equivalent in mg per 100 g using this curve.
Radical scavenging activity
Radical scavenging activity (RSA) was determined using the method as described by Blois (1958). A sample of 5 g was extracted with distilled water and made up to 100 ml. To 0.1 ml of this extract, 2.9 ml methanol (total 3 ml) was added and shaken vigorously. This mixture was centrifuged at 5000 rpm for 15 min at 4 °C. 0.5 ml diphenyl picrylic hydrazine (DPPH) reagent was added to the filtrate, and incubated for 45 min in dark. Absorbance was taken at 515 nm with methanol as blank. Results were expressed as percentage inhibition of DPPH radical and calculated using following equation:
| 2 |
Microbiological analyses
The microbiological analyses in terms of standard plate count and yeast and molds count were carried out using standard methodology (APHA 1992) at zero time and then an interval of one month. Plate count agar (PCA) for determination of standard plate count and acidified potato dextrose agar (PDA) for determination of yeasts and molds count were used. Numbers of micro-organisms were expressed as log CFU/g of sample.
Sensory evaluation
The sensory evaluation of the compressed bar samples was carried out in terms of color, flavour, texture, taste and reported as overall acceptability (OAA) using a nine point hedonic scale according to Larmond (1977) by a semi-trained panel consisting of ten members which included scientific staff of the laboratory. The scores were assigned from 9 to 1 (9: excellent; 7: good; 5: acceptable i.e. limit of marketability; 3: poor and 1: extremely poor). Samples were randomly drawn from each experimental block, coded, and served to the panellists in a sensory laboratory (tested at room temperature of 25 ± 1 °C). Potable water was provided to each panellist for rinsing the mouth before tasting each sample.
Statistical analysis
Response data were fitted to the second order polynomial equation, which described the effect of the independent variables on the response as well as the combined effect of them on the response Y and determined the interrelationship among the test variables.
| 3 |
where Y (i = 1–5) is the predicted response for firmness, Hunter L-, a- and b-values and OAA respectively, β 0 the estimated regression coefficient of the fitted response at the center point of the design, β 1, β 2, β 3 the regression coefficient for linear effect terms, β 11, β 22, β 33 the quadratic effects and β 12, β 13, β 23 the interaction effects. The fitted polynomial equations were expressed as contour plots in order to visualize the relationship between the response and experimental levels of each factor and to interpret the optimum conditions (Feng et al. 2015). The optimum levels of variables for development of compressed beetroot bar were achieved using the desirability function method with the goal to obtain maximum OAA, while firmness, L-, a- and b-values in the ranges obtained. Statistical analysis of physico-chemical analysis and sensory evaluations was performed by analysis of variance (ANOVA) and means were compared using the least significant difference (LSD, 95 %) by Duncan’s multiple range tests using Statistics 7 software (StatSoft, Tulsa, Oklahama, USA).
Results and discussion
Beetroot is highly nutritious vegetable crop which is a perishable commodity due to its high moisture content. Also, it is not relished much in the raw form. Development of ready-to-eat bar from beetroot along with dates and oats by optimization process could be highly advantageous in obtaining a high quality product. Firmness, L-, a- and b-values and OAA were selected as responses for the optimization process. Firmness is an indicator of texture quality of any food product. It was evaluated to check the softness or hardness of the developed bar in terms of cutting force. For evaluation of visual color changes, L-, a- and b-values were assessed. The overall sensory acceptability scores were selected as one of the responses because it is directly dependent on specific composition of the product to decide its consumer acceptability (Wadikar et al. 2008).
Optimization of the ingredients for development of beetroot bars
Firmness, L-, a- and b-values of the bars ranged from 34.6 to 41.8 N, 24.4 to 29.4, 9.9 to 11.1, −1.82 to −3.49, respectively (Table 1). The overall acceptability (OAA) scores varied from 5.83 to 8.45 for different combinations of variables. Increase in the level of oats in the formulation showed negative effect on the OAA scores. All the formulations were rated higher than the limit of acceptability (>5). OAA of a product is highly critical parameter as the sensory aspects gives in-depth insight of its preference and acceptability for marketing (Parn et al. 2015).
All the three responses were found to have significant sum of squares (P < 0.05) and high regression coefficients indicating compliance with the given set of variables with a second order polynomial (Eq. 3). The coefficients for the actual functional components for predicting the various responses during the optimization process are given in Table 2. The linear and quadratic terms of all the three experimental variables showed significant (P < 0.05) effect on firmness and b-values. However, quadratic effects of dates level on L- and a-values and quadratic effects of beetroot level on a-value and OAA was non-significant (P > 0.05). The magnitude of regression coefficients indicated maximum positive influence of dates level followed by beetroot and oat on firmness whereas increase in beetroot level affected the L-, a-, b-values and OAA significantly (P < 0.05). Except L-values, other responses were found not to be affected by interactions terms of the variables (Fig. 1a–e). The multiple regression equations (Eq. 3) generated in uncoded form between the various responses and process variables are given below (Eqs. 4–8):
| 4 |
| 5 |
| 6 |
| 7 |
| 8 |
Table 2.
Regression coefficients of the fitted second-order polynomials representing the relationship between the responses and variables
| Coefficients | Firmness (N) | L-value | a-value | b-value | OAA |
|---|---|---|---|---|---|
| a 0 | 38.960* | 27.90* | 10.604* | −2.240* | 6.988* |
| Linear | |||||
| a 1 | 1.350* | 1.19* | 0.393* | −0.455* | 0.660* |
| a 2 | 1.775* | −1.10* | −0.116* | 0.405* | 0.603* |
| a 3 | 0.950* | 0.76* | −0.124* | 0.285* | −0.568* |
| Interaction | |||||
| a 12 | −0.175 | 0.00 | −0.003 | −0.020 | −0.073 |
| a 13 | −0.125 | −0.33* | −0.023 | 0.010 | −0.068 |
| a 23 | 0.125 | 0.00 | 0.015 | 0.020 | 0.083 |
| Quadratic | |||||
| a 11 | −0.543* | −0.79* | −0.070 | −0.225* | 0.002 |
| a 22 | −0.493* | 0.04 | 0.033 | −0.210* | 0.187* |
| a 33 | 0.458* | −0.54* | −0.112* | −0.235* | 0.142* |
| R 2 | 0.995 | 0.990 | 0.980 | 0.968 | 0.996 |
* Significant at 5 % level
Fig. 1.
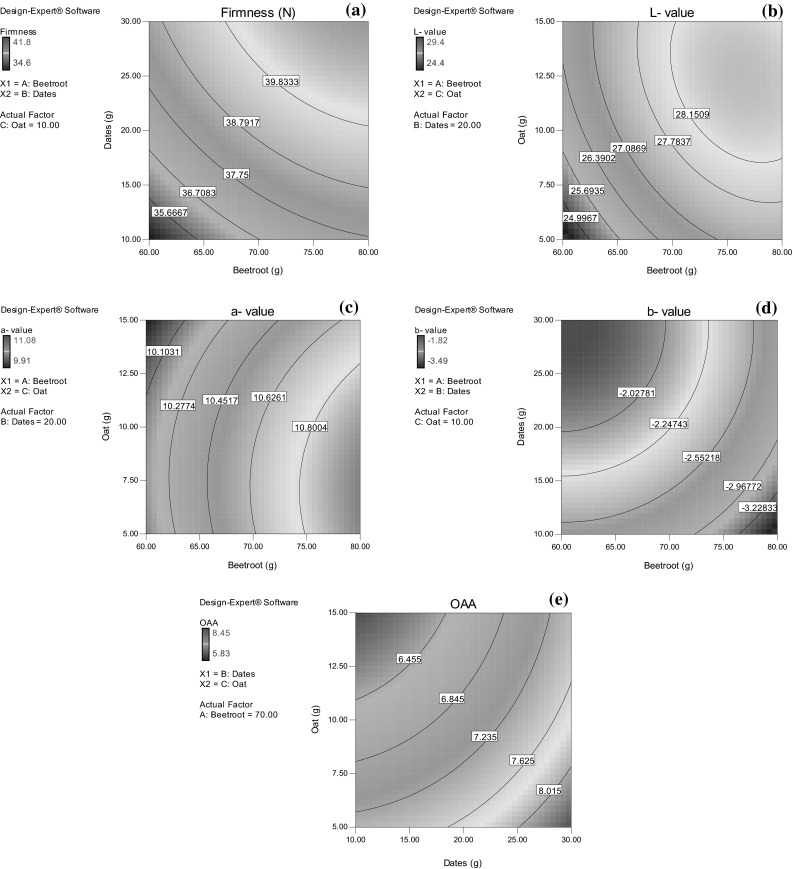
Contour plots for the effect of experimental variables on a firmness, b L-value, c a-value, d b-value and e overall acceptability scores of compressed beetroot bar
Five solutions were obtained for optimum combination of variables with a desirability value of greater than 0.981 and optimum conditions for level of beetroot; dates and oat were derived as 71.8, 21.2, and 8.4 g, respectively. The predicted and experimental response values obtained for the optimized bar were found to be in close proximity; hence the fitted models were found suitable for predicting the responses (Table 3).
Table 3.
Optimized independent variables and predicted and experimental values of responses at optimum level
| Variables | Optimum level | |
|---|---|---|
| Beetroot (g) | 71.8 | |
| Dates (g) | 21.2 | |
| Oats (g) | 8.4 |
| Response | Predicted value | Experimental value |
|---|---|---|
| Firmness (N) | 41.4 | 41.7 ± 0.7 |
| L-value | 27.8 | 28.2 ± 0.4 |
| a-value | 10.6 | 10.2 ± 0.6 |
| b-value | −2.13 | −2.08 ± 0.07 |
| OAAa | 8.37 | 8.42 ± 0.06 |
n = 3, a n = 10
Physico-chemical properties
The optimized formulation of bar was processed in bulk and analysed for physico-chemical properties. The developed beetroot bar had a moisture content of 26 % and a w of 0.80 which were in agreement with the range of moisture (10–40 %) and a w (0.6 and 0.9) for IM foods (Taoukis and Richardson 2007). Fibre content of the bar was found to be 4.86 %. Addition of dates and oat might have been responsible for the high fibre in the product. Many health benefits are associated with the consumption of dates as they are very good source of sugars, dietary fibre and phenolic compounds (Besbes et al. 2009). Snacks enriched with fibre are gaining importance among consumers especially fruits and vegetable based snacks. Atomic absorption spectroscopic studies revealed that the bar was rich in minerals such as iron, potassium, magnesium and calcium with an amount of 6.09, 1032.0, 282.39 and 593.83 mg/100 g, respectively. The developed product was also recorded with considerable amount of bioactive compounds. Total phenolic and total flavonoids content of the bar were 295 mg/100 g and 160 mg/100 g, respectively. The total phenolic content of bar was found to be high due to beetroot and dates which are rich source of a number of polyphenolic compounds (Pitalua et al. 2010). Sharma et al. (2016) reported a lower value of total phenolics in extrusion cooked pineapple leather (46.91 mg GAE/100 g).
Changes in physico-chemical properties during storage
Moisture content, a w, texture, color and sensory characteristics are important parameters to analyse the quality and shelf stability of IM fruits and vegetables (Yan et al. 2008). The moisture content decreased significantly (P < 0.05) during storage in the samples kept at AT and 37 °C (Table 4). Similarly, the a w of beetroot bars also decreased during storage with the effect being more pronounced in the samples stored at higher temperature (37 °C). Moisture evaporation and migration from packaging material might be responsible for the decrease in moisture content during storage. Panwar et al. (2013) also reported decrease of moisture content in IM aonla during 6 months storage due to evaporation of moisture from the product.
Table 4.
Changes in quality parameters of compressed beetroot bar during storage under different temperature conditions
| Storage period (months) | Storage temp. (°C) | Moisture (%) | pH | a w | Betalain (mg/100 g) | Firmness (N) | Sensory scoresx (OAA) | SPC (log CFU/g)y | Yeast and molds (log CFU/g)y | |
|---|---|---|---|---|---|---|---|---|---|---|
| Betacyanins | Betaxanthins | |||||||||
| 0 | 32.21 ± 0.07a | 3.88 ± 0.01a | 0.830 ± 0.001a | 38.4 ± 0.02a | 23.1 ± 0.04a | 34.32 ± 0.04a | 8.46 ± 0.02a | <1 | <1 | |
| 2 | 6 | 32.03 ± 0.05a | 4.01 ± 0.01a | 0.829 ± 0.001a | 36.8 ± 0.02a | 22.7 ± 0.05a | 34.41 ± 0.07a | 8.13 ± 0.05a | <1 | <1 |
| 22–32 | 31.29 ± 0.04a | 4.14 ± 0.01a | 0.826 ± 0.001b | 33.5 ± 0.04a | 21.8 ± 0.05a | 34.52 ± 0.06a | 7.17 ± 0.04ab | <1 | <1 | |
| 37 | 31.03 ± 0.07b | 4.23 ± 0.00a | 0.825 ± 0.001b | 27.8 ± 0.07b | 20.7 ± 0.03ab | 34.83 ± 0.08b | 6.69 ± 0.02ab | <1 | <1 | |
| 4 | 6 | 31.78 ± 0.03a | 4.19 ± 0.01a | 0.827 ± 0.002ab | 31.9 ± 0.05a | 21.1 ± 0.03a | 34.75 ± 0.05ab | 7.12 ± 0.04ab | <1 | <1 |
| 22–32 | 30.80 ± 0.02b | 4.33 ± 0.02b | 0.824 ± 0.002bc | 26.2 ± 0.05b | 19.8 ± 0.05b | 34.90 ± 0.05b | 6.04 ± 0.03c | <1 | <1 | |
| 37 | 30.36 ± 0.05b | 4.41 ± 0.01b | 0.823 ± 0.001bc | 17.2 ± 0.04c | 17.9 ± 0.02c | 35.21 ± 0.09b | 5.48 ± 0.06c | <1 | <1 | |
| 6 | 6 | 31.41 ± 0.04a | 4.38 ± 0.02b | 0.825 ± 0.001b | 27.0 ± 0.06b | 19.6 ± 0.07b | 35.05 ± 0.04b | 5.73 ± 0.06c | <1 | <1 |
| 22–32 | 30.2b ± 0.03c | 4.53 ± 0.01c | 0.822 ± 0.001c | 19.1 ± 0.03c | 17.6 ± 0.06c | 35.37 ± 0.06bc | 4.78 ± 0.05d | <1 | <1 | |
| 37 | 29.82 ± 0.06c | 4.60 ± 0.02c | 0.821 ± 0.002c | 9.5 ± 0.07c | 15.2 ± 0.02d | 35.72 ± 0.04c | 4.09 ± 0.05d | <10 | <1 | |
Mean value in each column with different alphabet differs significantly (P < 0.05). n = 3, x n = 10, y n = 2
The color of beetroot bar turned brown after storage of 6 months. Both, storage temperature and storage time affected the color co-ordinates significantly during storage. The lightness of the product which was assessed in terms of L-value reduced to about 84, 71, and 59 % from the initial value in beetroot bars stored at 6, AT and 37 °C, respectively (Fig. 2a). The change in L-value was high at higher temperature of storage which was also reported by Yan et al. (2008) in IM banana stored at higher temperatures. The increase in opacity of the beetroot bar with decrease in L-value may be due to the concentration effect and the shrinkage caused by moisture loss (Contreras et al. 2008). The a-value of the bars decreased during storage while the b-value was found to increase (Fig. 2b, c). The increase in b-value indicated development of dull yellow brown color in the beetroot bars. The kinetics of colour degradation in beetroot puree was studied by Chandran et al. (2014). The browning index (BI) which is an indicator of non enzymatic browning was found to increase in all the samples during storage, however, to different extents (Fig. 2d). Storage temperature showed significant effect (P < 0.05) on a- and b-values which recorded a reduction of around 19–39 and 19–58 % respectively during 6 months of storage. The percentage change in optical density (OD) values for BI was around 19, 43 and 57 % in the bars stored at 6 °C, AT and 37 °C, respectively. The increase was non-significant (P > 0.05) in the bars kept at low temperature and did not alter the acceptability of bar during the entire storage periods. This may be due to the a w of the bar (0.80) which does not support non-enzymatic browning. Rate of change of BI has been reported to be high in foods having a w in the range of 0.54–0.75 (Labuza and Saltmarch 1981). However, BI increased drastically in the samples kept at higher temperature (37 °C) which could be due to the decrease in a w during storage at higher temperature (Forni et al. 1997). The non-enzymatic browning reactions between carbonyl groups on reducing carbohydrates and exterior amine groups on proteins limits the shelf life of IM foods leading to unappealing color, texture and flavour (Loveday et al. 2010).
Fig. 2.

Changes in Hunter a L-value; b a-value; c b-value; d browning index; e total phenolics; f total flavanoids; and g radical scavenging activity of compressed beetroot bars during storage at different temperature conditions (diamond 6 °C; square 22–32 °C; triangle 37 °C) Data represent the mean ± SD (n = 3)
Changes in bioactive components during storage
Fresh beetroot was found to contain 60.2 and 28.8 mg/100 g of betacyanin and betaxanthin content, respectively. Betacyanin has been reported as a major colouring substance in the red beetroot amounting to almost 75–95 % of the total colouring matter and has high anti-oxidant activity due to the presence of electron donor phenolic and cyclic amine groups (Kanner et al. 2001). The betacyanin and betaxanthin contents of processed beetroot bar were found to be 38.4 and 23.1 mg/100 g, respectively. The loss in betacyanin content from the raw beetroot might be due to the processing operations such as blanching, osmo-dehydration and compression. The betacyanin content decreased continuously in the bars stored at AT and 37 °C (Table 4). Maximum retention of the pigment was found in the samples stored at low temperature (6 °C). At the end of 6 months, the betacyanin content was found to be around 70, 50 and 25 % of the initial content in beetroot bars stored at 6, AT and 37 °C, respectively whereas betaxanthins showed restricted degradation of about 85, 76 and 66 % at the similar temperature conditions. Gokhale and Lele (2011) reported greater stability of yellow pigment betaxanthins than the red pigment betacyanins. The degradation of betacyanin may be attributed to the storage temperature and a w of samples (Pitalua et al. 2010). The betacyanin stability decreases during food processing and storage due to increasing degradation rates resulting from increasing temperatures.
The total phenolic (TP) content of beetroot bars decreased during storage at all the temperatures (Fig. 2e). The initial TP content of 295 mg/100 g decreased to around 25, 47, and 69 % in the samples stored at 6, AT and 37 °C, respectively. Higher degree of loss in TP at higher storage temperature decreased the functionality of beetroot bars. Ismail et al. (2004) reported high temperature as a major factor responsible for decreases in TP content in vegetables by changing phenolic profiles due to leaching of hydrophilic phenolic compounds, degrading polyphenols, transforming phenolics and stimulating additional chemical reactions. Figure 2f shows the loss in total flavonoids (TF) of beetroot bars. The decrease was about 31, 44 and 58 % from the initial TF content. Igual et al. (2013) also found decrease in TF of the grapefruit jam during storage. However, they reported maximum retention of TF in jam prepared by osmotic dehydration process than the heat treated and microwave treated jam during storage. They also reported that the loss of phyto-chemicals was more provoked by storage period than the loss caused by processing. The radical scavenging activity (RSA) of the bars also decreased to the extent of about 32, 52 and 70 % at 6, AT and 37 °C, respectively (Fig. 2g). Loss in TP and TF contents has been accredited with the decreased in anti-oxidant potential in terms of RSA (Saxena et al. 2009). Effect of storage temperature was found significant (P < 0.05) in decreasing all the bioactive components. Castello et al. (2011) suggested a lower temperature of storage of osmo-dehydrated persimmon fruit to retain maximum antioxidant activity. Lavelli et al. (2011) also reported decrease in anti-oxidant potential of IM apple product during storage. They reported that reduced a w level in the range of 0.55 and 0.75 in their products supported degradation of phyto-chemicals.
Changes in sensory and microbiological characteristics during storage
The consumer acceptance of a food product largely depends on its sensory perception. The overall acceptability (OAA) scores were found to decrease during storage at all the temperature conditions (Table 4). The OAA scores after 6 months of storage decreased from 8.46 to 7.45, 7.2 and 6.4 for the samples stored at 6, AT and 37 °C, respectively. The beetroot bars stored at low (6 °C) and AT conditions were found to be acceptable in terms of sensory characteristics up to 6 and 4 months, respectively. The most affected sensory parameter was appearance which decreased significantly (P < 0.05) during storage of 6 months. This may be due to the increase in browning index. The taste of beetroot bars also changed negatively after storage of 6 months. The existence of undesirable taste of beetroot bars upon storage could be due to occurrence of chemically heterogeneous micro-environments resulting in various physicochemical reactions (Kou et al. 2002).
Microbiological profiles showed almost nil total plate count, yeast and molds count throughout the storage period at all the temperatures (Table 4). The microbiological stability of the beetroot bar could be attributed to the low pH and application of osmotic treatment for converting the beetroot in IM form. The osmotic solution which fills the intracellular spaces of the plant tissue limits the growth and movement of micro-organisms (Castello et al. 2009). However, microbiological safety is not the only criteria to judge the shelf-stability of the food product. Shelf-life of IM foods is effected by intrinsic factors such as composition, a w, pH, acidity, redox potential, available oxygen, level of microbial contamination, and type and concentration of preservatives used as well as extrinsic factors such as type of processing, temperature and relative humidity of storage, expose to light and oxygen and the properties of the packaging material (Kilcast and Subramaniam 2004). On the basis of sensory acceptability it can be concluded that the shelf life of beetroot was 4 months at AT which could be further enhanced, if the bars are stored at lower temperature conditions. However, the shelf-life was limited up to only 2–3 months at higher temperature conditions. Avellaneda et al. (2012) reported shelf-life of 243 days in IM tomato slices which was high as compared to the shelf-life of the developed IM beetroot bar at the same temperature. This may be due to the difference in the raw material and process. Moreover the shelf-life of IM tomato slices was based on simulation and moisture sorption isotherm models. Osmotic dehydration coupled with blanching, Infra-red drying, followed by LDPE packaging and gamma radiation (2 kGy) treatment was also found effective in eliminating microbial load and extending the shelf life of IM papaya cubes up to 60 days at ambient temperature storage (Mishra et al. 2015).
Conclusions
In the present study, a shelf-stable snack was developed from beetroots, dates and oats which are rich in many phyto-nutrients. IM beetroots in the form of compressed bars could be consumed directly as a substitute to traditional snacks made of white flour as the product is based on vegetable which also brings novelty to the bars. Reduction in volume by compression of the ingredients resulted lowering of bulk thereby decreasing the transportation costs. Results indicated that the shelf stability of bar is highly affected by storage temperature. However, stabilization with intermediate moisture technique could achieve a remarkable shelf-life of the product. The shelf stability of IM beetroot bars at ambient temperature represented important market opportunities for food processors. The developed bar is a good source of fibre, bioactive compounds and minerals. Therefore, consumers may benefit from regular consumption of IM beetroot bar.
References
- AOAC . Official methods of analysis of the association of analytical chemists. Washington: AOAC; 1990. [Google Scholar]
- APHA . Culture methods for enumeration of microorganisms. In: Speak ML, editor. Compendium of methods for the microbiological examination of foods. 16. Washington: American Public Health Association; 1992. p. 734. [Google Scholar]
- Avellaneda ZE, Velazquez G, Torres JA, Welti-Chanes J. Inclusion of the variability of model parameters on shelf-life estimates for low and intermediate moisture vegetables. LWT-Food Sci Technol. 2012;47:364–370. doi: 10.1016/j.lwt.2012.01.032. [DOI] [Google Scholar]
- Besbes S, Drira L, Blecker C, Deroanne C, Attia H. Adding value to hard date (Phoenix dactylifera L.): compositional, functional and sensory characteristics of date jam. Food Chem. 2009;112(2):406–411. doi: 10.1016/j.foodchem.2008.05.093. [DOI] [Google Scholar]
- Blois M. Antioxidant determinations by the use of a stable free radical. Nature. 1958;181:1199–1200. doi: 10.1038/1811199a0. [DOI] [Google Scholar]
- Castello ML, Igual M, Fito PJ, Chiralt A. Influence of osmotic dehydration on texture, respiration and microbial stability of apple slices (Var. Granny Smith) J Food Eng. 2009;91(1):1–9. doi: 10.1016/j.jfoodeng.2008.07.025. [DOI] [Google Scholar]
- Castello ML, Heredia A, Domínguez E, Ortola MD, Tarrazo J. Influence of thermal treatment and storage on astringency and quality of a spreadable product from persimmon fruit. Food Chem. 2011;128(2):323–329. doi: 10.1016/j.foodchem.2011.03.023. [DOI] [PubMed] [Google Scholar]
- Chandran J, Nish P, Singhal RS, Pandit AB. Degradation of colour in beetroot (Beta vulgaris L.): a kinetics study. J Food Sci Technol. 2014;51(10):2678–2684. doi: 10.1007/s13197-012-0741-9. [DOI] [PMC free article] [PubMed] [Google Scholar]
- Contreras C, Martin-Esparza ME, Chiralt A, Martinez-Navarrete N. Influence of microwave application on convective drying: effects on drying kinetics and optical and mechanical properties of apple and strawberry. J Food Eng. 2008;88(1):55–64. doi: 10.1016/j.jfoodeng.2008.01.014. [DOI] [Google Scholar]
- Feng X, Wenxue Z, Yuanyuan Q, Huaibin K. Optimization of demineralization on Cyprinus carpio haematopterus scale by response surface methodology. J Food Sci Technol. 2015;52(3):1684–1690. doi: 10.1007/s13197-013-1164-y. [DOI] [PMC free article] [PubMed] [Google Scholar]
- Forni E, Sorman A, Scalise S, Torreggiani D. The influence of sugar composition on the color stability of osmodehydrofrozen intermediate moisture apricots. Food Res Int. 1997;30(2):87–94. doi: 10.1016/S0963-9969(97)00038-0. [DOI] [Google Scholar]
- Gokhale SV, Lele SS. Dehydration of red beet root (Beta vulgaris) by hot air drying: process optimization and mathematical modelling. Food Sci Biotechnol. 2011;20(4):955–996. doi: 10.1007/s10068-011-0132-4. [DOI] [Google Scholar]
- Igual M, Garcia-Martinez E, Camacho MM, Martinez-Navarrete N. Jam processing and storage effects on β-carotene and flavonoids content in grapefruit. J Funct Foods. 2013;5(2):736–744. doi: 10.1016/j.jff.2013.01.019. [DOI] [Google Scholar]
- Ismail A, Marjan ZM, Foong CW. Total antioxidant activity and phenolic content in selected vegetables. Food Chem. 2004;87:581–586. doi: 10.1016/j.foodchem.2004.01.010. [DOI] [Google Scholar]
- Kanner J, Harell S, Granit R. Betalains—a new class of dietary cationized antioxidants. J Agric Food Chem. 2001;49:5178–5185. doi: 10.1021/jf010456f. [DOI] [PubMed] [Google Scholar]
- Kilcast D, Subramaniam P. Introduction. In: Kilcast D, Subramaniam P, editors. The stability and shelf life of food. Boca Raton: Woodhead Publishing Limited; 2004. pp. 1–22. [Google Scholar]
- Kou Y, Ross EW, Taub IA. Micro-structural domains in foods: effects of constituents on the dynamics of water in dough, as studied by magnetic resonance spectroscopy. In: Levine H, editor. Amorphous food and pharmaceutical systems. Cambridge: Royal Society of Chemistry; 2002. pp. 48–58. [Google Scholar]
- Labuza TP, Saltmarch M. The non enzymatic browning reaction as affected by water in foods. In: Rockland LB, Stewart GF, editors. Water activity: influences on Food Quality. New York: Academic Press; 1981. pp. 605–650. [Google Scholar]
- Larmond E. Laboratory methods for sensory evaluation of foods. Ottawa: Canada Department of Agricultural Publication; 1977. p. 1637. [Google Scholar]
- Lavelli V, Corey M, Kerr W, Vantaggi C. Stability and anti-glycation properties of intermediate moisture apple products fortified with green tea. Food Chem. 2011;127(2):589–595. doi: 10.1016/j.foodchem.2011.01.047. [DOI] [PubMed] [Google Scholar]
- Loveday SM, Hindmarsh JP, Creamer LK, Singh H. Physicochemical changes in intermediate-moisture protein bars made with whey protein or calcium caseinate. Food Res Int. 2010;43:1321–1328. doi: 10.1016/j.foodres.2010.03.013. [DOI] [Google Scholar]
- Mishra BB, Gautam S, Chander R, Sharma A. Characterization of nutritional, organoleptic and functional properties of intermediate moisture shelf stable ready-to-eat Carica papaya cubes. Food Biosci. 2015;10:69–79. doi: 10.1016/j.fbio.2015.02.001. [DOI] [Google Scholar]
- Mridula D, Gupta RK, Bhadwal S, Khaira H, Tyagi SK. Optimization of food materials for development of nutritious pasta utilizing groundnut meal and beetroot. J Food Sci Technol. 2016;53:1834–1844. doi: 10.1007/s13197-015-2067-x. [DOI] [PMC free article] [PubMed] [Google Scholar]
- Packer VG, Melo PS, Bergamasch K, Selani MM, Villanueva ND, de Alencar SM, Contreras-Castillo CJ. Chemical characterization, antioxidant activity and application of beetroot and guava residue extracts on the preservation of cooked chicken meat. J Food Sci Technol. 2015;52(11):7409–7416. doi: 10.1007/s13197-015-1854-8. [DOI] [Google Scholar]
- Panwar S, Gehlot R, Siddiqui S. Effect of osmotic agents on intermediate moisture aonla segments during storage. Int J Agric Food Sci Technol. 2013;4(6):537–542. [Google Scholar]
- Parn OJ, Bhat R, Yeoh TK, Al-Hassan AA. Development of novel fruit bars by utilizing date paste. Food Biosci. 2015;9:20–27. doi: 10.1016/j.fbio.2014.11.002. [DOI] [Google Scholar]
- Pitalua A, Jimenez E, Vernon-Carter C, Beristain C. Antioxidative activity of microcapsules with beetroot juice using gum Arabic as wall material. Food Bioprod Proc. 2010;88:253–258. doi: 10.1016/j.fbp.2010.01.002. [DOI] [Google Scholar]
- Saxena A, Bawa AS, Raju PS. Phytochemical changes in fresh-cut jackfruit (Artocarpus heterophyllus L.) bulbs during modified atmosphere storage. Food Chem. 2009;115(4):1443–1449. doi: 10.1016/j.foodchem.2009.01.080. [DOI] [Google Scholar]
- Sharma P, Ramchiary M, Samyor D, Das AB. Study on the phytochemical properties of pineapple fruit leather processed by extrusion cooking. LWT-Food Sci Technol. 2016 [Google Scholar]
- Singleton VL, Orthofer R, Lamuela-Raventos RM. Analysis of total phenol and other oxidation substrates and antioxidants by means of Folin-Ciocalteu reagent. Methods Enzymol. 1999;299:152–178. doi: 10.1016/S0076-6879(99)99017-1. [DOI] [Google Scholar]
- Stintzing FC, Schieber A, Carle R. Evaluation of colour properties and chemical quality parameters of cactus juices. Euro Food Res Technol. 2003;216(4):303–311. [Google Scholar]
- Sun-Waterhouse D, Teoh A, Massarotto C, Wibisono R, Wadhwa S. Comparative analysis of fruit-based functional snack bars. Food Chem. 2010;119:1369–1379. doi: 10.1016/j.foodchem.2009.09.016. [DOI] [Google Scholar]
- Taoukis PS, Richardson M. Principles of intermediate-moisture foods and related technology. In: Barbosda-Canovas GV, Fontana AJ, Schmidt SJ, Labuza TP, editors. Water activity in foods: fundamentals and applications. Ames: Wiley-Blackwell; 2007. pp. 273–312. [Google Scholar]
- Wadikar DD, Majumdar TK, Nanjappa C, Premavalli KS, Bawa AS. Development of shelf stable pepper based appetizers by response surface methodology (RSM) LWT-Food Sci Technol. 2008;41(8):1400–1411. doi: 10.1016/j.lwt.2007.09.005. [DOI] [Google Scholar]
- Yan Z, Sousa-Gallagher MJ, Oliveira FAR. Identification of critical quality parameters and optimal environment conditions of intermediate moisture content banana during storage. J Food Eng. 2008;85:163–172. doi: 10.1016/j.jfoodeng.2007.06.034. [DOI] [Google Scholar]
- Zhishen J, Mangcheng T, Jianming W. The determination of flavonoid contents in mulberry and their scavenging effects on superoxide radicals. Food Chem. 1999;64:555–559. doi: 10.1016/S0308-8146(98)00102-2. [DOI] [Google Scholar]