

Abstract
Protein beverages have been in demand due to an increasing consumers’ interest in healthy eating habit. However, there is an increased concern on the use of genetic modified (GM) ingredient in the food product. This study aimed to develop protein hydrolysate beverages using a non-GM soybean (R08-4004/high protein line) grown in Arkansas. Protein isolate was prepared from the soybean using alkaline method (pH 9.5). Due to its poor solubility in acidic condition, alcalase 2.4 L (food grade protease) hydrolyzed soy protein was used to develop a beverage containing 20 g protein per serving (500 mL). Three flavored beverages: Chai tea (C), tangerine (T), and mixed berries (MB) were prepared using bitter blocker, masking agent, and citric acid to minimize an unpleasant bitter taste developed in the soy hydrolysates. Protein solubility, pH, microbial growth, instrumental color parameters, and turbidity were measured to evaluate the shelf-life stability of the beverages at refrigerated storage (5 °C) for 42 days. Beverages T and MB received overall highest scores from the sensory panel. Citric acid alone or in combination with bitter blocker or masking agent lowered the bitterness. Pasteurization (90–95 °C for 5 min) was effective in preventing microbial growth. Although pH remained constant, decrease in protein solubility and color changes were observed over the storage time in all the three flavored beverages. Cloudiness in beverage C increased over the storage period while beverages T and MB were very stable. Overall, T and MB flavored beverages have the potential for commercial application.
Keywords: High protein beverage, Soy protein hydrolysate, Bitter masking, Sensory evaluation, Shelf life
Introduction
Since the Food and Drug 21 Administration (FDA) approved the claim about the association between soy protein and the 22 reduced risk of coronary heart disease (CHD), consumption of soy-containing foods remarkably increased in the US (D’Adamo 2014). There is an increase demand and a market in protein-based beverages worldwide. Accordingly, the protein drink segment is expected to have the highest forecasted growth rate of 90 % and reach US $4.1 billion through the year 2018 due to continuing consumer interest in healthy and nutritious eating habits (Levesque 2014). Protein products have also become popular as ready-to-drink protein beverages, which are more appealing to time-crunched individuals who are also looking to improve their diets. Soybean is one of protein plant sources that contain all nine essential amino acid at levels as high as those from meat, milk, and egg (Ang et al. 1985; Tockman 2002). However, native soy proteins cannot be used effectively as a supplement in beverages, especially acidic beverages, since it is largely insoluble and separates on storage (Cho et al. 2008). Clarity is a challenge when formulating high-protein drinks since insolubility of native protein isolate is undesirable to consumers (Cho et al. 2008). Previous research has shown that hydrolysates prepared from soy protein have better solubility and applicability in high protein products (Wu et al. 1998; Lee 2011; Nguyen et al. 2016; Meinlschmidt et al. 2016). In addition, interest in protein hydrolysate incorporation in nutritional products has been increasing due to their effective digestion and faster gastrointestinal absorption compared to intact protein or free amino acids (Sun 2011).
Another challenge faced by beverage developers when working with soy protein is lack of appealing flavor and presence of bitter taste (MacLeod 1988; Marinova et al. 2008; Sun 2011). Bitterness has been a major limitation in utilizing protein hydrolysates in various products, especially in beverages (Cho et al. 2004). There are several methods to reduce or minimize bitterness of soy protein hydrolysates for food product application. This includes controlled hydrolysis, elimination of bitter peptides, exo-peptidase treatment, and the use of bitter blocking compounds as well as taste signaling modification (Sun 2011). Each bitterness elimination method has advantages and limitations for applications, conversely a combined approach may be used to minimize any disadvantages that come along with each bitter removal technique. Use of appropriate bitter blocker agents along with sweeteners and flavor agents can overcome the unpleasant taste of soy protein hydrolysates (Sun 2011).
Alcalase, a protease from Bacillus licheniformis, is the most common alkaline endopeptidase used for hydrolysis of food proteins for a wide variety of purposes (Vioque et al. 2000). This enzyme cleaves most peptide bonds on the carboxyl side of hydrophobic amino acid residues and is widely used to prepare protein hydrolysates from various proteins including soy protein (Nguyen et al. 2016). One of the purposes of using an alcalase hydrolysis, especially for preparation of soy protein hydrolysates is to obtain more soluble protein hydrolysates in a wide range of pH, particularly at mild acidic condition (Nguyen et al. 2016). However, undesirable bitter peptides might be formed in the hydrolysate that have an adverse effect to its taste for their application in acidic beverages. To validate the marketability of this alcalase soy hydrolysate in new food products, its physicochemical properties, sensory acceptability, and shelf-life aspect should be tested (Brown 2011). Instrumental techniques can be used to analyze changes in physicochemical parameters including color, pH, and turbidity as well as microbial activity (Brown 2011). Consumer acceptance and preference sensory test have been used as essential tools to evaluate the sensory attributes of new products as well as to ensure that the optimal final product formula has been achieved (Lawless and Heymann 2010; Fuller 2011).
The preliminary study showed that even though the hydrolysis was controlled and limited to minimize bitter taste peptides with better solubility at acidic condition it still has a bitter taste. This may have an adverse effect on the consumer acceptability of the protein beverage product using this SPH, and hence the need to develop a protein beverage formulation to mask bitterness. The objectives of this study were to determine shelf stability, sensory acceptability, and physicochemical properties of a protein-rich (20 g/serving) drink developed utilizing soy protein hydrolysate, prepared from non-GM soybean cultivar (R08-4004). Taking into account consumers’ growing interest for non-genetically modified (non-GM) soy-based protein products, the basic premise for developing this drink, is to demonstrate the ability of the non-GM soybean cultivar (R08-4004) to produce protein-based products with reduced/no bitterness.
Materials and methods
Materials and reagents
Soybean seeds (var. R08-4004/non-GM and high protein line) to prepare soy protein isolate (SPI) was provided by the Department of Crop, Soil, and Environmental Sciences, University of Arkansas, Fayetteville, AR, USA. Alcalase 2.4 L (a food grade protease from Bacillus licheniformis, activity 2.4 AU/g) was obtained from Novozyme Inc. (Bagsvaerd, Denmark). Natural mixed berries flavor, bitter blocker (BB), and masking agent (MA) were provided by Blue Pacific Flavors Inc., (City of Industry, CA, USA). Other natural color and flavor agents were provided by Carmi Flavor & Fragrance Co. (Commerce, CA, USA) and D. D. Williamson & Co., Inc. (Louisville, KY, USA). Stevia (sweetener) was purchased from Ziki’s TEAki Hut LLC (East York, PA, USA), while Truvia® (Cargill, Minneapolis, MN, USA), Chai tea, and citric acid were purchased from a local food store. All other chemicals (analytical grade) were procured from VWR (Radnor, PA, USA), Sigma Aldrich (St. Louis, MO, USA), and Fisher Scientific (Pittsburg, PA, USA).
Preparation of soy protein isolate (SPI) and soy protein hydrolysate (SPH)
SPI was prepared using an aqueous extraction method adopted from Rayaprolu et al. (2013), while enzyme digested SPH was prepared following Nguyen et al.’s (2016) method. It gave 26 % DH (low molecular size peptides; <17 kDa) with the highest soluble protein yield (43 %) and lower surface hydrophobicity and bitter taste. Briefly, defatted soybean flour in deionized (DI) water (1:10 w/w) was adjusted to pH 9.5 to dissolve the protein. The solubilised protein was separated from other insoluble components by centrifugation (3000g for 20 min). The extracted protein was isoelectrically precipitated at pH 4.5 from the solution and then centrifuged followed by washing and freeze-drying to obtain SPI. For hydrolysis, SPI was dispersed in DI water (1:10 w/v), adjusted to pH 7.0, and pre-incubated to 50 °C. The protein dispersion was added to alcalase to achieve the enzyme level of 1.0 AU (3.2 µL/g), and incubated for 120 min at temp of 50 °C. The enzyme activity was inactivated at 90 °C and kept for 5 min followed by cooling to ambient temperature before centrifugation. The supernatant was freeze dried and ground to get a fine SPH for further analysis.
Protein solubility
Solubility of SPI and SPH as a function of pH was determined using a method developed by Bera and Murkherjee (1989). One gram of protein samples were dispersed in 25 mL of deionized (DI) water and adjusted to pHs ranging from 3.0 to 11.0 with either NaOH (0.1 N or 1.0 N) or HCl (0.1 N or 1.0 N). The dispersions were stirred at ambient temperature for 30 min and centrifuged at 10,000g for 10 min. The soluble protein contents of supernatants were determined by a Biuret spectrometric method. The percent protein solubility was calculated as follows: Solubility (%) = (protein content in supernatant/total protein content in sample) × 100.
Bitterness masking study using Box–Behnken statistical design
A Box–Behnken design (BBD) from JMP Pro 12.0 (at P value <0.05) was used to minimize the surface hydrophobicity (S0) of SPH solution containing BB, MA, and stevia since the bitterness of proteins is directly proportional to their S0 values (Wu et al. 1998). The concentration of BB, MA, and Stevia in SPH solution were selected as independent variables (coded: X1, X2, and X3 respectively) and incorporated in the BBD with S0 as the dependent variable (Y). Each coded factor was prescribed into three levels coded as −1, 0, and +1 representing for low, intermediate, and high values respectively. S0 was determined by a hydrophobic fluorescence probe binding method using 1-anilino-8-naphthalene sulfonate (ANS) as described by Hayakawa and Nakai (1985). The effects of different concentrations of the three factors (BB, MA, and Stevia) on the S0 of SPH solution (4 % w/v) were analyzed. The experimental values of S0 were fitted into a full quadratic second-order polynomial equation by applying multiple regression analysis.
Beverage formulations
Three types of protein drinks were prepared in predetermined proportions using laboratory scale trials to optimize the formula for sensory and shelf stability evaluations. The drinks were prepared using 2 different bases: distilled water for tangerine flavor (beverage T) and mixed berries flavor (beverage MB), and brewed tea for Chai tea flavor (beverage C). Beverage MB was prepared with BB, MA, and sweetener based on their optimum levels with a minimum S0 value. Beverage T was prepared with the lowest bitterness using citric acid that could mask the bitter note and tangerine natural flavor, while beverage C was developed based on the hypothesis that the bitter note derived from SPH could be harmonized with the expectable astringency and bitter carrier such as a tea drink. A control formula was also prepared with no additional flavor for comparison. The 4 beverages (including control) were prepared with the freeze dried SPH powder by slowly adding into distilled water or brewed tea while stirring. The sweetener, natural color and flavor agents were added as required for each formulation. The drink was mixed for 2–3 min to obtain a homogenous product. These freshly prepared drinks were filled into pre-sterilized glass bottle and pasteurized at 90–95 °C with a 5 min holding time. The drinks were cooled to ambient temperature and stored in a refrigerator (5 °C). Formulations for all the beverages are shown in Table 1.
Table 1.
Formulas of flavored soy protein hydrolysate (SPH) beverages
| Formula | Ingredient | Weight (g) | Percentage (w/w) |
|---|---|---|---|
| Control | Distilled water | 462.3 | 92.46 |
| SPHa | 22.7 | 4.54 | |
| Truvia | 15.0 | 3.00 | |
| Total | 500.0 | 100.0 | |
| Chai tea (C) flavor | Brewed Chai tea | 462.3 | 92.46 |
| SPHa | 22.7 | 4.54 | |
| Truvia | 15.0 | 3.00 | |
| Total | 500.0 | 100.0 | |
| Tangerine (T) flavor | Distilled water | 452.8 | 90.56 |
| SPHa | 22.7 | 4.54 | |
| Truvia | 15.0 | 3.00 | |
| Tangerine flavor agent | 4.5 | 0.90 | |
| Annatto color agent | 2.5 | 0.50 | |
| Citric acid | 2.5 | 0.50 | |
| Total | 500.0 | 100.0 | |
| Mixed berries (MB) flavor | Distilled water | 440.7 | 88.14 |
| SPHa | 22.7 | 4.54 | |
| Truvia | 15.0 | 3.00 | |
| Bitter blocker | 7.3 | 1.46 | |
| Masking agent | 5.0 | 1.00 | |
| Berries flavor agent | 5.0 | 1.00 | |
| Cochinal color agent | 3.0 | 0.60 | |
| Citric acid | 1.3 | 0.26 | |
| Total | 500.0 | 100.0 |
aProtein content of SPH = 88.3 %; 22.7 g SPH was added to achieve 20 g of protein per serving (500 mL) of the final beverage products
Sensory evaluation
Sensory evaluation of the flavored SPH beverages was conducted at the University of Arkansas Sensory Science Center (Fayetteville, AR, USA). A total of 61 untrained consumers (27 females and 34 males) ranging in age from 19 to 50 years (31 ± 7.8 years) participated in the sensory evaluation. All participants had neither clinical history of major diseases (e.g., diabetes, cancer, cardiovascular disease, or renal disease) nor allergy to soy products. The protein beverages were prepared one day before the scheduled date for sensory evaluation and kept in the refrigerator (4 ± 0.5 °C). Approximately 20 mL of each beverage was placed in a soufflé cup (60 mL), identified with a 3-digit code, and covered with a plastic transparent lid. The participants evaluated all four beverages for appearance, odor, flavor, mouthfeel, and overall acceptance on 9-point hedonic scales ranging from 1 (“dislike extremely”) to 9 (“like extremely”). In addition, three sensory attributes, i.e., color, sweetness, and bitterness, were also evaluated using a 5-point “Just-About-Right” (JAR) scale (1 = “much too light/much too weak”, 3 = “JAR”, 5 = much too dark/much too strong”). Between each sample, panelists were asked to take a short 30 s break for palate cleansing with spring water and unsalted crackers.
Shelf stability
The three beverages (beverages T, MB, and C) were prepared and stored at 5 °C for 42 days for shelf life tests. Microbiological and physicochemical characteristics were analyzed at day 1 before pasteurization (BP) and after pasteurization (AP) and throughout the shelf life period in biweekly intervals at day 14, 28, and 42. Microbiological evaluation included total plate count (TPC), and yeast and mold count. Tryptic soy agar (TSA) and potato dextrose agar (PDA) (Becton–Dickinson, Fraknlin Lakes, NJ, USA) were used for TPC and yeast and mold count, respectively. One hundred microliters of each sample were spread-plated onto either TSA or PDA plates after serial dilutions and incubated at 35 °C for 48 h and 25 °C for 72 h, respectively (Luvonga 2012). The colonies were counted and recorded as colony forming units (CFU) per mL.
A Biuret method was used to determine the soluble protein content of samples during the storage. The turbidity or cloudiness was determined using a UV–Vis spectrophotometer (Shimadzu Model UV-1601, Kyoto, Japan) at 500 nm (Jiang et al. 2010; Lee 2011). All sample were vortexed before testing.
The color change in the beverage samples were evaluated using an “, , and ” Hunter Lab system. The value represents the lightness (0 = black and 100 = white), axis represents redness () or greenness (), and axis represents yellowness () or blueness (). The instrument (CR-300, Minolta Co., Ltd., Osaka, Japan) was calibrated with a standard white tile before the sample color readings. The recorded values were converted into (total color difference) according to the following equation (Calvo 2004):
; ; and .
Reference values were the values from the fresh beverages prepared on day 1 before pasteurization and sample values were the values from the beverages after pasteurization at various storage days (1–42). The values which were the color differences of the beverages between AP and BP over the storage period were classified as “not noticeable” (0 < < 0.5), “slightly noticeable” (0.5 < < 1.5), “noticeable” (1.5 < < 3.0), “well visible” (3.0 < < 6.0), and “great” (6.0 < < 12.0) (Cserhalmi et al. 2006).
The pH of the samples (vortexed for homogeneity) was recorded using a pH meter (Orion 210A, Orion Research Inc., Boston, MA, USA).
Statistical analysis
Data from all the studies were subjected to one-way analysis of variance (ANOVA) using JMP Pro 12.0 software and reported as means of triplicate observations ± standard derivation. BBD was analyzed using a polynomial model equation for S0 as follows:
where Y is the predicted response (S0); β0 is the model constant (intercept); β1, β2, and β3 are linear coefficients; X1, X2, and X3 are the coded levels of independent variables; β12, β13, and β23 are cross-product coefficients; X1X2, X1X3, and X2X3 are the interaction of independent variables’ coded levels; β11, β22, and β33 are the quadratic coefficients; and , , and are the quadratic terms. In addition, the quality of fit of the polynomial model equation was expressed by the coefficient of determination R 2.
For sensory evaluation data, a two-way ANOVA treating sample type and panelist as a fixed and a random effect respectively, was used to determine the variation due to sensory appeal among the protein beverages. If a significant difference of means was determined, post hoc comparisons between independent variables were conducted using a Tukey’s honestly significant difference (HSD) test. A statistically significant difference was defined at P < 0.05.
Results and discussion
Protein solubility
The profiles of SPI and SPH’s solubility in the pH range between 3.0 and 11.0 were compared as shown in Fig. 1. SPI had the lowest solubility (0.9 %) at pH 5 and the highest (93.1 %) at pH 10 while SPH had the lowest solubility (48.7 %) at pH 4 and the highest (98.3 %) at pH 7. These results show that SPH has significantly higher solubility than SPI in the pH range 3–11 evaluated (P < 0.0001). Both SPI and SPH had relatively low solubility at pH 4.5 (isoelectric point) and higher solubility values at extreme pH values of 3 and 11. The differences in solubility between SPI and SPH can be explained by the hydrolysis process which exposed SPH hydrophobic portions of the protein structure to a larger extent. The solubility profiles of soy protein has been reported in several studies (Ruíz-Henestrosa et al. 2008; Bae et al. 2012). As the pH changed, the hydrophobic amino acids were exposed at the isoelectric point which allowed the protein particles to dissociate from water (Boye et al. 2010). Solubility of both SPI and SPH improved at alkaline pH with the highest solubility (98.3 %) for SPH at pH 7. The higher solubility of SPH is applicable in the beverage preparation.
Fig. 1.

Solubility (%) of soy protein isolate (SPI) and soy protein hydrolysate (SPH) as a function of pH. Values are presented as mean ± SD of triplicate determinations and those not connected with same letters are significantly different at P < 0.05
Optimization to minimize surface hydrophobicity
Box–Behnken design was used to find the optimal combination of BB (X1), MA (X2), and Stevia (X3) for minimizing S0 which is directly proportional to lowering bitterness (Wu et al. 1998), particularly in preparing a mixed-berry flavored drink. The experimental values of S0 were fitted into a full quadratic second-order polynomial equation. The regression coefficients were obtained to predict the polynomial model for S0 when the values of BB, MA, and Stevia were substituted in the equation below:
Bitter blocker showed significant linear and quadratic effects in reducing the S0 of 4 % SPH solution (P < 0.0001), while Stevia and MA showed only linear effects (P < 0.0001). The combination treatments including (BB × MA), (BB × Stevia) and (MA × Stevia) were statistically significant (P < 0.001) according to the model. The contour plot of the response surface showed that BB was most efficient in reducing the S0 of the SPH solution while Stevia had a minor effect. The model capability was examined using the F-test where ANOVA showed that the regression model was highly significant (P < 0.001). An optimal combination of BB, MA, and Stevia was obtained by solving the above regression equation. The prediction profiler (Fig. 2) showed a minimum S0 value of 9161.8 with the corresponding optimal combination of 1.46 % BB, 1.0 % MA, and 0.02 % Stevia.
Fig. 2.

Prediction profiler of bitter blocker (BB), masking agent (MA), and Stevia concentrations (%) on surface hydrophobicity (S0) in soy protein hydrolysate (SPH) solutions from Box–Behnken design (BBD); each treatment level was conducted in triplicates
During the preliminary test, an increase in the bitter note of 4 % SPH solution was observed; this increase could be due to the increase in Stevia level higher than 0.02 % for sweeter taste. Hence, 0.02 % (w/w) pure Stevia powder was replaced with Truvia®, which is commercially available with its ingredients consisting of erythritol, Stevia leaf extract, and natural flavors. This improved the sweetness without increasing the caloric content in the beverages (Persinger 2014). Erythritol, an alcohol sugar [(2R,3S)-butane-1,2,3,4-tetraol] naturally presents in melons and peaches in small quantities, is accepted as a sugar-replacement due to its low-calories, tooth-friendly, zero toxic effect, and off-taste masking effect (Hartog et al. 2010).
Sensory evaluation
The overall appearance of 4 beverages, including C, MB, T, and control, significantly varied according to the sensory panel evaluations (P < 0.0001). Panelists liked the appearance of beverages MB and T the most among the 4 beverages tested (Table 2). In addition, the panelists noted significant differences in flavor attribute (P < 0.0001), and overall, the panel liked better the flavor of beverage T. The 4 soy protein beverages significantly differed (P < 0.0001) with respect to oral tactile attribute (mouth-feel) which was enhanced with the addition of flavors (Table 2). The panelists liked the mouth-feel of beverage T overall the most.
Table 2.
9-point hedonic and 5-point “Just-About-Right” (JAR) scales as a function of flavored soy protein hydrolysate (SPH) beverages
| Attributes | Mixed berries flavor | Tangerine flavor | Chai tea flavor | Control | P value |
|---|---|---|---|---|---|
| 9-point hedonic scale | |||||
| Overall appearance | 7.1 ± 0.2a | 7.2 ± 0.1a | 3.9 ± 0.2c | 6.3 ± 0.2b | <0.0001 |
| Odor impression | 7.0 ± 0.2a | 7.3 ± 0.1a | 5.6 ± 0.3b | 4.5 ± 0.2c | <0.0001 |
| Flavor impression | 5.2 ± 0.3b | 6.4 ± 0.2a | 3.8 ± 0.3c | 2.9 ± 0.2d | <0.0001 |
| Oral tactile | 5.9 ± 0.2b | 6.3 ± 0.2a | 5.0 ± 0.2c | 4.1 ± 0.2d | <0.0001 |
| Overall impression | 5.4 ± 0.2b | 6.5 ± 0.2a | 3.8 ± 0.2c | 3.1 ± 0.2d | <0.0001 |
| 5-point JAR scale | |||||
| Color impression | 3.0 ± 0.1b | 3.1 ± 0.0b | 4.1 ± 0.1a | 2.5 ± 0.1c | <0.0001 |
| Sweetness | 2.9 ± 0.1a | 2.9 ± 0.1a | 2.1 ± 0.1b | 1.4 ± 0.1c | <0.0001 |
| Bitterness | 3.4 ± 0.1b | 3.1 ± 0.1b | 3.9 ± 0.1a | 4.0 ± 0.1a | <0.0001 |
Values are presented as mean ± SD of triplicate analysis and those not connected with same letters in the same column are significantly different at P < 0.05
As shown in Table 2, the participants rated the color attribute of the control beverage as too light, while that of MB and T were recorded as ‘just-about-right.’ The color impression of beverage C was rated as too dark, which was implicit due to its formulation using prepared tea beverage. The 4 soy protein beverages significantly differed with respect to sweetness and bitterness (P < 0.0001). Panelists rated the sweetness of beverages T and MB as ‘just-about-right’ in comparison to control (‘too little’). The control beverage was also rated as ‘too much’ for bitterness. However, bitterness for beverage T or MB was rated as ‘JAR’, indicating that the added flavors decreased the bitter intensity. The addition of citric acid for beverage T, and BB, MA and citric acid combination for beverage MB successfully reduced the bitterness of the high protein beverages. Similar results were demonstrated by Lee (2011) using alcalase-hydrolyzed soy protein formulated with lemon flavored sweet tea, indicating that citrus flavor or sour tasting ingredients might play an important role in minimizing bitter taste (Keast and Breslin 2003). Additionally, Adler-Nissen (1986) demonstrated that citric acid could mask the bitter note of hydrolyzed proteins. The 4 soy protein beverages significantly differed (P < 0.0001) with respect to oral tactile impression (mouth-feel) which was enhanced by the addition of flavors (Table 2), but overall, the participants liked the mouth-feel of beverage T. Among the three flavored beverages, Chai tea flavor was the least. It may be due to that it is not widely popular among U.S. consumers.
Shelf life evaluation
Apart from consumer acceptability, shelf life of a food product is a significant factor for its successful commercialization. Shelf life of the three SPH flavored beverages was evaluated for microbial growth, soluble protein content, pH, turbidity, and color over a period of 42 days under a refrigerated storage (5 °C) condition.
Yeast and mold were not detected on samples after pasteurization and during the storage period. The initial total bacterial counts in beverages C, MB, and T were 1.3, 1.3, and 1.2 CFU/mL, respectively, prior to thermal processing. Zero total bacterial counts were observed on samples after pasteurization and during the storage period. This demonstrated that the pasteurization process (90–95 °C for 5 min) effectively inhibited the growth of bacteria, yeast, and mold.
The pH values of the three flavored SPH beverages over the storage period were determined and the data is presented in Fig. 3a, which shows that values were stable throughout 42 days of storage period. The pH among the flavored beverages varied due to the amount of citric acid added to their formulations. Beverage C, which did not contain citric acid, had the highest pH value (pH 6.4) among the three drinks. Beverage MB that was formulated with 0.26 % w/w citric acid had a pH of 5.0 and beverage T containing 0.5 % citric acid had a pH of 4.1. The low pH of the 2 beverages had potentially assisted in inhibiting bacterial growth.
Fig. 3.
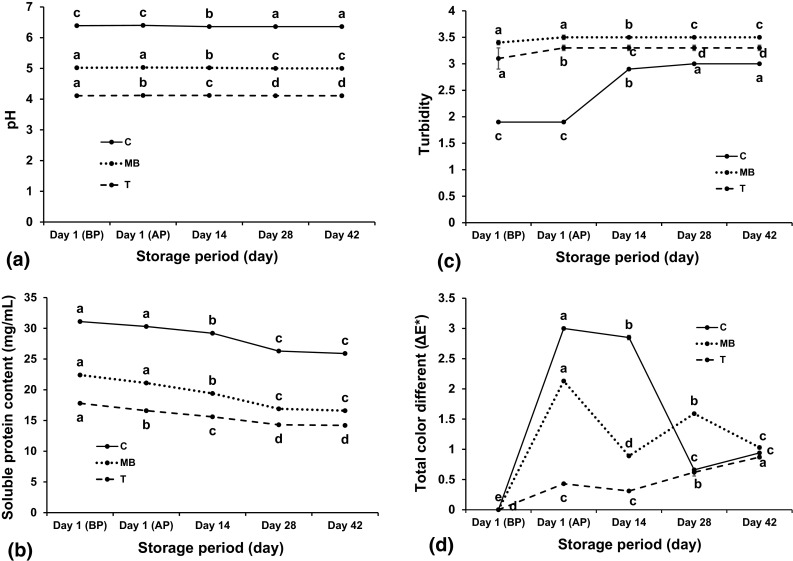
Shelf-life evaluation based on pH (a), soluble protein content (mg/mL) (b), turbidity (c), and total color different () (d) values over a storage period of three flavored soy protein hydrolysate (SPH) beverages; BP before pasteurization, AP after pasteurization; C Chai tea flavored beverage, MB mixed berries flavored beverage, T Tangerine flavored beverage. Values are presented as mean ± SD of triplicate determinations and those not connected with same letters of each beverage are significantly different at P < 0.05
The soluble protein content of the three SPH flavored beverages over the storage period are shown in Fig. 3b. The amount of SPH for preparing the three formulations was calculated as 22.7 g per 500 mL serving (based on 88.3 % protein content of SPH), which was equivalent to 45.4 mg protein/mL, to ensure the claim—20 g protein per container. At day 1 (BP), the soluble protein content of beverages C, MB, and T were 31.1, 22.4, and 17.8 mg/mL respectively. Differences in soluble protein content in among the beverages could be explained by the differences in pH. Higher pH contributed to a higher soluble protein in the product based on the solubility profile which is a function of pH that was shown in Fig. 1. In beverage C, the amount of initial soluble SPH measured at day 1 (BP) at pH 6.4 was 31.1 mg/mL (68 % solubility) that was lower than the estimated soluble SPH at the same pH (37 mg/mL; 81 % solubility) based on the solubility profile (Fig. 1). The presence of phenolic compounds in the tea base is expected to contribute to this change in solubility. The interactions between black tea tannin compounds, particularly theaflavins and thearubigins, with proteins are known to form insoluble complexes and decrease protein solubility (Frazier 2012; Ozdal et al. 2013). An insignificant difference was found in the soluble protein content of beverage C at day 1 before and after pasteurization which was 31.1 and 30.3 mg/mL respectively (P = 0.0970). Over the storage period, the soluble protein content in the beverage C decreased significantly (P < 0001) during day 14–28 storage from 29.2 to 26.3 mg/mL and remained stable until day 42 (25.9 mg/mL). In beverage MB, the amount of initial soluble SPH measured at day 1 BP at pH 5.0 was 22.4 mg/mL (48 % solubility) that was lower than the estimated soluble SPH of at the same pH which was 25 mg/mL (56 % solubility) as observed in Fig. 1. This could be due to the interactions between compounds found in BB and MA with the protein, leading to the lowered protein solubility. Similar to beverage C, an insignificant difference was observed in the soluble protein content of beverage MB before and after pasteurization (P = 0.0998), but dropped significantly from day 14 to 28 which was 19.4 and 16.9 mg/mL respectively, and was stable until day 42 (16.6 mg/mL). In beverage T, the amount of soluble SPH at day 1 BP (pH 4.1) was 17.8 mg/mL (40 % solubility) which was slightly lower than the estimated value at same pH (22 mg/mL; 49 % solubility) derived from Fig. 1. This beverage has a pH value close to the isoelectronic point (pI is at pH 4) of SPH that could explain the lowest soluble protein among the three formulations. Unlike the other two flavors, the soluble protein content of beverage T significantly decreased to 16.6 mg/mL after pasteurization (P = 0.0018). Throughout the storage period the soluble protein content of beverage T continued to drop—15.6 mg/mL on day 14 (P = 0.0030) and 14.3 mg/mL at day 28 (P = 0.0013), but remained stable until day 42 (14.2 mg/mL) (P = 0.6140). Overall significance of this study is that the soluble protein content over the storage time in the three beverage formulations stabilized from day 28 of storage. The effect of pH played an important role in protein solubility during the storage period; high-acid beverages T and MB had lower soluble protein content while low-acid beverage C had higher soluble protein content.
The turbidity values of the three SPH flavored beverages over the storage period are shown in Fig. 3c. Turbidity is supposed to be directly proportional to the amount of SPH that precipitated over the storage period. Among the three formulations, the turbidity values of beverage C were the lowest but increased significantly from 1.9 at day 1 (BP), 2.9 at day 14 (P < 0.0001) and 3.0 at day 28 (P = 0.0133). The turbidities of beverages T and MB were 3.1 and 3.5 respectively, which did not change (P = 0.4609 and 0.0438 respectively) throughout the storage study. Turbidity is supposed to be directly proportional to the amount of SPH that precipitated over the storage period. This decrease of the soluble protein over the storage period was in agreement with the study on SPH fortified black tea by Lee (2011).
The color of the three SPH beverages over the storage period (day 1–42) are shown in Table 3 as , , values and Fig. 3d as value which can be classified as “not noticeable” (0–0.5), “slightly noticeable” (0.5–1.5), “noticeable” (1.5–3.0), “well visible” (3.0–6.0), and “great” (6.0–12.0). In beverage C, values (Fig. 3d) showed significant differences throughout the storage time (P < 0.0001), with most noticeable changes in total color during the last 14 days (from day 28 to 42) of storage (0.5 < = 0.87 < 1.5). The slightly noticeable color change in beverage C could be due to the accumulation of brown-dark/reddish colored pigment compounds found in Chai tea, such as theaflavins and thearubigins (Harbowy and Baletine 1997). In beverage MB, the values increased significantly throughout the storage time (P < 0.0001) and indicated that noticeable changes in color were observed after pasteurization (1.5 < = 2.13 < 3.0) and at day 28 (1.5 < = 1.59 < 3.0). Slightly noticeable change in color was observed at day 14 (0.5 < = 0.89 < 1.5) and at day 42 (0.5 < = 1.03 < 1.5). The noticeable color changes of beverage MB was expected since the stability of natural color, particularly cochineal, was generally lower than that of synthetic food colors (Downham and Collins 2000). In addition, the precipitation of color and SPH after heat treatment and during the storage time might be due to the reactions between proteins and natural color compounds caused by the changes in their dissimilar colloidal matrix. As seen in the other two formulations, the in beverage T increased significantly throughout the storage time (P < 0.0001). It also indicated that visible changes in total color were observed right after pasteurization ( = 3.0 < 6.0). Other noticeable changes in color were observed at day 14 (1.5 < = 2.85 < 3.0) while slightly noticeable changes were observed at both day 28 (0.5 < = 0.66 < 1.5) and day 42 (0.5 < = 0.94 < 1.5). The wide range of the total color change for beverage T was expected due to the un-stabilized vegetable-based color, particularly annatto, used in this product.
Table 3.
Color parameters (, , ) of flavored soy protein hydrolysate beverages over the storage period (0–42 days)
| Storage time | Chai flavor | Mixed berries flavor | Tangerine flavor | ||||||
|---|---|---|---|---|---|---|---|---|---|
| Day 1 (BP) | 37.42 ± 0.02a | 0.57 ± 0.01c | 0.37 ± 0.01a | 37.03 ± 0.02e | 6.34 ± 0.02c | −2.93 ± 0.02a | 55.98 ± 0.00a | 5.42 ± 0.02e | 26.95 ± 0.01d |
| Day 1 (AP) | 37.05 ± 0.02b | 0.78 ± 0.01b | 0.39 ± 0.00a | 38.41 ± 0.01c | 6.75 ± 0.02b | −1.36 ± 0.00c | 54.48 ± 0.01b | 7.22 ± 0.00c | 28.82 ± 0.00c |
| Day 14 | 37.04 ± 0.02b | 0.79 ± 0.00b | 0.08 ± 0.00b | 38.04 ± 0.00d | 7.48 ± 0.00a | −1.01 ± 0.00e | 53.43 ± 0.02e | 6.98 ± 0.01d | 26.18 ± 0.02e |
| Day 28 | 36.55 ± 0.07c | 0.90 ± 0.01a | 0.07 ± 0.00b | 39.83 ± 0.00a | 7.43 ± 0.01a | −1.62 ± 0.00b | 54.26 ± 0.00c | 7.27 ± 0.02b | 29.45 ± 0.01b |
| Day 42 | 36.25 ± 0.02d | 0.77 ± 0.01b | 0.06 ± 0.02b | 39.43 ± 0.02b | 6.73 ± 0.02b | −1.21 ± 0.02d | 54.21 ± 0.00d | 7.72 ± 0.01a | 29.57 ± 0.00a |
| P value | <0.0001 | <0.0001 | <0.0001 | <0.0001 | <0.0001 | <0.0001 | <0.0001 | <0.0001 | <0.0001 |
Values are presented as mean ± SD of triplicate analysis and those not connected with same letters in the same column are significantly different at P < 0.05
BP before pasteurization, AP after pasteurization
Conclusion
This study demonstrated that controlled alcalase SPH from a non-GM soy cultivar has a potency to be used as an ingredient in the flavored protein drink formula. Although a decrease in protein solubility and color changes were observed during storage, overall, the protein beverages were stable without pH changes and bacterial contamination. The results of this study also showed that the use of citric acid alone or a combination of BB and MA were effective in minimizing the bitter note caused by the limited enzymatic hydrolysis. The sensory analysis showed significant differences in overall acceptability for the three flavors. Among the three flavors, tangerine flavored beverage was most preferred followed by mixed berries. Since the consumer trend for soy-based products, especially from non-GM source, has been increasing in recent years, these findings are relevant for developing formulations of protein-rich beverages. Inclusion of other consumer acceptable flavors including strawberry, blueberry, or orange with enhanced protein content, natural flavor and lowered bitterness can be part of further research.
Acknowledgments
The authors would like to thank the Arkansas Soybean Promotion Board for their funding of this research. Support was also provided by the University of Arkansas System Division of Agriculture.
Compliance with ethical standards
Conflict of interest
The authors declare no conflict of interest.
References
- Adler-Nissen J. Enzymatic hydrolysis of food proteins. New York: Elsevier; 1986. [Google Scholar]
- Ang HG, Kwik WL, Theng CY. Development of soymilk—a review. Food Chem. 1985;17:235–250. doi: 10.1016/0308-8146(85)90033-0. [DOI] [Google Scholar]
- Bae IY, Kim JH, Lee HG. Combined effect of protease and phytase on the solubility of modified soy protein. J Food Biochem. 2012 [Google Scholar]
- Bera MB, Murkherjee RK. Solubility, emulsifying, and foaming properties of rice bran protein concentrates. J Food Sci. 1989;54:142–145. doi: 10.1111/j.1365-2621.1989.tb08587.x. [DOI] [Google Scholar]
- Boye JI, Aksay S, Roufik S, Ribéreau S, Mondor M, Farnworth E, Rajamohamed SH. Comparison of the functional properties of pea, chickpea and lentil protein concentrates processed using ultrafiltration and isoelectric precipitation techniques. Food Res Int. 2010;43(2):537–546. doi: 10.1016/j.foodres.2009.07.021. [DOI] [Google Scholar]
- Brown M. Processing and food and beverage shelf life. In: Kilcast D, Subramaniam P, editors. Food and beverage stability and shelf life. 2. Cambridge: Woodhead Publishing; 2011. pp. 184–243. [Google Scholar]
- Calvo C (2004) Optical properties. In: Nollet LML (ed) Handbook of food analysis: physical characterization and nutrient analysis, vol 1, 2nd edn. Marcel Dekker, New York, pp 1–19
- Cho MJ, Unklesbay N, Hsieh FH, Clarke AD. Hydrophobicity of bitter peptides from soy protein hydrolysates. J Agric Food Chem. 2004;52:5895–5901. doi: 10.1021/jf0495035. [DOI] [PubMed] [Google Scholar]
- Cho MJ, Shen R, Mooshegian R (2008) Soy protein isolate. U.S. Patent No. 7,332,192B2. U.S. Patent and Trademark Office, Washington, DC
- Cserhalmi Z, Sass-Kiss A, Tóth-Markus M, Lechner N. Study of pulsed electric field treated citrus juices. Innov Food Sci Emerg Technol. 2006;7(1):49–54. doi: 10.1016/j.ifset.2005.07.001. [DOI] [Google Scholar]
- D’Adamo CR. Soy foods and supplementation: a review of commonly perceived health benefits and risks. Altern Ther Health Med. 2014;20(suppl 1):39–51. [PubMed] [Google Scholar]
- Downham A, Collins P. Colouring our foods in the last and next millennium. Int J Food Sci Technol. 2000;35:5–22. doi: 10.1046/j.1365-2621.2000.00373.x. [DOI] [Google Scholar]
- Frazier R. Interactions of tea tannins with proteins and their impact on food quality and health. In: Preedy V, editor. Tea in health and disease prevention. 1. Cambridge: Academic Press; 2012. pp. 1479–1490. [Google Scholar]
- Fuller WG. New food product development: from concept to marketplace. 3. Boca Raton: CRC Press; 2011. [Google Scholar]
- Harbowy M, Baletine DA. Tea chemistry. Crit Rev Plant Sci. 1997;16(5):415–480. doi: 10.1080/07352689709701956. [DOI] [Google Scholar]
- Hartog GJM, Boots AW, Adam-Perrot A, Brouns F, Verkooijen IWCM, Weseler AR, Haenen GRMM, Bast A. Erythritol is a sweet antioxidant. Nutrition. 2010;26:449–458. doi: 10.1016/j.nut.2009.05.004. [DOI] [PubMed] [Google Scholar]
- Hayakawa S, Nakai S. Relationships of hydrophobicity and net charge to the solubility of milk and soy proteins. J Food Sci. 1985;50:486–491. doi: 10.1111/j.1365-2621.1985.tb13433.x. [DOI] [Google Scholar]
- Jiang J, Xiong YL, Chen J. pH Shifting alters solubility characteristics and thermal stability of soy protein isolate and its globulin fractions in different pH, salt concentration, and temperature conditions. J Agric Food Chem. 2010;58(13):8035–8042. doi: 10.1021/jf101045b. [DOI] [PubMed] [Google Scholar]
- Keast RSJ, Breslin PAS. An overview of binary taste–taste interactions. Food Qual Prefer. 2003;14:111–124. doi: 10.1016/S0950-3293(02)00110-6. [DOI] [Google Scholar]
- Lawless HT, Heymann H. Sensory evaluation of food: principles and practices. 2. New York: Springer; 2010. [Google Scholar]
- Lee J (2011) Soy protein hydrolysate: solubility, thermal stability, bioactivity, and sensory acceptability in a tea beverage. Master’s thesis, University of Minnesota
- Levesque SD (2014) Performance food and drink—U.S—January 2014. Accessed date: 1-11-2016. Retrieved from http://academic.mintel.com/display/679959/
- Luvonga AW (2012) Nutritional and phytochemical composition, functional properties of Roselle (Hibiscus sabdariffa) and sensory evaluation of some beverages made from Roselle calyces. Master’s thesis, Jomo Kenyatta University of Agriculture and Technology
- MacLeod G. Soy flavor and its improvements. CRC Crit Rev Food Sci Nutr. 1988;27:219–379. doi: 10.1080/10408398809527487. [DOI] [PubMed] [Google Scholar]
- Marinova M, Cuc NTK, Tchorbanov B. Enzymatic hydrolysis of soy protein isolate by food grade proteinases and aminopeptidases of plant origin. Biotechnol Biotechnol Equip. 2008;22(3):835–838. doi: 10.1080/13102818.2008.10817563. [DOI] [Google Scholar]
- Meinlschmidt P, Ueberham E, Lehmann J, Schweiggert-Weisz U, Eisner P. Immunoreactivity, sensory and physicochemical properties of fermented soy protein isolate. Food Chem. 2016;205:229–238. doi: 10.1016/j.foodchem.2016.03.016. [DOI] [PubMed] [Google Scholar]
- Nguyen Q, Hettiarachchy N, Rayaprolu S, Jayanthi S, Thallapuranam S, Chen P. Physicochemical properties and ACE-I inhibitory activity of protein hydrolysates from a non-genetically modified soy cultivar. J Am Oil Chem Soc. 2016;93:595–606. doi: 10.1007/s11746-016-2801-1. [DOI] [Google Scholar]
- Ozdal T, Capanoglu E, Altay F. A review on protein–phenolic interactions and associated changes. Food Res Int. 2013;51:954–970. doi: 10.1016/j.foodres.2013.02.009. [DOI] [Google Scholar]
- Persinger P (2014) Low calorie sugar substitute composition and methods for making the same. U.S. Patent Application 14/201,432. U.S. Patent and Trademark Office, Washington, DC
- Rayaprolu SJ, Hettiarachchy NS, Chen P, Kannan A, Mauromostakos A. Peptides derived from high oleic acid soybean meals inhibit colon, liver and lung cancer cell growth. Food Res Int. 2013;50(1):282–288. doi: 10.1016/j.foodres.2012.10.021. [DOI] [Google Scholar]
- Ruíz-Henestrosa VP, Sánchez CC, Pedroche JJ, Millán F. Improving the functional properties of soy glycicin by enzymatic treatment, adsorption and foaming characteristics. Food Hydrocoll. 2008;23:377–386. doi: 10.1016/j.foodhyd.2008.03.011. [DOI] [Google Scholar]
- Sun XD. Enzymatic hydrolysis of soy proteins and the hydrolysates utilization. Int J Food Sci Technol. 2011;46:2447–2459. doi: 10.1111/j.1365-2621.2011.02785.x. [DOI] [Google Scholar]
- Tockman J. Capitalizing on increasing consumer interest in soy protein. Cereal Food World. 2002;47:172–174. [Google Scholar]
- Vioque J, Clemente A, Sánchez-Vioque R, Pedroche J, Millán F. Effect of alcalase on olive pomace protein extraction. J Am Oil Chem Soc. 2000;77:181–185. doi: 10.1007/s11746-000-0029-1. [DOI] [Google Scholar]
- Wu WU, Hettiarachchy NS, Qi M. Hydrophobicity, solubility, and emulsifying properties of soy protein peptides prepared by papain modification and ultrafiltration. J Am Oil Chem Soc. 1998;75(7):845–850. doi: 10.1007/s11746-998-0235-0. [DOI] [Google Scholar]