Abstract
In recent years, some researchers considered image color quantization as a single-objective problem and applied heuristic algorithms to solve it. This paper establishes a multiobjective image color quantization model with intracluster distance and intercluster separation as its objectives. Inspired by a multipopulation idea, a multiobjective image color quantization algorithm based on self-adaptive hybrid differential evolution (MoDE-CIQ) is then proposed to solve this model. Two numerical experiments on four common test images are conducted to analyze the effectiveness and competitiveness of the multiobjective model and the proposed algorithm.
1. Introduction
Image color quantization is one of the common image processing techniques. It is the process of reducing the number of colors presented in a color image with less distortion [1]. Most of the image color quantization methods [2–12] are essentially based on data clustering algorithms. Recently, some heuristic methods, such as genetic algorithm (GA) [13, 14], particle swarm optimization algorithm (PSO) [15–17], and differential evolution (DE) [18–21], have been employed to solve the image color quantization problems which are considered as optimization problems. Evaluation criteria, which are used as objective functions of optimization problems, often incorporate mean square-error (MSE) [22–24], intracluster distance (), and intercluster separation (d min) [25–28].
Most of the image color quantization algorithms based on heuristic methods are single-objective methods; that is, only one evaluation criterion is used. References [26–28] have used three evaluation criteria, but their three criteria have been merged to get a linear weighting objective function. In general, the objective function in any of the above algorithms holds only one evaluation criterion or a linear combination of several evaluation criteria. This paper presents the following two aspects:
Develop multiobjective model for image color quantization problems. Based on the model, we can obtain a quantized image with the smallest color distortion among those images which meet a trade-off between the optimal color gradation and the optimal color details.
Propose a multiobjective algorithm based on a self-adaptive DE for solving the multiobjective image color quantization model.
The rest of the paper is organized as follows. Section 2 establishes a multiobjective image color quantization model. Section 3 presents a multiobjective image color quantization algorithm based on self-adaptive hybrid DE (MoDE-CIQ). Experimental results and discussion on four test images are provided in Section 4. Conclusions are given in Section 5.
2. Establishment of a Multiobjective Image Color Quantization Model
2.1. Multiobjective Image Color Quantization Model
In single-objective models, mean square-error (MSE) (1) is the most popular evaluation criterion for color image quantization [29]. Intracluster distance () (2) and intercluster separation (d min) (3) come next in importance to MSE. Smaller MSE means smaller color distortion. Smaller means smoother gradation of similar colors. Larger d min means more color details to be preserved. The three evaluation criteria are expressed in the following formulas [28]:
| (1) |
| (2) |
| (3) |
Here, M × N is the size of a color image I. I(·, ·) is a pixel in I. K is a given color number of a colormap. k is the sequence number of the colors in the colormap. c k is the kth color of the colormap. k 1 and k 2 are two different sequence numbers of the colors in the colormap. C k is the cluster of all pixels in I with similar color to c k. |C k| is the number of all pixels in C k. I p is the color of a pixel in C k. d(·, ·) represents Euclidean distance.
This paper proposes a multiobjective image color quantization model which uses two evaluation criteria, and d min, as its subobjective functions. The model can be formulized as follows:
| (4) |
Here [0,255]3×K is decision space. Decision vector x is a colormap consisting of K randomly selected color triples in the color space [0,255]3. Let
| (5) |
be the kth color of the colormap. Then
| (6) |
F(x) is the objective function with the following two subobjectives:
| (7) |
This model aims to make a trade-off between minimum and d min maximum. The solution set of this multiobjective model is called Pareto set, the solutions of which could balance color gradation and color details.
Obviously, the solution with the smallest MSE in the Pareto set of the above multiobjective model corresponds to a quantized image, which holds the smallest color distortion among those images with a balance between the optimal color gradation and the optimal color details.
2.2. Conflict Detection of the Subobjective Functions
As we all know, the subobjective functions of a multiobjective model should be conflicting. This means, as two subobjectives in the above model, g 1(x) and g 2(x) should not become better simultaneously. Namely, when becomes better (smaller), d min should not also become better (larger). In this part, several experiments are conducted to show that the subobjective functions, g 1(x) and g 2(x), in the above model are obviously conflicting.
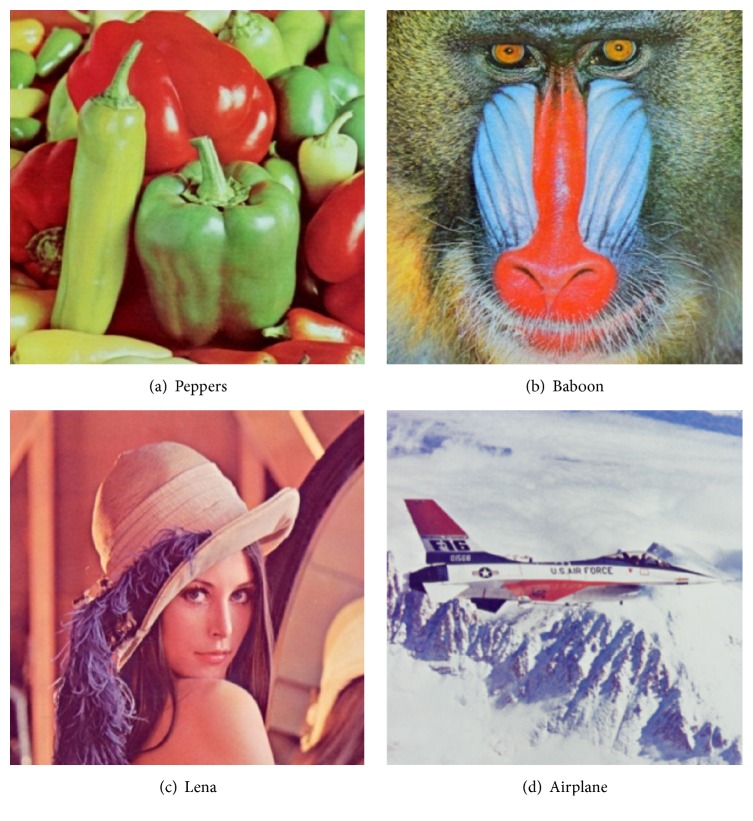
Figure 1 shows four common test images (Peppers, Baboon, Lena, and Airplane) with size 512 × 512 pixels. Reference [15] presented a color image quantization algorithm based on self-adaptive hybrid DE (SaDE-CIQ), in which the objective function is MSE. We, respectively, replace its objective with and d min to obtain two algorithms, named SaDE-CIQ1 and SaDE-CIQ2. SaDE-CIQ, SaDE-CIQ1, and SaDE-CIQ2 are implemented to quantize all test images into the quantized images with 16 colors. Each algorithm is run 10 times on each test image. In the three algorithms, there are two parameters, a maximum iteration t max and a mixed probability p. Here, t max = 200. For showing the same relation of MSE, and d min for the different values of p, we let p take three different values, 0.1, 0.05, and 0.01 in the three algorithms.
Figure 1.
Test images.
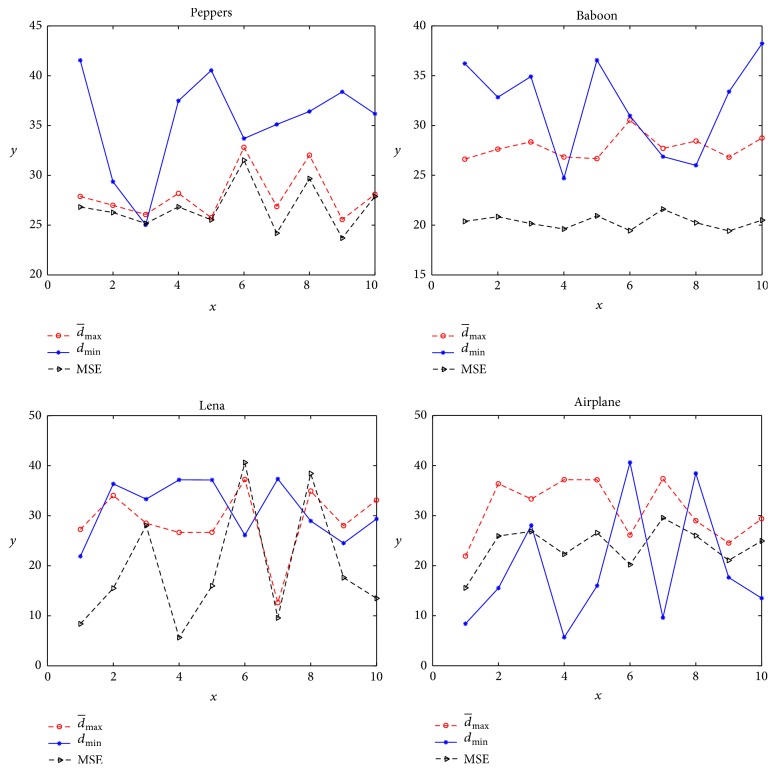
For the three algorithms with different p, we can get the similar relation of MSE, and d min. So, we only use the part results of SaDE-CIQ1 with p = 0.1 as an example to analyze the relation of MSE, and d min. By any image and its quantized image, we can calculate the values of MSE, and d min. Table 1 gives all the objective values of SaDE-CIQ1 in 10 runs and the corresponding values of MSE and d min. Figure 2 shows the changes of these values in 10 runs. We include the curves of Peppers from first run to second run as an example of how to illustrate the conflicts of MSE, and d min. When becomes better (smaller), d min does not become better (larger). When MSE becomes better (smaller), d min does not become better (larger). When becomes better (smaller), MSE also becomes better (smaller). These mean and d min are conflicting, MSE and d min are conflicting, and and MSE are not conflicting. According to the statistical analysis for all test images, there are 15 conflicts between and d min, 16 between MSE and d min, and 11 between and MSE. These statistical data show that any two of MSE, and d min, are in conflict.
Table 1.
The results of 10 runs for SaDE-CIQ1 (p = 0.1).
| Test image | Test serial number | ||||||||||
|---|---|---|---|---|---|---|---|---|---|---|---|
| 1 | 2 | 3 | 4 | 5 | 6 | 7 | 8 | 9 | 10 | ||
| Peppers | 27.8885 | 26.9858 | 26.0681 | 28.1934 | 25.7472 | 32.8054 | 26.8729 | 32.0317 | 25.5597 | 28.0979 | |
| d min | 41.5508 | 29.3541 | 25.0297 | 37.4886 | 40.54 | 33.6902 | 35.1127 | 36.4135 | 38.3825 | 36.1761 | |
| MSE | 26.8221 | 26.2667 | 25.1661 | 26.8304 | 25.5318 | 31.5104 | 24.1938 | 29.6623 | 23.7019 | 27.8777 | |
|
| |||||||||||
| Baboon | 26.6224 | 27.6260 | 28.3537 | 26.8452 | 26.6689 | 30.5386 | 27.6907 | 28.4376 | 26.8122 | 28.7434 | |
| d min | 36.2255 | 32.8375 | 34.9105 | 24.7064 | 36.5621 | 30.9652 | 26.8745 | 25.9984 | 33.4011 | 38.2255 | |
| MSE | 20.3766 | 20.8404 | 20.1511 | 19.6093 | 20.9290 | 19.4481 | 21.6021 | 20.2362 | 19.4163 | 20.5033 | |
|
| |||||||||||
| Lena | 27.2745 | 34.0579 | 28.5068 | 26.6540 | 26.6780 | 37.2558 | 12.6332 | 34.9201 | 28.0219 | 33.1166 | |
| d min | 21.9009 | 36.3725 | 33.3204 | 37.1832 | 37.1524 | 26.1205 | 37.3509 | 28.9622 | 24.5176 | 29.3508 | |
| MSE | 8.3868 | 15.5077 | 28.0535 | 5.6724 | 15.9792 | 40.6224 | 9.5826 | 38.4419 | 17.6261 | 13.4949 | |
|
| |||||||||||
| Airplane | 21.9009 | 36.3725 | 33.3204 | 37.1832 | 37.1524 | 26.1205 | 37.3509 | 28.9622 | 24.5176 | 29.3508 | |
| d min | 8.3868 | 15.5077 | 28.0535 | 5.6724 | 15.9792 | 40.6224 | 9.5826 | 38.4419 | 17.6261 | 13.4949 | |
| MSE | 15.5626 | 25.9173 | 26.8238 | 22.2865 | 26.5673 | 20.2143 | 29.551 | 25.9917 | 21.0685 | 24.9274 | |
Figure 2.
The curves of , d min, and MSE obtained by SaDE-CIQ1 (p = 0.1).
In summary, for the conflict of and d min, it is appropriate to select them as the subobjective functions in the above multiobjective image color model. Meanwhile, for the conflicts of MSE with and d min, there does not exist preference when MSE is applied to select the solution in the Pareto set of the above multiobjective model.
3. Multiobjective Image Color Quantization Algorithm Based on Self-Adaptive Hybrid DE
For solving the above multiobjective image color quantization model, this section proposes a multiobjective image color quantization algorithm based on self-adaptive hybrid DE (MoDE-CIQ). This algorithm merges the ideas of SaDE-CIQ in [19] and a multipopulation DE algorithm VEDE [30], which is a Pareto-based multiobjective DE algorithm. The main steps of the proposed MoDE-CIQ algorithm are described as below.
Step 1 (initialize populations). —
Two initial populations including NP individuals are randomly selected separately. Here, each individual is a colormap with K colors from an image I. The initial populations are denoted by
(8)
Step 2 (optimize populations). —
The population X 1 is updated by SaDE-CIQ with g 1(x) as its objective. The population X 2 is updated by SaDE-CIQ with g 2(x) as its objective. Then, the best individuals of the two populations are exchanged. The update and exchange operations are repeated to achieve a predetermined iteration number t max. The set of t maxth generation individuals of the two populations is denoted by
(9)
Step 3 (reserve nondominated solutions). —
All nondominated solutions in X are recorded in a set POS.
(Note: for an individual x i tmax (i = 1, 2,…, 2∗NP), if there is no another one x j tmax (j ≠ i, j = 1, 2,…, 2∗NP) such that g 1(x j tmax) < g 1(x i tmax) and g 2( x j tmax) < g 2(x i tmax), that is, F(x j tmax)≺F(x i tmax), it is a nondominated solution. Otherwise, it is a dominated solution.)
Step 4 (obtain an approximative Pareto solution set). —
Steps 2 and 3 are repeated to achieve a predetermined iteration number Loop. The final set POS is recorded as an approximative Pareto solution set.
Step 5 (determine an optimal solution). —
In the set POS, the solution with the smallest values of MSE is finally reserved as an optimal solution of an image color quantization problem.
The pseudocode of MoDE-CIQ is shown as Pseudocode 1.
Pseudocode 1.
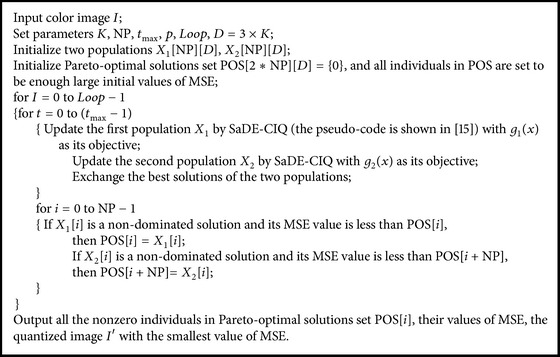
The pseudocode of MoDE-CIQ.
4. Numerical Experiments
In this section, two sets of experiments are conducted to illustrate the effectiveness of MoDE-CIQ algorithm and the advantage of the multiobjective model, respectively.
4.1. Experiments for Showing the Multiobjective Algorithmic Superiority
4.1.1. Experimental Background
Currently, the heuristic algorithms employed to solve the image color quantization problem have mainly GA, PSO, and DE. Reference [16] indicated that PSO is superior to GA. In [31], DE and PSO show similar performance on image color quantization. However, due to simple operation, litter parameters, and fast convergence, DE is the better choice to use than PSO. These mean that DE is a competitive image color quantization in the heuristic algorithms for image color quantization. Reference [19] proposed a color image quantization algorithm based on self-adaptive hybrid DE (SaDE-CIQ), in which the parameters of DE are automatically adjusted by a self-adaptive mechanic. Then, SaDE-CIQ is compared with K-means and the color image quantization algorithm using PSO (PSO-CIQ). Table 2 shows the smallest and the largest objective values for the three algorithms over 10 runs obtained in [19]. The results show that SaDE-CIQ is an effective color image quantization algorithm, and SaDE-CIQ has better quantization quality than K-means and PSO-CIQ. It is naturally to be thought that SaDE-CIQ is the best one of the image color quantization algorithms based on heuristic algorithms.
Table 2.
The MSE values resulting from SaDE-CIQ, K-means, and PSO-CIQ.
| Alg. | Peppers | Baboon | Lena | Airplane | ||||
|---|---|---|---|---|---|---|---|---|
| Min | Max | Min | Max | Min | Max | Min | Max | |
| SaDE-CIQ | 17.4682 | 18.7266 | 22.7496 | 23.3382 | 12.9709 | 13.8055 | 8.2482 | 8.9740 |
| K-means | 18.1086 | 21.2676 | 22.9532 | 24.9563 | 15.6401 | 19.1314 | 9.1141 | 10.4430 |
| PSO-CIQ | 36.3436 | 40.9532 | 35.8892 | 41.9940 | 29.6644 | 34.5867 | 21.3540 | 24.3200 |
Reference [28] presented a linear weighting objective function of and d min and MSE below:
| (10) |
where w 1, w 2, and w 3 are the user-defined weights of the subobjectives. The linear weighting objective function (10) is the only one, including the three evaluation criteria of MoDE-CIQ, in existing references. So in this section, we will compare MoDE-CIQ, SaDE-CIQ, and SaDE-CIQ3 obtained by replacing the objective function MSE with the linear weighting objective function (10) in SaDE-CIQ.
4.1.2. Experimental Design
MoDE-CIQ, SaDE-CIQ, and SaDE-CIQ3 are implemented to quantize the four test images in Figure 1 into the quantized images with 16 colors. Each algorithm is run 10 times. The parameters of algorithms are set as follows:
-
K = 16, NP = 100, t max = 200, Loop = 5. Mixed probability p takes three different values, 0.1, 0.05, and 0.01. w 1, w 2, and w 3 take the same values as those in [28].
4.1.3. Experimental Results
For MoDE-CIQ, Table 3 reports the best MSE values and the corresponding objective values , d min in 10 runs. In fact, smaller is better, larger d min is better, and smaller MSE is better. As shown in Table 3, the following conclusions are obtained. (i) For Peppers, only MSE is best as p = 0.05. and d min are best as p = 0.01. As p = 0.1, , d min, and MSE are all medians, and and MSE are similar to their corresponding best values. (ii) For Baboon, as p = 0.1, d min and MSE are all best. (iii) For Lena, and MSE are all best as p = 0.1. (iv) For Airplane, as p = 0.05, is best, d min is a median, and MSE is similar to the other two values.
Table 3.
The best MSE values and the corresponding objective values of MoDE-CIQ.
| Image | p values | d min | MSE | |
|---|---|---|---|---|
| Peppers | 0.1 | 25.6127 | 28.2967 | 19.1029 |
| 0.05 | 28.2967 | 31.9070 | 18.8444 | |
| 0.01 | 24.8917 | 38.4062 | 19.5632 | |
|
| ||||
| Baboon | 0.1 | 27.8841 | 45.8284 | 22.9602 |
| 0.05 | 27.8083 | 45.5262 | 22.9887 | |
| 0.01 | 27.9030 | 44.7175 | 22.9654 | |
|
| ||||
| Lena | 0.1 | 20.2311 | 26.4388 | 14.2847 |
| 0.05 | 20.2849 | 32.0907 | 15.6655 | |
| 0.01 | 21.1913 | 32.9181 | 15.5229 | |
|
| ||||
| Airplane | 0.1 | 22.0570 | 24.1028 | 10.7517 |
| 0.05 | 22.0105 | 29.6160 | 11.2520 | |
| 0.01 | 20.9759 | 26.9999 | 10.9591 | |
According to the above conclusions, we will take p as 0.1 for Peppers, Baboon, and Lena in the following comparing experiments. However, there are few and extremely unequally distributed base colors in Airplane. For preserving main color gradations and richer color levers of original images, should be as small as possible. So we will take p as 0.05 for Airplane in the following comparing experiments.
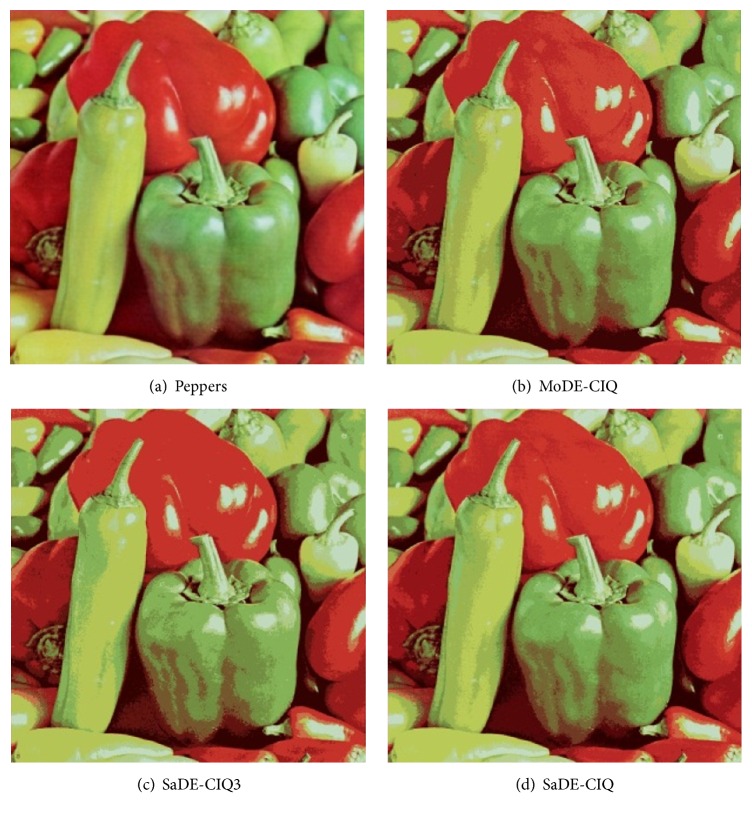
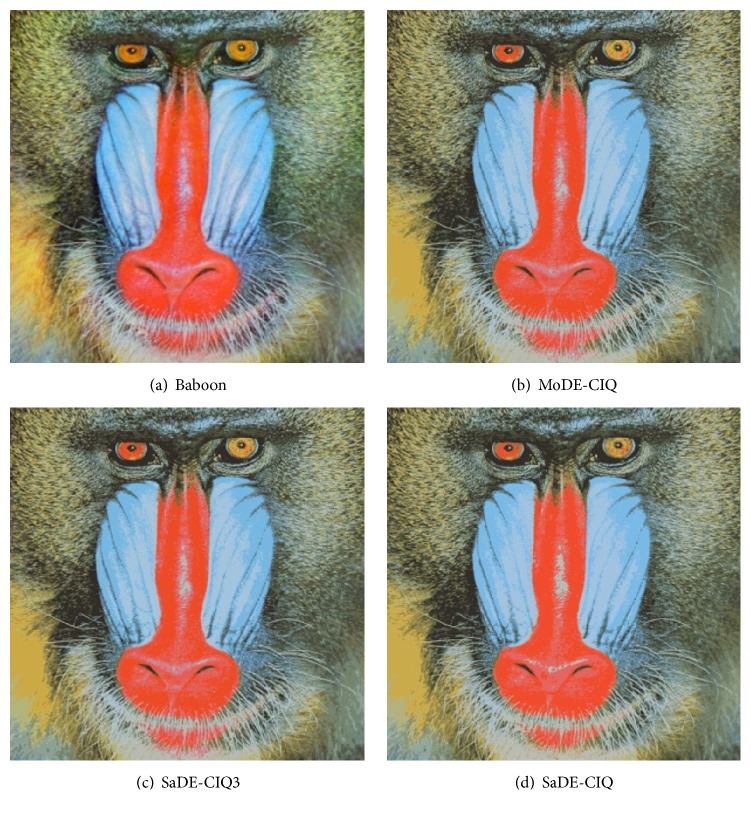
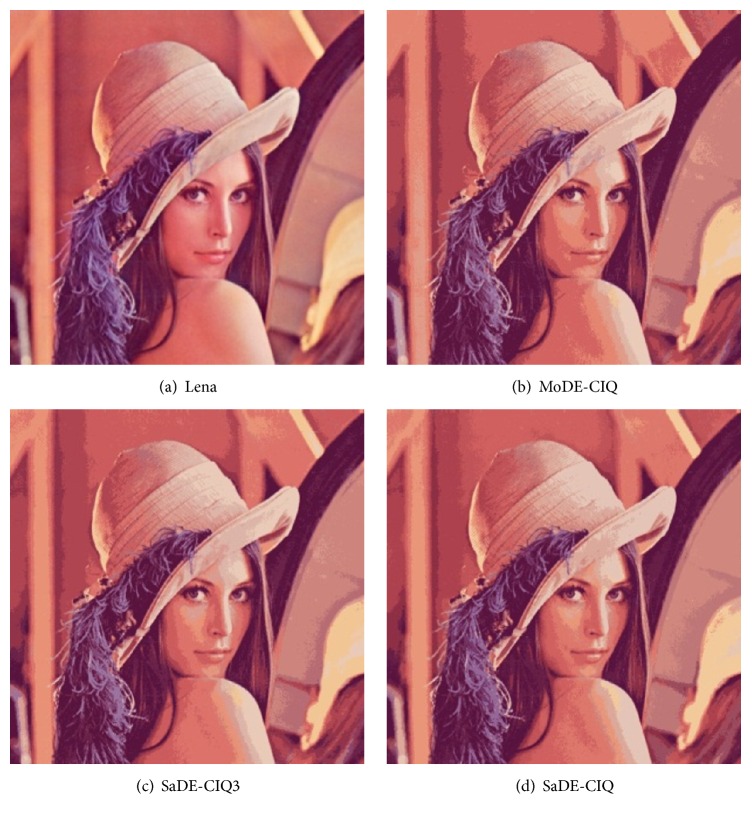
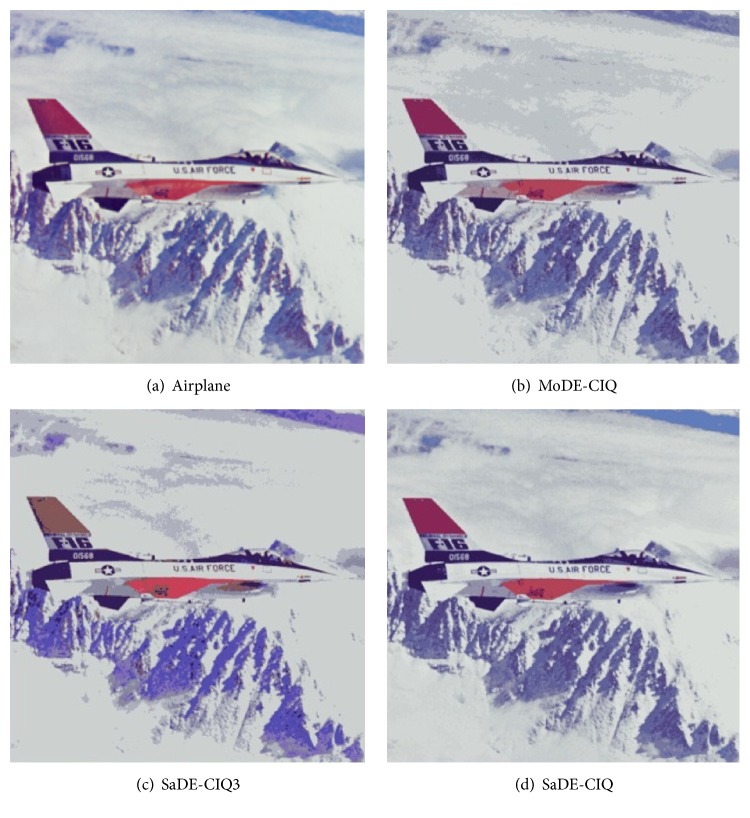
For comparing MoDE-CIQ, SaDE-CIQ, and SaDE-CIQ3, Table 4 reports , d min, and MSE of their quantized images, MSE values of which are the smallest in their 10 runs. SaDE-CIQ aims to minimize its objective MSE, so its values of MSE are surely the best than those of other two algorithms. But the values of and d min by MoDE-CIQ are all better than those of SaDE-CIQ. The values of and d min obtained by SaDE-CIQ3 for Peppers and Baboon are also better than those of SaDE-CIQ. The values of , d min, and MSE obtained by MoDE-CIQ are better than those of SaDE-CIQ3, except for their similar values of , d min, and MSE for Baboon, and the values of MSE for Lena. Figures 3, 4, 5, and 6 show all quantized images of the four common test images in Figure 1. In Figures 3 –6, all subfigures (a) are the original test images. Subfigures (b), subfigures (c), and subfigures (d) are the quantized images separately obtained by MoDE-CIQ, SaDE-CIQ3, and SaDE-CIQ. The visual effects of the quantized images are compared as follows. (i) For Peppers (shown in Figure 3), there are contrasting and equally distributed main base colors, so the quantized images obtained by three algorithms visually have similar color distortions. The differences in the quantization quality of these quantized images depend on their color gradations of larger regions with similar colors. The quantized images of MoDE-CIQ and SaDE-CIQ have the more rich color levers than the one of the SaDE-CIQ3. (ii) For Baboon (shown in Figure 4), there are also contrasting and equally distributed main base colors, but there are little larger regions with similar colors. So the quantized images of three methods have similar effects. (iii) For Lena (shown in Figure 5), there are many shaded regions in it. So differences in the quantization quality of the corresponding quantized images depend on the transition from shaded regions to highlights. MoDE-CIQ obtains the quantized image with more natural transition than SaDE-CIQ and SaDE-CIQ3. (iv) For Airplane (shown in Figure 6), there are extremely unequally distributed base colors. Obviously, the quantized image of SaDE-CIQ3 has the largest color distortion. Although the quantized image of SaDE-CIQ has a little better color distortion than that of the multiobjective algorithm, the former loses some detail colors, such as the cloud in the sky.
Table 4.
, d min, and MSE of the quantized images with 16 colors by three algorithms.
| Image | p values | Algorithm | d min | MSE | |
|---|---|---|---|---|---|
| Peppers | 0.1 | MoDE-CIQ | 25.6127 | 28.2967 | 19.1029 |
| SaDE-CIQ3 | 34.2489 | 45.8673 | 20.3563 | ||
| SaDE-CIQ | 37.2450 | 22.2473 | 17.4577 | ||
|
| |||||
| Baboon | 0.1 | MoDE-CIQ | 27.8841 | 45.8284 | 22.9602 |
| SaDE-CIQ3 | 27.8122 | 45.8426 | 22.9592 | ||
| SaDE-CIQ | 28.1805 | 36.4773 | 22.7644 | ||
|
| |||||
| Lena | 0.1 | MoDE-CIQ | 20.2311 | 26.4388 | 14.2847 |
| SaDE-CIQ3 | 22.8824 | 27.5461 | 13.5264 | ||
| SaDE-CIQ | 22.2973 | 19.0143 | 12.9641 | ||
|
| |||||
| Airplane | 0.05 | MoDE-CIQ | 22.0105 | 29.6160 | 11.2520 |
| SaDE-CIQ3 | 113.2050 | 34.8630 | 17.4217 | ||
| SaDE-CIQ | 23.7529 | 8.2540 | 8.0544 | ||
Figure 3.
The quantized images of Peppers with 16 colors obtained by three algorithms.
Figure 4.
The quantized images of Baboon with 16 colors obtained by three algorithms.
Figure 5.
The quantized images of Lena with 16 colors obtained by three algorithms.
Figure 6.
The quantized images of Airplane with 16 colors obtained by three algorithms.
According the above results, for the images with contrasting and equally distributed main base colors, the quantization effects of MoDE-CIQ and SaDE-CIQ are similar. But for the images with many shaded regions and extremely unequally distributed base colors, MoDE-CIQ could make the colors more natural and preserve more detail colors. In SaDE-CIQ3, the weighted factors in (10) affect its quantization quality. Thus, we can think MoDE-CIQ is superior to the other two algorithms.
4.2. Experiments for Showing the Advantage of the Multiobjective Model
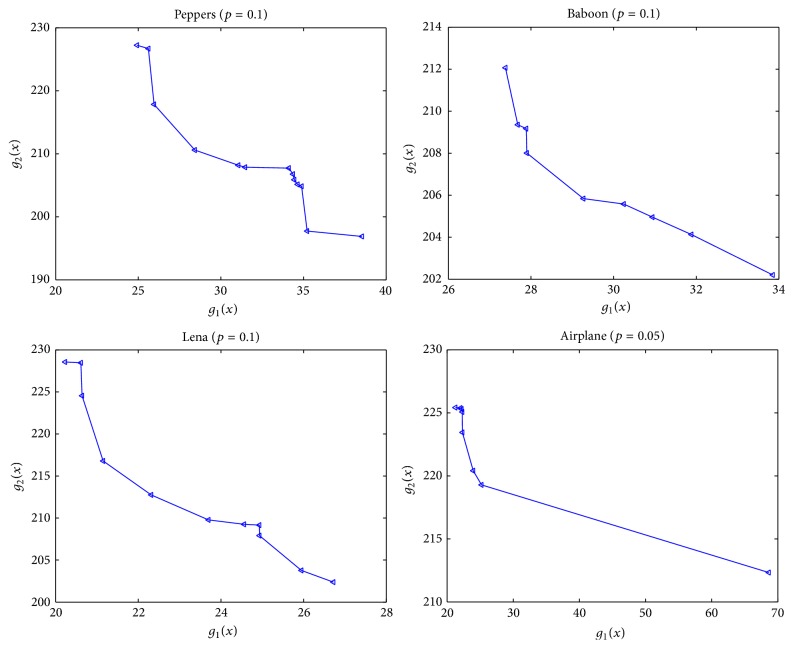
As the statement on Step 4 of MoDE-CIQ, we can obtain an approximative Pareto solution set. This is an advantage comparing to all single-objective algorithms. The above experiments reserved the approximative Pareto-optimal solutions of all four images. The solution sets corresponding to Peppers, Baboon, Lena, and Airplane, respectively, include 13 solutions (shown in Table 5), 9 solutions (in Table 6), 11 solutions (in Table 7), and 8 solutions (in Table 8). For comparing these optimal solutions, their corresponding MSE values are listed. Figure 7 shows the Pareto front of these Pareto-optimal solutions. These optimization solutions present some quantized images with different effects. Users can select the suitable quantized image according to their requirements for the color gradations and details.
Table 5.
Pareto-optimal solutions for Peppers.
| Order | g 1(x) | g 2(x) | MSE |
|---|---|---|---|
| 1 | 24.9238 | 227.2425 | 19.5660 |
| 2 | 38.5345 | 196.8913 | 25.4623 |
| 3 | 31.0556 | 208.1886 | 24.1790 |
| 4 | 34.6405 | 205.1429 | 22.2026 |
| 5 | 25.6127 | 226.7033 | 19.1029 |
| 6 | 35.2191 | 197.7366 | 23.0621 |
| 7 | 31.4675 | 207.8684 | 23.3818 |
| 8 | 34.4429 | 205.8758 | 22.2859 |
| 9 | 34.8841 | 204.8451 | 26.031 |
| 10 | 34.1102 | 207.7311 | 23.1158 |
| 11 | 25.9563 | 217.8530 | 20.4536 |
| 12 | 28.4238 | 210.6036 | 22.2533 |
| 13 | 34.3636 | 206.7747 | 21.8853 |
Table 6.
Pareto-optimal solutions for Baboon.
| Order | g 1(x) | g 2(x) | MSE |
|---|---|---|---|
| 1 | 27.3819 | 212.0693 | 23.1123 |
| 2 | 27.8841 | 209.1716 | 22.9602 |
| 3 | 31.8821 | 204.127 | 24.7008 |
| 4 | 29.2681 | 205.8375 | 24.4271 |
| 5 | 30.9412 | 204.9553 | 24.6433 |
| 6 | 33.8514 | 202.2041 | 25.7050 |
| 7 | 30.2455 | 205.5812 | 24.5084 |
| 8 | 27.8998 | 208.0066 | 227.341 |
| 9 | 27.6801 | 209.3535 | 227.341 |
Table 7.
Pareto-optimal solutions for Lena.
| Order | g 1(x) | g 2(x) | MSE |
|---|---|---|---|
| 1 | 24.9313 | 207.9088 | 19.8533 |
| 2 | 20.2311 | 228.5612 | 14.2847 |
| 3 | 20.6109 | 228.4630 | 15.1880 |
| 4 | 26.7185 | 202.3789 | 20.9155 |
| 5 | 25.9452 | 203.7679 | 20.8445 |
| 6 | 24.5586 | 209.2558 | 18.9967 |
| 7 | 23.6997 | 209.7721 | 19.8327 |
| 8 | 22.3126 | 212.7511 | 20.1288 |
| 9 | 21.1493 | 216.7855 | 17.3328 |
| 10 | 24.9279 | 209.1586 | 233.6600 |
| 11 | 20.6396 | 224.5480 | 233.6600 |
Table 8.
Pareto-optimal solutions for Airplane.
| Order | g 1(x) | g 2(x) | MSE |
|---|---|---|---|
| 1 | 23.9419 | 220.4130 | 12.4973 |
| 2 | 21.2536 | 225.4198 | 11.4192 |
| 3 | 22.3128 | 223.4460 | 11.5732 |
| 4 | 22.0105 | 225.3840 | 11.2520 |
| 5 | 22.2876 | 225.0752 | 11.4864 |
| 6 | 25.2011 | 219.2880 | 13.5785 |
| 7 | 68.6311 | 212.3398 | 316.6950 |
| 8 | 22.1871 | 225.3009 | 316.6950 |
Figure 7.
Pareto front of MoDE-CIQ.
By the experimental results of the above two parts, MoDE-CIQ is a competitive algorithm for image color quantization.
All the above algorithms were implemented in Visual C++ and the experiments were conducted on a computer with Intel® Xeon® CPU E3-1230 v3 @ 3.30 GHZ and 8 GB RAM.
5. Conclusions
This paper established a multiobjective image color quantization model, in which intracluster distance and intercluster separation d min are selected as its objective functions. A multiobjective image color quantization algorithm based on self-adaptive hybrid DE (MoDE-CIQ) was proposed to solve this model. MoDE-CIQ emerges the ideas of SaDE-CIQ [19] and a multipopulation DE algorithm VEDE [30], and applies MSE to determine the optimal solution. The multiobjective model and the proposed algorithm present a strategy to obtain a quantized image which holds the smallest color distortion among those images with a balance between the optimal color gradation and the optimal color details. The experimental results indicated that the multiobjective model and MoDE-CIQ are effective and competitive for image color quantization problems.
Acknowledgments
This work was supported in part by Hubei Province Department of Education Major Scientific Research Program of China (D20161306).
Competing Interests
The authors declare that there are no competing interests regarding the publication of this paper.
References
- 1.Braquelaire J.-P., Brun L. Comparison and optimization of methods of color image quantization. IEEE Transactions on Image Processing. 1997;6(7):1048–1052. doi: 10.1109/83.597280. [DOI] [PubMed] [Google Scholar]
- 2.Kumar R., Rohit A., Arup P. Intelligent Computing, Networking, and Informatics: Proceedings of the International Conference on Advanced Computing, Networking, and Informatics, India, June 2013. Vol. 243. Berlin, Germany: Springer; 2014. Color image quantization scheme using DBSCAN with K-means algorithm; pp. 1037–1045. (Advances in Intelligent Systems and Computing). [DOI] [Google Scholar]
- 3.Emre Celebi M. Improving the performance of k-means for color quantization. Image and Vision Computing. 2011;29(4):260–271. doi: 10.1016/j.imavis.2010.10.002. [DOI] [Google Scholar]
- 4.Pérez-Delgado M. L. Colour quantization with Ant-tree. Applied Soft Computing. 2015;36:656–669. doi: 10.1016/j.asoc.2015.07.048. [DOI] [Google Scholar]
- 5.Yue X. D., Miao D. Q., Cao L. B., Wu Q., Chen Y. F. An efficient color quantization based on generic roughness measure. Pattern Recognition. 2014;47(4):1777–1789. doi: 10.1016/j.patcog.2013.11.017. [DOI] [Google Scholar]
- 6.Jiang Y., Wang Y., Jin L., Gao H., Zhang K. Investigation on color quantization algorithm of color image. In: Shen G., Huang X., editors. Advanced Research on Electronic Commerce, Web Application, and Communication. Vol. 144. Berlin, Germany: Springer; 2011. pp. 181–187. (Communications in Computer and Information Science). [Google Scholar]
- 7.Palus H., Frackiewicz M. New approach for initialization of K-means technique applied to color quantization. Proceedings of the 2nd International Conference on Information Technology (ICIT '10); June 2010; Gdansk, Poland. IEEE; pp. 205–209. [Google Scholar]
- 8.Celebi M. E. Fast color quantization using weighted sort-means clustering. Journal of the Optical Society of America A. 2009;26(11):2434–2443. doi: 10.1364/josaa.26.002434. [DOI] [PubMed] [Google Scholar]
- 9.Schaefer G., Hu Q., Zhou H., Peters J. F., Hassanien A. E. Rough C-means and fuzzy rough C-means for colour quantisation. Fundamenta Informaticae. 2012;119(1):113–120. doi: 10.3233/FI-2012-729. [DOI] [Google Scholar]
- 10.Palomo E. J., Domínguez E. Hierarchical color quantization based on self-organization. Journal of Mathematical Imaging and Vision. 2014;49(1):1–19. doi: 10.1007/s10851-013-0433-8. [DOI] [Google Scholar]
- 11.Park H. J., Kim K. B., Cha E. An effective color quantization method using octree-based self-organizing maps. Computational Intelligence and Neuroscience. 2016;2016:11. doi: 10.1155/2016/5302957.5302957 [DOI] [PMC free article] [PubMed] [Google Scholar]
- 12.Celebi M. E., Wen Q., Hwang S. An effective real-time color quantization method based on divisive hierarchical clustering. Journal of Real-Time Image Processing. 2015;10(2, article 291):329–344. doi: 10.1007/s11554-012-0291-4. [DOI] [Google Scholar]
- 13.Scheunders P. A genetic c-means clustering algorithm applied to color image quantization. Pattern Recognition. 1997;30(6):859–866. doi: 10.1016/s0031-3203(96)00131-8. [DOI] [Google Scholar]
- 14.Taşdizen T., Akarun L., Ersoy C. Color quantization with genetic algorithms. Signal Processing: Image Communication. 1998;12(1):49–57. doi: 10.1016/S0923-5965(97)00035-0. [DOI] [Google Scholar]
- 15.Omran M. G., Engelbrecht A. P., Salman A. A color image quantization algorithm based on Particle Swarm Optimization. Informatica. 2005;29(3):261–269. [Google Scholar]
- 16.Kennedy J., Spears W. M. Matching algorithms to problems: an experimental test of the particle swarm and some genetic algorithms on the multimodal problem generator. Proceedings of the IEEE International Conference on Evolutionary Computation (ICEC '98); May 1998; Anchorage, Alaska, USA. IEEE; pp. 78–83. [Google Scholar]
- 17.Ryosuke K., Hakaru T., Hideaki K., et al. Image and Video Technology. Vol. 9431. Springer; 2016. A color quantization based on vector error diffusion and particle swarm optimization considering human visibility; pp. 332–343. [Google Scholar]
- 18.Schaefer G., Nolle L. Optimal image colour extraction by differential evolution. International Journal of Bio-Inspired Computation. 2010;2(3-4):251–257. doi: 10.1504/IJBIC.2010.033093. [DOI] [Google Scholar]
- 19.Su Q., Hu Z. Color image quantization algorithm based on self-adaptive differential Evolution. Computational Intelligence and Neuroscience. 2013;2013:8. doi: 10.1155/2013/231916.231916 [DOI] [PMC free article] [PubMed] [Google Scholar]
- 20.Ozturk C., Hancer E., Karaboga D. Color image quantization: a short review and an application with artificial bee colony algorithm. Informatica. 2014;25(3):485–503. doi: 10.15388/informatica.2014.25. [DOI] [Google Scholar]
- 21.El-Said S. A. Image quantization using improved artificial fish swarm algorithm. Soft Computing. 2015;19(9):2667–2679. doi: 10.1007/s00500-014-1436-0. [DOI] [Google Scholar]
- 22.Ouadfel S., Batouche M., Taleb-Ahmed A. A modified particle swarm optimization algorithm for automatic image clustering. Proceedings of the Symposium on Modelling and Implementation of Complex Systems (MISC '10); 2010; Constantine, Algeria. [Google Scholar]
- 23.Schaefer G. Soft computing-based colour quantisation Soft Computing for Image Analysis. Eurasip Journal on Image and Video Processing. 2014;2014, article 8 doi: 10.1186/1687-5281-2014-8. [DOI] [Google Scholar]
- 24.Celebi M. E., Hwang S., Wen Q. Colour quantisation using the adaptive distributing units algorithm. Imaging Science Journal. 2014;62(2):80–91. doi: 10.1179/1743131x13y.0000000059. [DOI] [Google Scholar]
- 25.Omran M., Salman A., Engelbrecht A. Image classification using particle swarm optimization. Proceedings of the 4th Asia-Pacific Conference on Simulated Evolution and Learning; November 2002; Singapore. [Google Scholar]
- 26.Omran M., Engelbrecht A. P., Salman A. Particle swarm optimization method for image clustering. International Journal of Pattern Recognition and Artificial Intelligence. 2005;19(3):297–321. doi: 10.1142/S0218001405004083. [DOI] [Google Scholar]
- 27.Esmin A. A. A., Pereira D. L., de Araújo F. P. A. Study of different approach to clustering data by using the particle swarm optimization algorithm. Proceedings of the IEEE Congress on Evolutionary Computation (CEC '08); June 2008; Hong Kong. IEEE; pp. 1817–1822. [DOI] [Google Scholar]
- 28.Wong M. T., He X., Yeh W.-C. Image clustering using particle swarm optimization. Proceedings of the IEEE Congress on Evolutionary Computation (CEC '11); June 2011; New Orleans, La, USA. pp. 262–268. [DOI] [Google Scholar]
- 29.Schaefer G., Nolle L. A hybrid color quantization algorithm incorporating a human visual perception model. Computational Intelligence. 2015;31(4):684–698. [Google Scholar]
- 30.Parsopoulos K. E., Tasoulis D. K., Pavlidis N. G., Plagianakos V. P., Vrahatis M. N. Vector evaluated differential evolution for multi-objective optimization. Proceedings of the Congress on Evolutionary Computation (CEC '04); June 2004; pp. 204–211. [Google Scholar]
- 31.Omran M. G. H., Engelbrecht A. P., Salman A. Differential evolution methods for unsupervised image classification. Proceedings of the IEEE Congress on Evolutionary Computation (CEC '05); September 2005; Edinburgh, UK. pp. 966–973. [Google Scholar]


