Significance
The electrical response of vertebrate olfactory receptor neurons to odorants consists of two components: an inward cyclic-nucleotide–gated, nonselective cation current and an inward calcium-activated chloride current. These two currents are causally and tightly coupled, making them difficult to be separated. We have now succeeded in cleanly separating these two currents and found the Cl current to be dominant whether the overall response is at threshold for signaling to the brain or has reached saturation. Thus, the Cl current appears to have an important role in signal amplification in olfaction across the stimulus range.
Keywords: olfactory receptor neurons, olfactory transduction, cyclic-nucleotide–gated channel, calcium-activated chloride channel, signal amplification
Abstract
Olfactory transduction in vertebrate olfactory receptor neurons (ORNs) involves primarily a cAMP-signaling cascade that leads to the opening of cyclic-nucleotide–gated (CNG), nonselective cation channels. The consequent Ca2+ influx triggers adaptation but also signal amplification, the latter by opening a Ca2+-activated Cl channel (ANO2) to elicit, unusually, an inward Cl current. Hence the olfactory response has inward CNG and Cl components that are in rapid succession and not easily separable. We report here success in quantitatively separating these two currents with respect to amplitude and time course over a broad range of odorant strengths. Importantly, we found that the Cl current is the predominant component throughout the olfactory dose–response relation, down to the threshold of signaling to the brain. This observation is very surprising given a recent report by others that the olfactory-signal amplification effected by the Ca2+-activated Cl current does not influence the behavioral olfactory threshold in mice.
The major chemotransduction mechanism in olfactory receptor neurons (ORNs) of the vertebrate main olfactory epithelium uses a cAMP-mediated signaling cascade (1–4). Specifically, odorants (or at least excitatory odorants) bind to and activate odorant receptor (OR) proteins on the ORN cilia, thereby stimulating, via a G protein (Golf), an adenylyl cyclase (ACIII) to elevate cAMP. The cAMP binds to and opens a cyclic-nucleotide–gated (CNG), nonselective cation channel (5–10), leading to Na+ and Ca2+ influxes and thus depolarization and excitation of the ORN. The Ca2+ influx elevates intracellular Ca2+ concentration, which in turn leads to olfactory adaptation via multiple negative-feedback mechanisms on the cAMP-signaling pathway (3, 11). At the same time, the Ca2+ increase opens a Ca2+-activated Cl channel on the cilium, known to be composed of at least the channel protein, anoctamin 2 (ANO2) [also called TMEM16B (12–21)]. The resulting Cl− movement is an efflux, owing to a constitutively high intracellular Cl− concentration maintained by a steady Cl− uptake—via a Na+–K+–2Cl− cotransporter, NKCC1 (22–25), and at least one other transport mechanism (26, 27), possibly the Cl−/HCO3− antiporter (exchanger) SLC4A1 (22). This Cl− efflux through the Ca2+-activated Cl channel gives rise to an inward current that adds to (i.e., amplifies) the inward CNG current, leading to olfactory signal amplification. The odorant-induced elevation in intracellular Ca2+ concentration is subsequently nullified by a 4Na+/Ca2+, K+ exchanger (28–30) and controvertibly also a Ca2+-ATPase (31–35).
Despite the supposedly established facts about olfactory transduction described above, this picture has relapsed into confusion in recent years with respect to both adaptation and signal amplification (3). Regarding olfactory adaptation, the importance of the multiple Ca2+-triggered, negative-feedback mechanisms on cAMP signaling during transduction is now in doubt (3). As for the Cl current-mediated signal amplification, which is the focus of this paper, its functional significance at least in land-based animals has also become uncertain, owing to a recent study reporting that an Ano2−/− mouse line in which the Ca2+-activated Cl channel has been genetically ablated showed behaviorally no obvious diminished olfactory sensitivity compared with wild type (WT) (36). Accordingly, the significance of this Cl current needs to be reexamined. For this purpose, we need to know its temporal profile and also its fractional contribution to the overall olfactory response at different odorant strengths. A popular approach up to now has been to use niflumic acid (NFA) as a blocker of the Cl current (13, 21, 36). However, this method as typically used by others is crude because NFA at the commonly chosen concentration of 300 µM (occasionally up to 500 µM or 1 mM) is unlikely to suppress the ORN’s Cl current completely (13). Worse still, some recent work has raised the worrisome specter of NFA being nonspecific in that it supposedly also partially inhibits the olfactory response even in the Ano2−/− mouse (36). Regardless of electroolfactogram (EOG) measurement or single-ORN recording, the procedure of applying NFA has often been to bathe the tissue or cell in an external solution containing this chemical and then challenge the tissue/cell with odorant to elicit an olfactory response composed of CNG current alone (e.g., refs. 13, 21, and 36). We report here that this approach is liable to error. With the appropriate procedure, on the other hand, we showed that NFA in fact does act specifically on the Cl current with no side effect. At the same time, we have devised a way to correct quantitatively for the incomplete blockage of the Cl current by NFA. As such, we are able to cleanly separate the CNG and Cl currents with respect to both amplitude and time course in the overall olfactory response, revealing their correlation at different odorant strengths. The key finding is that the Cl current appears to dominate the response at essentially all odorant strengths, being present all of the way down to the signaling threshold.
Results
Suction pipette recording from a single ORN was used in all experiments, with the cell body drawn into the pipette containing normal Ringer’s solution and the cilia exposed to bath perfusion (29, 37, 38). This method has the virtue of mechanical stability and being completely noninvasive, allowing recordings for typically 30–60 min, sometimes up to 2–3 h or longer, with little rundown of the olfactory response. Such prolonged recordings are required for our experiments and would have been impossible with, for example, patch-clamp recording. The method also allows rapid and essentially complete bath solution change in 5–10 ms around the recorded ORN’s cilia, which is an important feature of our experiments. The experiments described here were performed on frog ORNs, which are generally much more robust than mouse ORNs and have the additional feature of slower response kinetics, helping our experimental procedure.
No Side Effect of NFA on CNG Current.
With a recent report based on an EOG study that, apart from blocking the Cl current, NFA also has inhibitory side effects on the olfactory response (36)—interpreted by us to refer to an NFA effect on the CNG current—we decided to take a closer look. We tested NFA on a frog ORN’s olfactory response by applying it as a pulse, the almost-standard configuration in our experiments (see Methods for detailed comments). To examine NFA’s potential effect on the CNG current, we switched an ORN into a 0-Ca2+/EGTA solution so as to eliminate all Ca2+ influx through open CNG channels during olfactory transduction, thus removing the Ca2+-activated Cl current. The chemical, (+)-limonene, was chosen as odorant in the form of a 30-ms pulse and usually at 3 mM (but see dose–response experiments below). At this concentration, (+)-limonene elicited a detectable response from typically one ORN per 15–20 cells encountered randomly. Unlike some other odorants, (+)-limonene does not have the confounding property of also inhibiting the CNG current (39, 40). The NFA concentration was at 300 µM, same as that typically used by others (e.g., refs. 13 and 36).
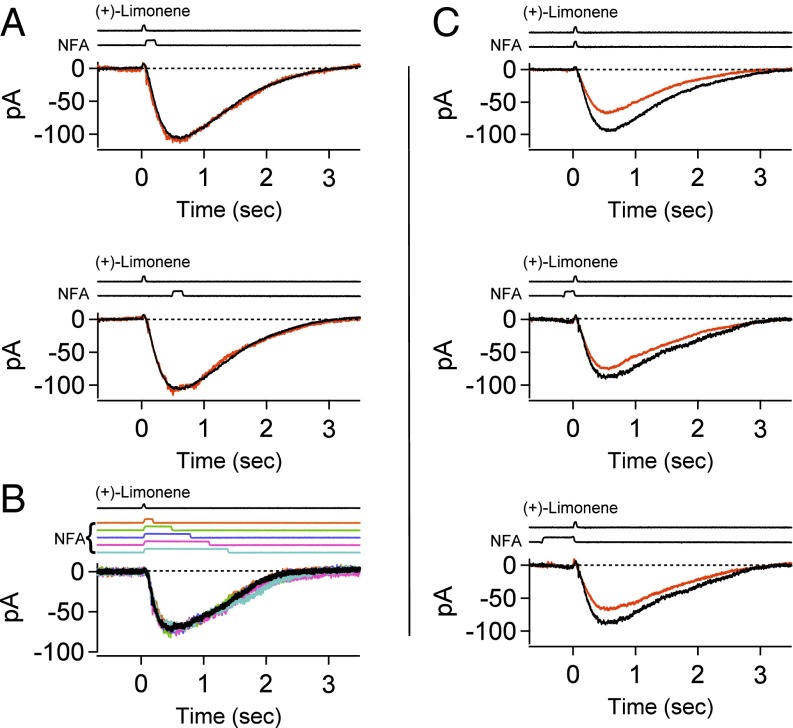
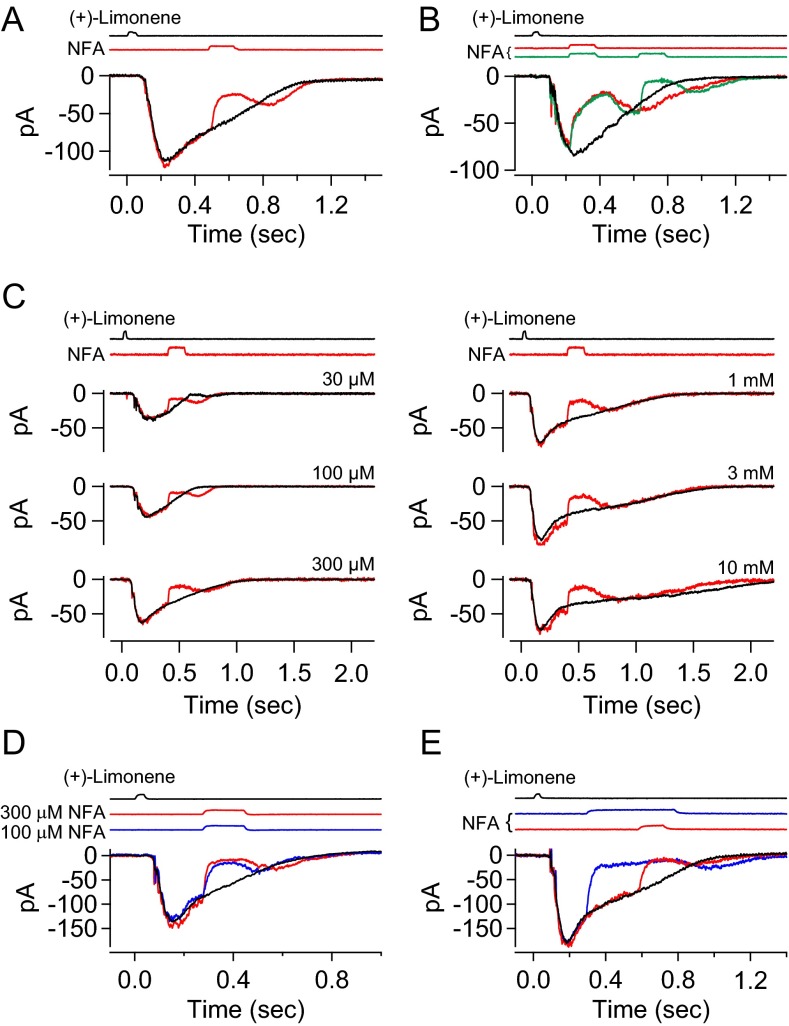
In the simple experiment of Fig. 1A, Top, in 0-Ca2+/EGTA solution, a 150-ms pulse of 300 µM NFA applied immediately after the (+)-limonene pulse did not affect the ORN’s odorant-elicited CNG current at all, nor did a NFA pulse applied with a time delay after the (+)-limonene pulse (Fig. 1A, Bottom). Substantially prolonging the NFA pulse likewise had no effect as long as the pulse was applied after the odorant stimulus (Fig. 1B, different cell). Therefore, NFA truly does not affect the CNG current, at least in the absence of Ca2+. Previously, by examining the CNG current activated by exogenous cAMP in an excised frog cilium, Kleene (13) showed that NFA likewise did not inhibit the CNG current in the presence of Ca2+.
Fig. 1.
No side effect of niflumic acid (NFA) on CNG current. (A–C) Frog ORN exposed to a 30-ms, 3 mM (+)-limonene pulse alone or in conjunction with a 300 µM NFA pulse. Zero-Ca2+ Ringer’s throughout, thus no Ca2+-activated Cl current. Timings of exposure to each chemical based on junction current measurements are indicated above the recordings. Same cell in A and C. Different cell in B. Black, response to odorant alone; nonblack, response to odorant in conjunction with NFA. (A) The 150-ms NFA applied at two different timings after odorant pulse. (B) Different durations (150, 450, 750, 1,050, and 1,350 ms) of NFA applied immediately after odorant pulse. (C) The 30-ms NFA applied during, or 150- and 500-ms NFA applied immediately before, odorant pulse. See text for details.
We also checked a NFA pulse applied during or before a (+)-limonene pulse (Fig. 1C; same cell as in Fig. 1A). When applied simultaneously with an odorant pulse (Fig. 1C, Top), a 30-ms pulse of NFA [shortened from 150 ms to match the duration of the (+)-limonene pulse] did indeed reduce the olfactory response by about 30%. An inhibition was still observable when a 150-ms NFA pulse was started before the (+)-limonene pulse and terminated just before the odorant pulse, indicating that this NFA effect took a short delay to dissipate (Fig. 1C, Middle). When the NFA “prepulse” was increased to 500 ms, its inhibitory effect became even larger (Fig. 1C, Bottom), although not as large as a 30-ms NFA pulse applied simultaneously with the (+)-limonene pulse (Fig. 1C, Top). We interpret these observations to mean that NFA most likely interferes with the odorant–OR interaction. Because most mammalian odorants are lipophilic, and NFA is itself lipophilic, this interference is perhaps not entirely surprising. Given the experimental protocol of Billig et al. (36), this effect is presumably what they observed. We have not systematically addressed whether the negative NFA effect is common for most odorants or is specific to some but not other odorants. In any case, as long as NFA is applied after the odorant pulse, we can avoid this interference, making it a nonproblem.
Did NFA itself have an effect on ORNs? From 39 randomly encountered ORNs with cilia bathed in normal Ringer’s and stimulated by a 150-ms NFA pulse, 56% showed no response, but the others showed a small depolarization or a mild increase in firing that can be interpreted as an olfactory response. NFA in powder form or in a 300 µM aqueous solution failed to elicit any detectable odor from human test subjects consisting of this paper’s authors. For simplicity, only data from ORNs showing no response to NFA are included in this paper.
Dissection of Olfactory Response into CNG and Cl Currents.
Having validated that NFA does not affect the CNG current and having also understood the temporal constraints with respect to NFA's use in relation to the odorant pulse (see above), we next used it for separating the CNG and Cl currents in the olfactory response under normal conditions, that is, in the presence of external Ca2+. The procedure is similar to that used by Lowe and Gold (16), but with an important, additional consideration described below.
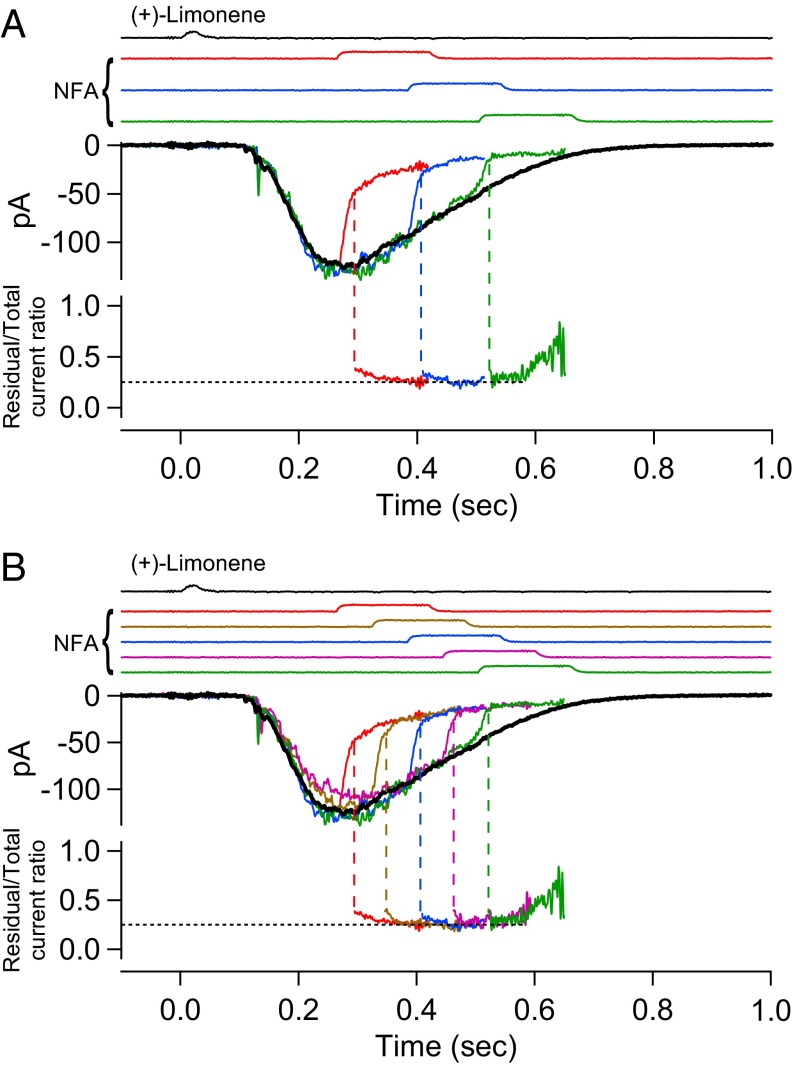
To reveal the CNG current component during the overall olfactory response, we used a 150-ms pulse of 300 µM NFA to suppress the Cl current. It is not practical to use NFA at higher than 300 µM because the Cl current blockage approaches completion asymptotically with increasing NFA concentration (13). Moreover, given the difficulty in achieving full blockage, it is actually better for our purpose to use a NFA concentration that leaves an easily measurable residual Cl current, as will be appreciated below (see second-to-last paragraph in CNG Current and Cl Current at Different Odorant Strengths). Fig. 2A depicts, color-coded in an overlay plot, an ORN’s response behavior to (+)-limonene upon application of the 300 µM NFA pulse at three different time delays after the odorant pulse. Upon exposure to NFA, the receptor current showed a two-phase decline. The initial, rapid phase roughly paralleled the time course of solution change around the cell, reflecting the time course of NFA arrival at the cell, followed by a slower decline presumably reflecting NFA’s blocking effect progressively reaching a steady state, although the underlying blockage mechanism is still unclear. To sidestep the time delay in the slow phase and to avoid a secondary effect of NFA (Methods), we adhered to a short NFA pulse but applied it with a shorter incremental time delay. As such, a continuous profile of the residual current was defined by a final common trajectory (Fig. 2B).
Fig. 2.
Residual olfactory response after NFA inhibition. (A, Upper) Olfactory response elicited by 30-ms, 10 mM (+)-limonene pulse is subjected to successive trials of blockage by 150-ms, 300 µM NFA applied with increasing time delays (at 120-ms increments; color coded). The current reduction by NFA shows a fast phase and a slow phase. Together, the final tails of the residual currents in the three trials provide broadly a profile of the overall residual current, despite gaps of discontinuities. For clarity, the part of the current trace after NFA removal has been removed (Methods). (Lower) Residual current in each NFA trial is divided by the total (control) current response (black trace in Upper); together, they yield a temporal profile of the residual/total current ratio during NFA inhibition, which shows a plateau bottom. (B) Same experiment and same ORN as in A, but with two additional NFA blockage trials filled in to reduce the time gap between successive NFA applications to 60 ms. As such, the profile of the residual current becomes more continuous, revealing clearly a plateau bottom of the residual/total current ratio at 0.25 in this experiment. See text for details. Timings of (+)-limonene and NFA applications based on junction current measurements are indicated at Top of each panel.
The residual-current profile during NFA application was previously interpreted by Lowe and Gold (16) to be that of the CNG current, with the difference between it and the total-receptor current profile to represent the Cl current. However, we noticed that the residual current at a given time instant was a constant fraction (∼0.25 in this experiment, indicated by dashed line in Fig. 2 A and B, Bottom) of the total receptor current during most of the decline phase of the overall olfactory response. A causal relation exists between the CNG current and the Cl current; namely, the Ca2+ influx through open CNG channels is what triggers the Cl current. Furthermore, the link between the two currents is expected to be complex, being influenced by intracellular Ca2+ buffering and nonlinear gating of the Cl channel by Ca2+ (14, 19). Thus, it is surprising that the instantaneous (i.e., measured at a given time instant) residual/total current ratio should remain constant over an extended period. Because 300 µM NFA is unlikely to eliminate the Cl current completely (see above), we speculated that the CNG current might in fact have already run its course and that the residual current during the time window in question merely reflected some Cl current still not blocked by NFA. In 15 experiments, the residual/total current ratio ranged between 0.18 and 0.39 (mean ± SD, 0.29 ± 0.07). The cell-to-cell variation could result from a thin layer of nasal mucus overlying the olfactory cilia and preventing full drug access. The mean value of 0.29 for residual Cl current is comparable to the 0.23 found for 300 µM NFA on heterologously expressed ANO2 in HEK293 cells in one study (20), although lower than the 0.53 in another study (41). If there is a genuine difference between native olfactory Ca2+-activated Cl channels and heterologously expressed ANO2 channels, this may conceivably arise from the native channel on ORNs being heteromers containing, for example, multiple ANO2 isoforms (17) or other TMEM16 subunits, instead of homomeric ANO2 channels. Previously, others studying ORNs have also used 300–500 µM NFA as a Cl-channel blocker (e.g., refs. 13, 25, 42, and 43), but a comparison with our measurement is inappropriate because of nonidentical experimental conditions. However, by reanalyzing the data in Lowe and Gold (16) collected under conditions identical to ours except for a higher 500 µM NFA being used, we estimated that their residual Cl current would have been ∼0.19 of the overall receptor current, thus presumably consistent with our measurement.
In Fig. 2B, the residual/total current ratio during the last two NFA pulses in the series (coded magenta and green) exhibited an upswing toward the end of each pulse. This was a consistent observation, which we think reflected a secondary effect of NFA (Methods) albeit not important for the context here. This upswing in the current ratio was not accompanied by an obvious downswing in the corresponding absolute-current trace in Fig. 2 A and B, simply because the value of the ratio is being highly magnified by the very small denominator current (i.e., overall receptor current) toward the end of the response’s decline.
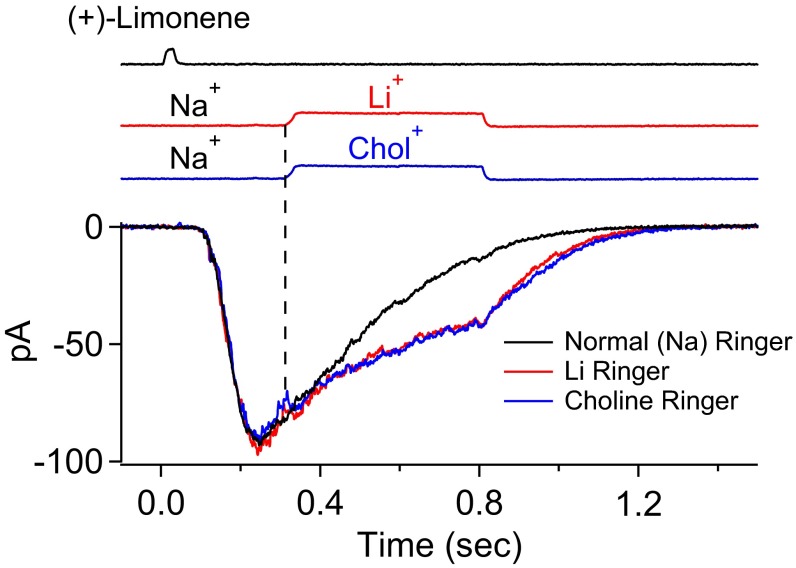
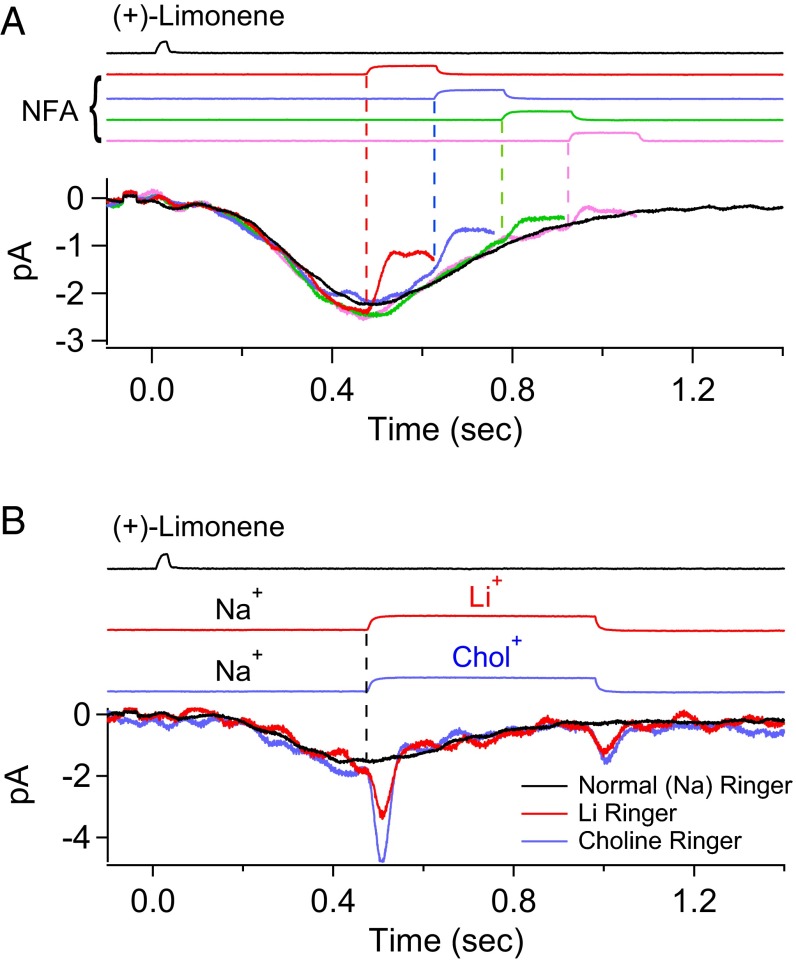
Our interpretation that the residual current in 300 µM NFA during most of the decline phase of the overall receptor current is Cl current and not CNG current—a key tenet underlying the separation of the CNG and Cl currents—is supported by the following experiment. The rationale is that, if the CNG current has indeed already run its course and is at or near zero in the time window under consideration, the overall current response should be unaffected by replacing extracellular Na+ (a major carrier of the native CNG current) with Li+ (as permeant as Na+ through CNG nonselective cation channels) or choline+ (Chol+, impermeant or very weakly permeant) (29, 44–46). Indeed, in Fig. 3 (different ORN from that in Fig. 2), even at a time instant not too long after the transient peak of the olfactory response, the overall current upon rapid replacement of Na+ by Li+ or Chol+ behaved identically (junction currents associated with the cation substitutions were already subtracted away; Methods). The Li+/Chol+ current traces remained the same over time, but both diverged from the control Na+ current trace in Fig. 3 because neither Li+ nor Chol+ is able to drive the Ca2+ extrusion via the 4Na+/Ca2+, K+ exchanger (47) on the ORN’s ciliary membrane (30), thus prolonging the intracellular-Ca2+ elevation and, accordingly, also the Cl current. The gradual, slow decline in the Cl current in the absence of Na+ could be due to the following: (i) a gradual loss of the elevated intraciliary Ca2+ via diffusion into the ORN dendrite, (ii) an extrusion via a putative albeit controversial Ca2+-ATPase (31–35), (iii) an inactivation of the Cl current (19), and/or (iv) an intracellular Cl− depletion owing to the Cl− efflux. A similar observation was previously made by Reisert and Matthews (29), with a similar interpretation.
Fig. 3.
Early termination of CNG current during olfactory response. Replacement of external Na+ by Li+ (permeant cation) or Chol+ (impermeant or near-impermeant cation) as a method to determine whether CNG current is still flowing at a given time instant during the olfactory response. A 30-ms, 3 mM (+)-limonene pulse. At the time instant of Na+ replacement (vertical dashed line), there is no instantaneous shift in the overall response regardless of Li+ or Chol+ as the substituent, indicating that CNG current has already terminated at that moment. See text for details. Junction currents caused by the cation substitutions have already been subtracted away. Timings of (+)-limonene application and cation substitutions based on junction currents are at Top.
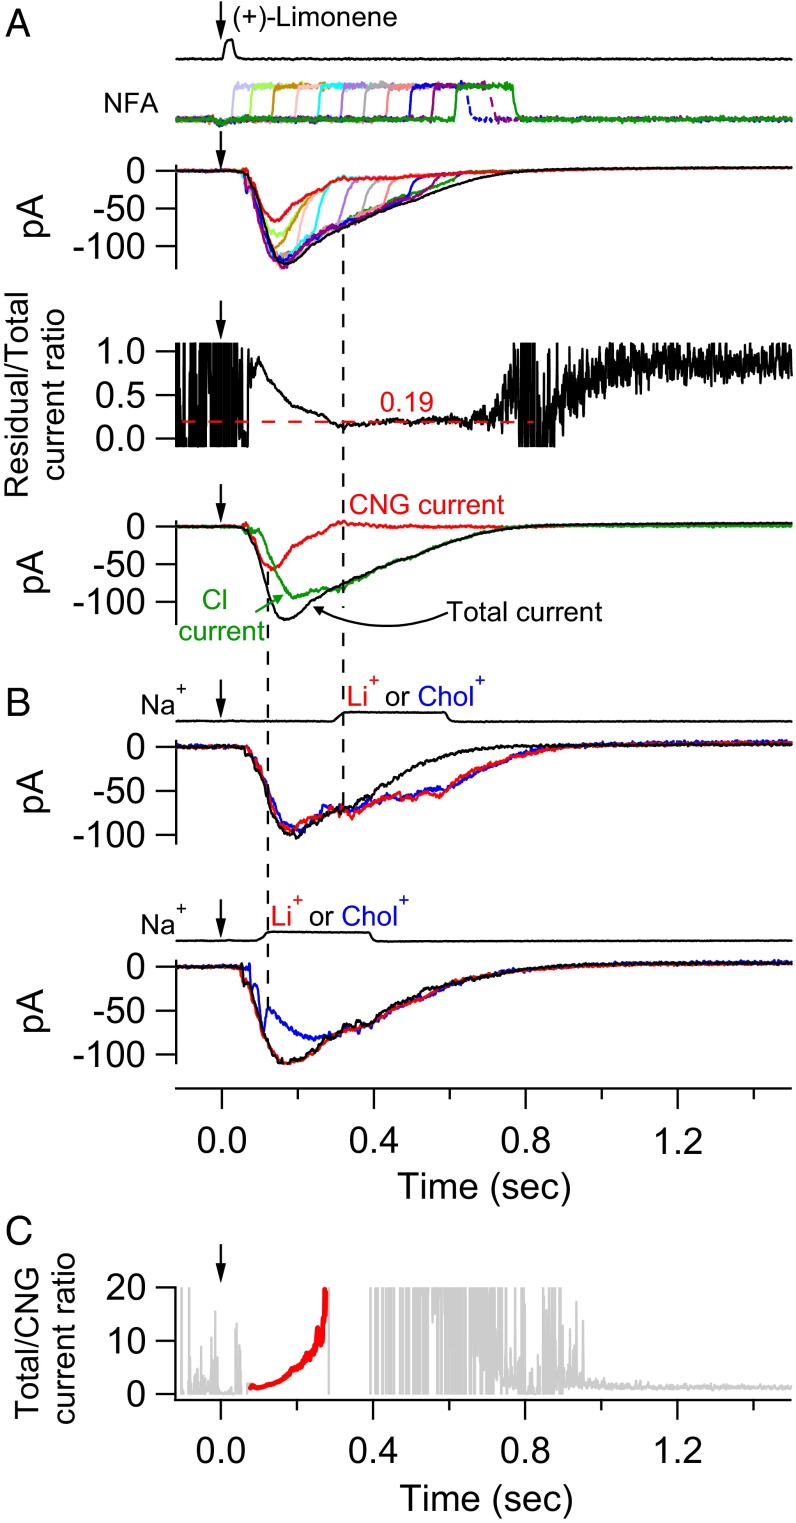
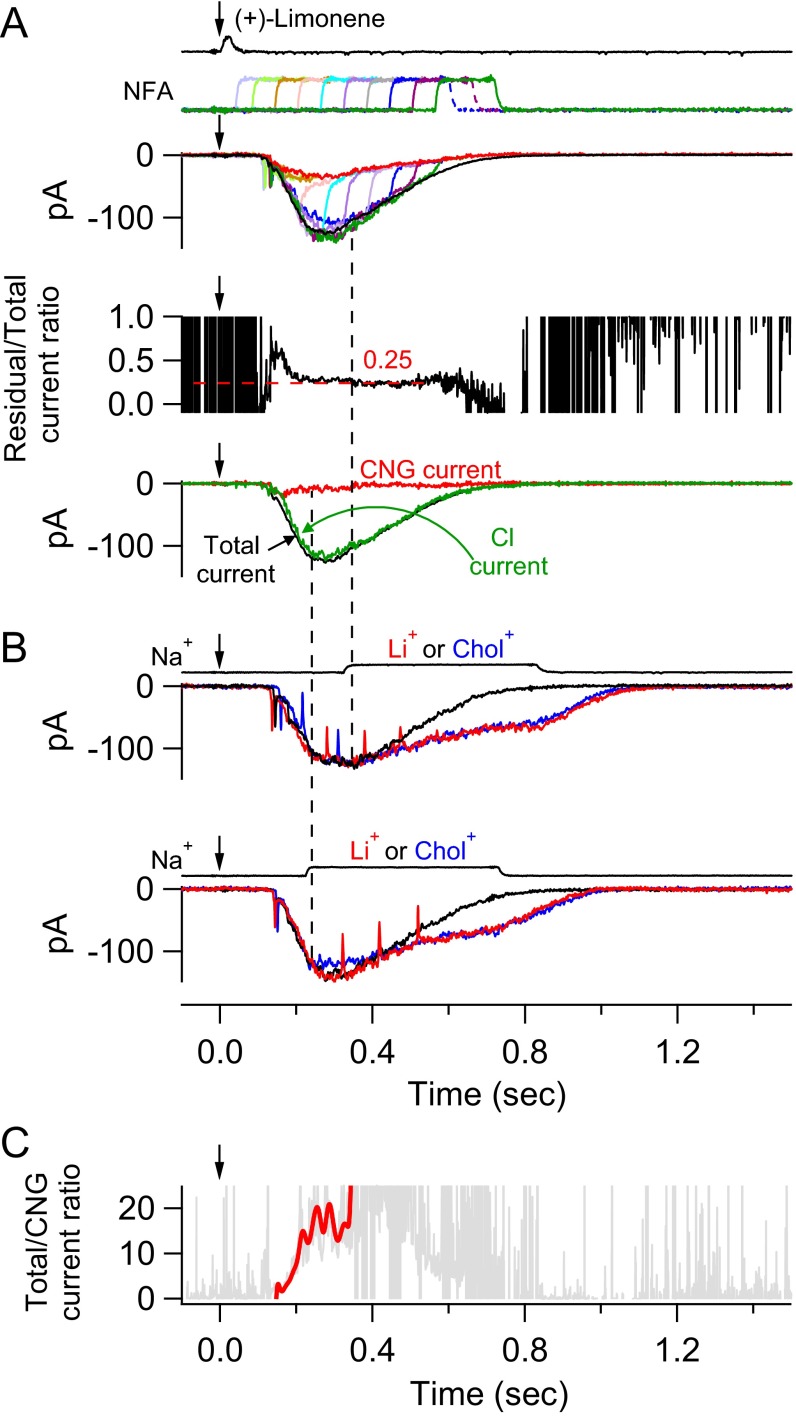
In Fig. 4, we performed a complete experiment by combining the protocols of Figs. 2 and 3 on an ORN to correlate between them. A single 150-ms, 300 µM NFA pulse was delivered in successive trials with progressively longer delays (at 60-ms increments) after the 3 mM (+)-limonene pulse (Fig. 4A, Top, color coded for different delays). The continuous profile of the residual current was obtained from the final common trajectory of all colored traces as in Fig. 2B, giving a final residual/total current ratio plateau of 0.19 (Fig. 4A, Middle). As before, we interpreted this fraction as the Cl current remaining not blocked by NFA. To derive the true Cl current in the olfactory response, we subtracted the residual current from the overall receptor current to obtain the NFA-blocked Cl current, then divided it by (1 − 0.19 = 0.81) to obtain the true Cl current (Fig. 4A, Bottom, green trace). Finally, subtracting this true (i.e., corrected) Cl current from the overall receptor current, we obtained the true CNG current (Fig. 4A, Bottom, red trace). Next, on the same cell, the second half of the experiment involving extracellular-cation substitutions was performed (Fig. 4B). At the time instant when the residual/total current ratio had bottomed out at 0.19 (right dashed vertical line in Fig. 4), there was indeed no CNG current, as indicated by the lack of any rapid shift in the receptor current trace regardless of Na+’s replacement by Li+ or Chol+ (Fig. 4B, Top). Thus, our procedure of separating the CNG and Cl currents appears valid. At a time instant during the response’s rising phase (left dashed vertical line in Fig. 4), in contrast, the overall receptor current showed an almost-instantaneous decrease when Na+ was replaced by Chol+, but little change when Na+ was replaced by Li+ (Fig. 4B, Bottom), validating the existence of a CNG current at this time as derived from the dissection procedure. Incidentally, from Fig. 4A, Bottom, it is clear that the Cl current was still increasing rapidly at the transient peak of the CNG current, thus delaying the transient peak of the overall receptor current.
Fig. 4.
Separation of CNG and Cl currents in olfactory response. (A, Top) Multiple trials (color coded) of a 150-ms, 300 µM NFA pulse delivered with increasing delay (at 60-ms increments) after a 30-ms, 3 mM (+)-limonene pulse (with start time indicated by downward arrow). The final tails of the residual currents in all trials together provide a profile of the overall residual current during NFA application (highlighted in red). For clarity, only the part of each current trace before NFA removal is shown. (Middle) Profile of residual/total current ratio calculated from Top (Fig. 2), showing a plateau value of 0.19 for this ORN. (Bottom) Separated (and corrected) CNG (red) and Cl (green) current components of the overall current response (black) are shown. See text for details regarding calculations in the current separation procedure. (B) Validation of the current separation procedure based on cation substitutions (Fig. 3). Same cell and same odorant stimulus as in A. (Top) Na+ in normal Ringer’s (black) is replaced by Li+ or Chol+ (color coded) at time instant marked by right vertical dashed line, with the lack of difference between the two substituents indicating no or near-zero CNG current. (Bottom) Same procedure as in Top, but at an earlier time indicated by left vertical dashed line. In this case, there is clearly still a CNG current because of the deviation between the Li+-substitution current trace (red; practically no change from normal-Ringer’s trace marked in black) and the Chol+-substitution current trace (blue; rapid reduction in current amplitude from normal Ringer’s) immediately upon cation substitution. Junction currents caused by cation substitutions have already been subtracted away. (C) Temporal profile of the total/CNG current ratio (calculated from respective traces in Bottom of A) reflects the signal amplification due to Cl current. At early and also late times, when the CNG current fluctuates near 0, the total/CNG current ratio fluctuates between −∞ and ∞, hence unreliable and accordingly deemphasized by being plotted in light gray. In the intermediate time window, the ratio is meaningful and highlighted in red.
The signal amplification due to the Ca2+-activated Cl current is given by the total/CNG current ratio, shown by the red trace in Fig. 4C (see legend). It increased steeply from ∼1.0 in the early rising phase of the overall response (when the Cl current had not yet developed) to ∼20 by the time the CNG current had decreased to a very small value. Thereafter, the ratio continued to rise steeply as the CNG current practically disappeared. Another example of this kind of experiment is shown in Fig. S1. For this cell, a small CNG current gave rise to a large Cl current; thus, the total/CNG current ratio, or amplification factor, increased even more steeply with time than for the cell in Fig. 4. Altogether, five ORNs were studied [four cells stimulated with 3 mM (+)-limonene, and one cell with 10 mM (+)-limonene], giving similar results. In the experiments of this section, high (+)-limonene concentrations were used to elicit large overall responses from randomly encountered responsive ORNs, for facilitating the execution of the current separation procedure.
Fig. S1.
Similar experiment as in Fig. 4, but on another ORN. (A, Top) Multiple trials (color coded) of a 150-ms, 300 µM NFA pulse delivered with increasing delay (at 60-ms increments) after a 30-ms, 10 mM (+)-limonene pulse (with start time indicated by downward arrow). The final tails of the residual currents in all trials together provide a profile of the overall residual current during NFA application (highlighted in red). For clarity, only the part of each current trace before NFA removal is shown. (Middle) Profile of residual/total current ratio calculated from Top (Fig. 2), showing a plateau value of 0.25 for this ORN. (Bottom) Separated (and corrected) CNG (red) and Cl (green) current components of the overall current response (black) are shown. See text for details regarding calculations in the current separation procedure. For this cell, the CNG current is quite small, in contrast to the cell in Fig. 4. (B) Validation of the current separation procedure based on cation substitutions (Fig. 3). Same cell and same odorant stimulus as in A. (Top) Na+ in normal Ringer’s (black) is replaced by Li+ or Chol+ (color coded) at time instant marked by right vertical dashed line, with the lack of difference between the two substituents indicating no CNG current. (Bottom) Same procedure as in Top but at an earlier time indicated by left vertical dashed line. In this case, there is clearly still a CNG current because of the deviation between the Li+-substitution current trace (red; practically no change from normal-Ringer’s trace marked in black) and the Chol+-substitution current trace (blue; rapid reduction in current amplitude from normal Ringer’s) immediately upon cation substitution. Junction currents caused by cation substitutions have already been subtracted away. (C) Temporal profile of the total/CNG current ratio (calculated from respective traces in A, Bottom) reflects the signal amplification due to Cl current. At early and also late times, when the CNG current fluctuates near 0, the total/CNG current ratio fluctuates between −∞ and ∞, hence unreliable and accordingly deemphasized by being plotted in light gray. In the intermediate time window, the ratio is meaningful and highlighted in red (after digital filtering with 20-Hz low-pass, eight-pole Bessel filter). The vertical spikes in A and B are action potentials.
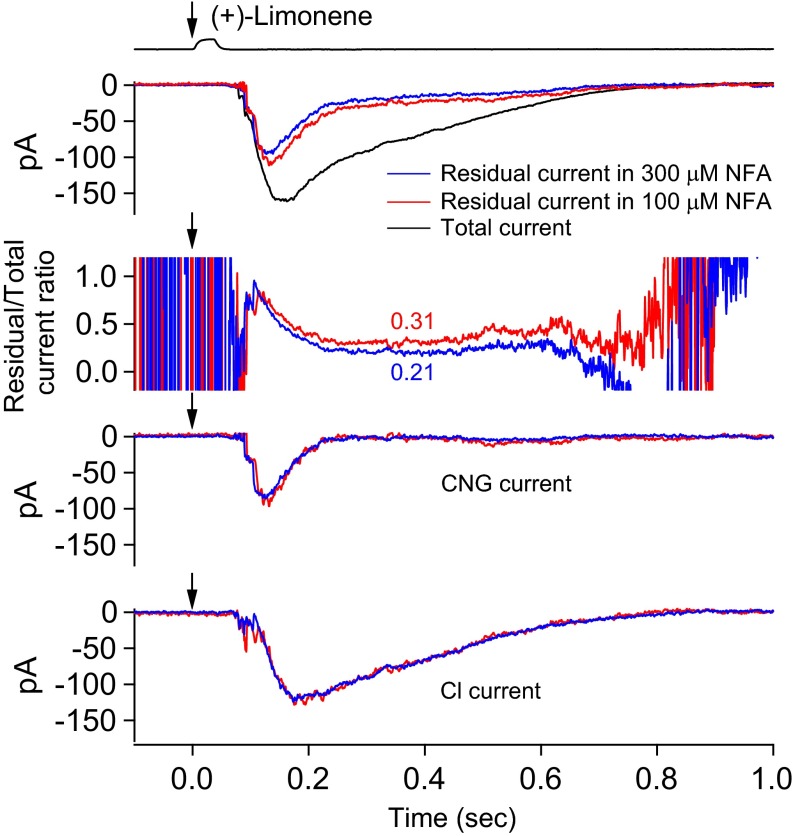
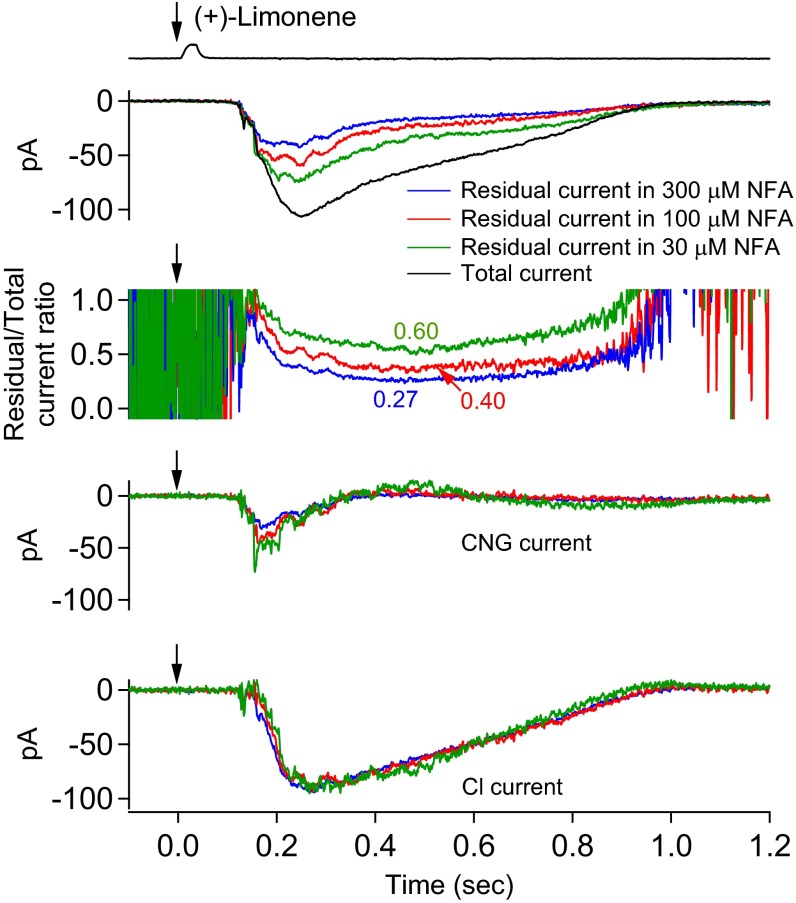
As another validation of the above current separation procedure, we used more than one NFA concentration for a given ORN to see whether they led to the same quantitative current separation. Indeed, in an experiment comparing 300 and 100 µM NFA, both dosages led to the same final result despite different fractions of blocked Cl current (Fig. 5). The same was found in another experiment with three different NFA concentrations to cover an even wider range of fractional Cl current blockage (Fig. S2). Altogether, four multi-NFA concentration experiments were carried out. A useful implication from this experiment is that our current separation procedure is not affected by potential cell-to-cell variations in the fractional Cl current blockage by NFA such as due to mucus overlying the cilia (see above), because this is equivalent to different NFA concentrations.
Fig. 5.
Another validation of current separation procedure by using different NFA concentrations. Different NFA concentrations, which leave different fractions of residual Cl currents, are used as another validation of the current separation procedure. At Top, the black trace indicates overall response; blue trace indicates overall profile of residual current during 300 µM NFA based on multiple trials of 150-ms NFA pulses applied with incremental delays (at 60-ms increments) after odorant pulse (Fig. 4); red trace indicates same procedure but with 100 µM NFA. Other panels have same meanings as Fig. 4A, Middle and Bottom; color coded for the two NFA concentrations, respectively. Despite the two NFA concentrations leading to different fractional residual currents (0.31 and 0.21, respectively), we arrive at near-identical CNG and Cl currents. See text associated with Fig. 4 for details regarding calculations in procedure. A 30-ms, 3 mM (+)-limonene pulse (with start timing indicated by downward arrow).
Fig. S2.
Similar experiment as in Fig. 5, but with multiple NFA concentrations and on another ORN. Different NFA concentrations, which leave different fractions of residual Cl currents, are used as another validation of the current separation procedure. In Top, the black trace indicates overall response; the blue trace indicates overall profile of residual current during 300 µM NFA based on multiple trials of 150-ms NFA pulses applied with incremental delays (at 60-ms increments) after odorant pulse (Fig. 4); red trace indicates same procedure but with 100 µM NFA; and green trace indicates the same with 30 µM NFA. Other panels have same meanings as in Fig. 4A, Middle and Bottom; color coded for the three NFA concentrations, respectively. Despite the three NFA concentrations leading to different fractional residual currents (0.60, 0.40, and 0.27, respectively), we arrive at near-identical CNG and Cl currents. See text associated with Fig. 4 for details regarding calculations in procedure. A 30-ms, 3 mM (+)-limonene pulse (with start timing indicated by downward arrow).
CNG Current and Cl Current at Different Odorant Strengths.
The next question is how the CNG and Cl currents change correlatively at different odorant strengths. This is a challenging question to address because a current separation experiment at one odorant strength typically required 15–30 min to complete; thus, exceptional recording stability was necessary for multiple odorant strengths. Moreover, the recorded ORNs were randomly encountered, each expressing an unknown OR species (48). As such, even for an encountered cell that was responsive to (+)-limonene (∼1 per 15–20 cells as stated earlier), its absolute sensitivity could not be anticipated, making the beforehand preparation of (+)-limonene solutions of appropriate concentrations rarely possible. In short, it was a hit-and-miss situation.
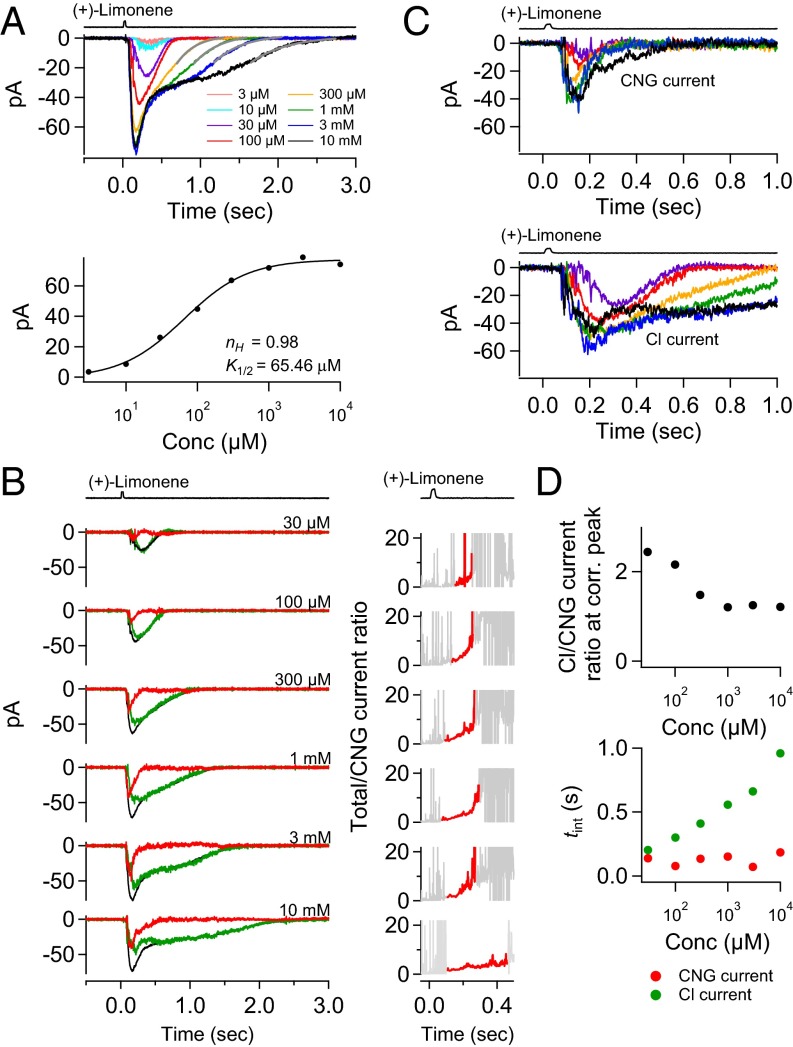
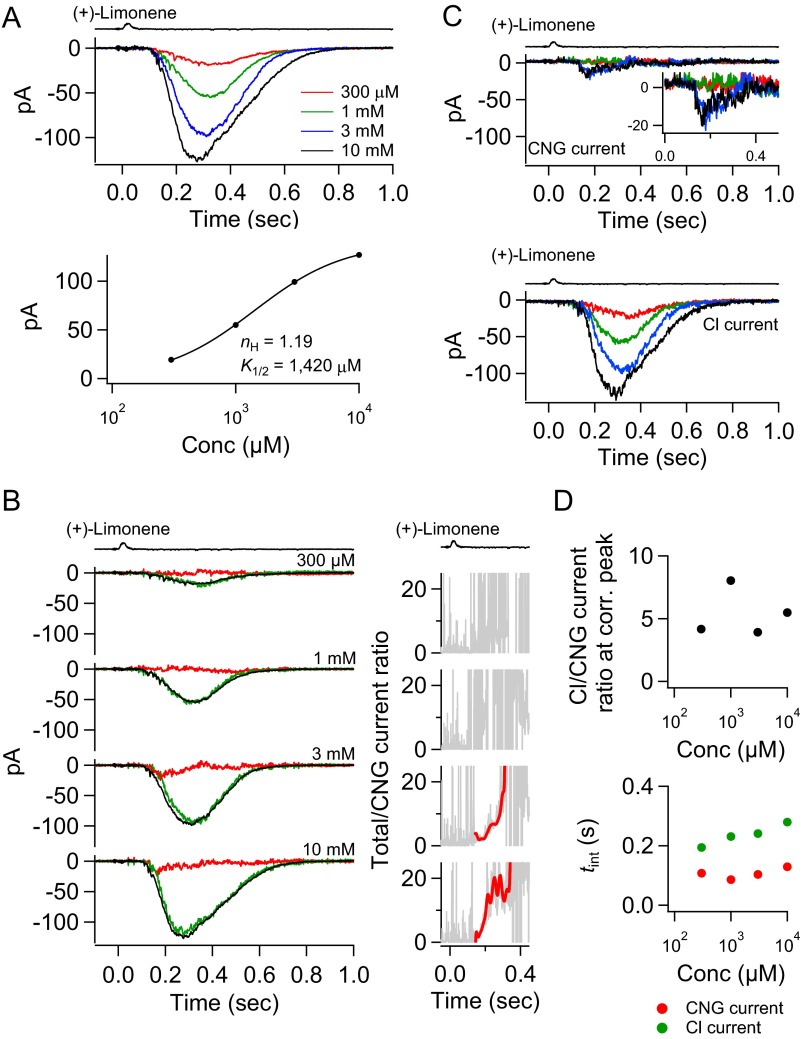
Fig. 6 shows a successful experiment, with the cell lasting 5–6 h. The (+)-limonene-pulse duration was kept constant at 30 ms, and the odorant concentration was increased progressively from 3 µM to 10 mM, a ∼3,000-fold change. The transient peak of the overall response appeared to have eventually reached the saturated amplitude, although the response’s decline phase continued to lengthen with higher (+)-limonene concentrations (Fig. 6A, Top). It was impossible to test (+)-limonene concentrations beyond 10 mM, because at this concentration there was already sign of (+)-limonene precipitating out of solution. The dose–response relation for this cell had a Hill coefficient, nH, of 0.98 (Fig. 6A, Bottom). From 16 cells, nH ranged from 0.71 to 2.96 (mean ± SD, 1.53 ± 0.74), generally lower than found in our previous experiments on frog ORNs with cineole as the odorant (37). In these earlier experiments, odorant strength was changed by varying the odorant pulse duration, although in principle there should be no difference between varying pulse concentration and varying pulse duration provided that the “impulse stimulus” condition is observed, which should apply at least for the weakest stimulus strengths (Methods). Because this paper focuses on the separation of CNG and Cl currents, we shall not pursue this issue about nH further, which in any case does vary across studies by us and others.
Fig. 6.
Separated CNG and Cl currents at different odorant strengths. (A, Top) Response family of an ORN to a 30-ms pulse of (+)-limonene at 3 µM, 10 µM, 30 µM, 100 µM, 300 µM, 1 mM, 3 mM, and 10 mM, respectively. (Bottom) Semilog plot of stimulus–response relation from response family in Top. Smooth curve is Hill equation, with indicated Hill coefficient (nH) and half-saturating concentration (K1/2) values. (B, Left) Total current (black) from A at different (+)-limonene concentrations together with corresponding CNG (red) and Cl (green) currents. Current separation is not carried out for 3 and 10 µM (+)-limonene because total currents under ∼20 pA are too small for reliable dissection in the presence of action potentials. The CNG- and Cl-current noise levels are higher than the total-current noise level because the procedure for deriving the CNG- and Cl-current components involves a scaling factor >1 [equals 1/(1 − 0.39) = 1.64 for this cell] (see text associated with Fig. 4), thus amplifying the noise. (Right) Total/CNG current ratio showing the signal amplification from the Cl current at each odorant strength. See Fig. 4C (legend) for details. (C) Families of CNG and Cl currents from B, each plotted overlaid and expanded to show the progressive change in kinetics. Color-coding matches that in Top of A. Note that the time-to-peak of CNG current shortens as odorant strength increases, reflecting development of olfactory adaptation (see text). The follower Cl current shows the same behavior. (D, Top) Cl/CNG-current ratio at their corresponding transient peaks at each concentration of (+)-limonene. (Bottom) Integration time (tint; see text) of CNG and Cl currents at different odorant strengths.
From the separated currents (Fig. 6B), it is clear that a small CNG current elicited by a weak (+)-limonene pulse could still lead to a substantial Cl current. Furthermore, with increasing odorant strength, the Cl current grew and approached saturation fairly quickly. Further increase in odorant strength typically led mostly to a larger CNG current, but especially to a more prolonged Cl current, again highlighting that the overall response during its final decline was composed predominantly of the Cl current. The smaller Cl current at 10 mM than at 3 mM (+)-limonene for this cell was probably an anomaly, perhaps due to some imperfection in the current dissection at 10 mM (+)-limonene or to the cell changing condition toward the end of the experiment. An interesting feature of the dissected CNG current is that, besides its amplitude increasing with higher odorant strength, its transient peak also occurred at progressively earlier times [i.e., a shorter “time-to-peak” between the stimulus timing and the transient peak (49, 50)] (Fig. 6C, Upper). This behavior is reminiscent of the responses of retinal rods to light flashes of increasing intensity, with the shorter time-to-peak reflecting that light adaptation in the cGMP-mediated phototransduction pathway leads to accelerated deactivation of the flash response (49, 50). Tentatively, we make the same interpretation here involving olfactory adaptation in the cAMP-signaling pathway. The dissected Cl current exhibited a similar behavior, albeit slower, in part because it was a follower current of the CNG current (Fig. 6C, Lower).
The total/CNG current ratio, signifying the signal amplification by the Cl current, is shown as a function of time at each odorant concentration in Fig. 6B, Right. For weak stimuli, the signal amplification increased with time and typically with increasing odorant strength (red trace; see legend). At the strongest stimuli, however, the amplification actually decreased as the Cl current progressively approached saturation before the CNG current. Fig. 6D, Top, shows the Cl/CNG current ratio at the currents’ corresponding transient peaks as a function of odorant strength, providing a sense of their relative transient-peak values. In this cell, the ratio between the maximum Cl and CNG currents approached unity as the overall response reached saturation. From eight cells (see Table S1, with ORN 2 not included here because the response had not reached saturation) that gave saturated or near-saturated responses, this ratio ranged from 0.97 to 4.64 (mean ± SD, 2.38 ± 1.21), roughly comparable to what was found previously in newt and Xenopus (15, 21), although the responses in the latter two studies might not have reached saturation. Previous measurements from an entire cilium excised from frog ORNs also gave a ratio between the fully activated Cl and CNG currents of near unity (51). The slightly higher mean Cl/CNG current ratio we obtained from intact cells with odorants compared with that obtained by Kleene (51) from an excised cilium with high Ca2+ and cAMP concentrations may be real because an odorant even at high strength may not necessarily open all CNG channels on the cilium, depending on the affinity and expression level of the OR, among other factors; on the other hand, based on our findings here, the saturated opening of all Cl channels is more probable. Fig. 6D, Bottom, shows the respective integration time (tint) of the CNG and Cl currents, with tint being defined as tint = ∫ f(t)dt/fp, where f(t) is the function describing the current waveform and fp is the value of f(t) at its transient peak (52). tint provides a measure of how long the respective current lasts. Thus, the tint of the Cl current keeps increasing with odorant strength.
Table S1.
Collected data of dissected CNG and Cl currents
| ORN | (+)-Limonene concentration, μM | Total peak current, pA | Cl peak current, pA | CNG peak current, pA | Cl/CNG peak current ratio | Total/CNG peak current ratio | Cl/CNG charge ratio | Total/CNG charge ratio |
| 1 | 10,000 | 74.1 | 50.4 | 41.6 | 1.2 | 1.8 | 6.3 | 7.3 |
| (Fig. 6) | 3,000 | 78.7 | 62.5 | 50.1 | 1.2 | 1.6 | 6.3 | 6.9 |
| 1,000 | 71.7 | 52.0 | 43.2 | 1.2 | 1.7 | 4.4 | 5.4 | |
| 300 | 63.6 | 52.1 | 35.2 | 1.5 | 1.8 | 4.5 | 5.5 | |
| 100 | 44.7 | 41.3 | 19.1 | 2.2 | 2.3 | 5.0 | 5.6 | |
| 30 | 26.1 | 29.9 | 12.3 | 2.4 | 2.1 | 3.0 | 3.9 | |
| 2 | 10,000 | 127.1 | 123.1 | 22.5 | 5.5 | 5.7 | 11.8 | 12.8 |
| (Fig. S3) | 3,000 | 99.2 | 98.1 | 25.0 | 3.9 | 4.0 | 9.1 | 10.1 |
| 1,000 | 55.1 | 58.2 | 7.2 | 8.0 | 7.6 | — | — | |
| 300 | 19.2 | 23.3 | 5.6 | 4.2 | 3.4 | — | — | |
| 3 | 10,000 | 115.7 | 93.0 | 40.3 | 2.3 | 2.9 | 6.5 | 7.5 |
| 3,000 | 93.4 | 79.5 | 27.2 | 2.9 | 3.4 | 5.5 | 6.6 | |
| 1,000 | 81.2 | 70.1 | 13.2 | 5.3 | 6.2 | 8.8 | 9.9 | |
| 300 | 61.6 | 60.9 | 12.1 | 5.0 | 5.1 | 8.5 | 9.6 | |
| 4 | 10,000 | 91.1 | 69.8 | 23.8 | 2.9 | 3.8 | 6.9 | 7.9 |
| 3,000 | 68.8 | 51.6 | 25.1 | 2.1 | 2.7 | 4.5 | 5.5 | |
| 1,000 | 39.2 | 34.0 | 13.8 | 2.5 | 2.8 | 3.1 | 4.1 | |
| 5 | 10,000 | 106.0 | 106.3 | 22.9 | 4.6 | 4.6 | 10.2 | 10.5 |
| 3,000 | 94.9 | 95.0 | 8.1 | 11.7 | 11.7 | 13.7 | 14.8 | |
| 1,000 | 78.4 | 78.4 | 6.7 | 11.6 | 11.6 | 10.9 | 11.9 | |
| 300 | 38.3 | 38.3 | — | — | — | — | — | |
| 6 | 3,000 | 65.6 | 54.3 | 31.4 | 1.7 | 2.1 | 5.4 | 6.4 |
| 1,000 | 64.7 | 60.8 | 9.4 | 6.5 | 6.9 | 13.1 | 13.5 | |
| 300 | 51.6 | 51.6 | — | — | — | — | — | |
| 100 | 28.4 | 28.4 | — | — | — | — | — | |
| 7 | 10,000 | 101.6 | 101.6 | 30.8 | 3.3 | 3.3 | 12.5 | 13.4 |
| 3,000 | 79.5 | 79.5 | 28.4 | 2.8 | 2.8 | 7.5 | 8.5 | |
| 1,000 | 68.7 | 68.7 | 37.9 | 1.8 | 1.8 | 5.0 | 6.0 | |
| 300 | 48.7 | 46.7 | 24.0 | 1.9 | 2.0 | 3.5 | 4.5 | |
| 8 | 10,000 | 166.5 | 130.4 | 65.3 | 2.0 | 2.5 | 6.0 | 7.0 |
| 3,000 | 151.7 | 126.2 | 40.6 | 3.1 | 3.7 | 6.3 | 6.9 | |
| 1,000 | 131.9 | 99.2 | 45.5 | 2.2 | 2.9 | 4.5 | 5.5 | |
| 300 | 104.2 | 79.8 | 43.1 | 1.9 | 2.4 | 3.2 | 4.2 | |
| 9 | 10,000 | 106.0 | 77.6 | 79.9 | 1.0 | 1.3 | 3.0 | 4.0 |
| 3,000 | 98.1 | 73.2 | 51.5 | 1.4 | 1.9 | 3.5 | 4.4 | |
| 1,000 | 70.8 | 52.0 | 38.2 | 1.4 | 1.9 | 2.6 | 3.6 | |
| 300 | 34.9 | 36.0 | 10.1 | 3.6 | 3.5 | 6.8 | 7.8 |
The CNG and Cl currents were dissected in the manner shown in Fig. 6 and Fig. S3. Altogether, nine ORNs were studied. “Total peak current,” “Cl peak current,” and “CNG peak current” refer to each current’s amplitude at its respective transient peak. The “Cl/CNG peak current ratio” gives a sense of the relative Cl and CNG currents at a given odorant concentration. At high odorant concentration, if each current has indeed reached saturation (quite likely the case for the Cl current but not necessarily the case for the CNG current; see text in connection with Fig. 6), this ratio gives the relative maximal Cl and CNG currents on the cilia available for activation. The “total/CNG peak current ratio” gives a sense of the signal amplification provided by the Cl current. This parameter, however, is not identical to the “total/CNG peak current ratio” in Fig. 6B, Right, which is plotted as a function of time. ORN 1 is the cell in Fig. 6, and ORN 2 is that in Fig. S3. The “Cl/CNG charge ratio” and the “total/CNG charge ratio” have similar meanings as the current ratios, except that each current has been integrated over its respective time course to give overall charge flux. Dashes (—) indicate that the current at transient peak and/or total charge are not obtainable owing to the near-zero CNG current and/or its ill-defined time course. Note that each ORN is randomly encountered and therefore has variable sensitivity to (+)-limonene; the data at a given (+)-limonene concentration thus cannot readily be compared across cells.
The results from another cell are shown in Fig. S3. This cell was quite insensitive to (+)-limonene, and we unfortunately did not have (+)-limonene solutions strong enough to saturate the overall response and beyond (Fig. S3A). Consequently, we were unable to observe the full behavior of the CNG and Cl currents in response to increasing (+)-limonene concentration. This cell otherwise gave results broadly similar to those in Fig. 6, such as the high signal amplification provided by the Cl current. Altogether, nine cells were studied (Table S1). It is worth noting that, in the above current separation procedure, the CNG current was obtained by subtracting the corrected Cl current from the total current response. Thus, the reliability of the extracted CNG current depends on an accurate estimate of the Cl current, which in turn depends on the measurability of the residual current upon NFA application. It is therefore actually advantageous not to use a very high NFA concentration because the residual current would otherwise be too small to be measured accurately. Also, for weak odorant strengths or for ORNs that somehow have a small odorant-triggered CNG current, the Cl current will be very similar to the total current, thus making their difference (which equals the CNG current) potentially more sensitive to random measurement fluctuations.
Fig. S3.
Similar experiment as in Fig. 6 but on another ORN. (A, Top) Response family of an ORN to a 30-ms pulse of (+)-limonene at 300 µM, 1 mM, 3 mM, and 10 mM, respectively. (Bottom) Semilog plot of stimulus–response relation from response family in Top. Smooth curve is Hill equation, with indicated Hill coefficient (nH) and half-saturating concentration (K1/2) values. (B, Left) Total current (black) from A at different (+)-limonene concentrations together with corresponding CNG (red) and Cl (green) currents. Despite the almost unresolvable CNG current at 300 µM and 1 mM (+)-limonene, a large Cl current, and hence total current, is triggered. (Right) Total/CNG current ratio showing the signal amplification from the Cl current at each odorant strength. See the legend of Fig. S1C for details. Because the CNG current is near 0 for both 300 µM and 1 mM (+)-limonene, the total/CNG current ratio cannot be resolved. (C) Families of CNG and Cl currents from B, plotted as overlaid and expanded to show the progressive change in kinetics. Color-coding matches that in A, Top. Although the tiny CNG current at low odorant strengths precludes detecting the shortening of its time-to-peak with increasing odorant strength (reflecting olfactory adaptation) as observed in the ORN of Fig. 6, the follower Cl current nonetheless shows this behavior (Fig. 6C). (D, Top) Cl/CNG current ratio at their corresponding transient peaks at each concentration of (+)-limonene. (Bottom) Integration time (tint; see text) of CNG and Cl currents at different odorant strengths.
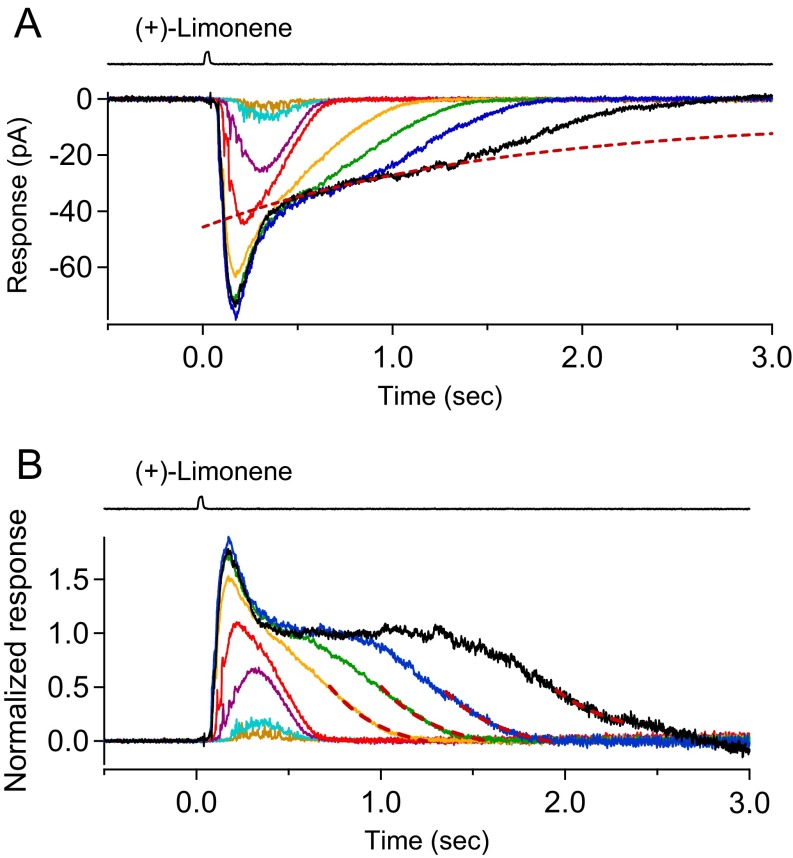
Finally, in the experiment of Fig. 6, as the odorant strength continued to increase beyond response saturation, the final response decline maintained fairly stereotyped kinetics except for the ever-increasing time delay (Fig. 6A). A similar behavior was previously observed for retinal rod photoreceptors (50). It is clear from the current dissection (Fig. 6B) that the suprasaturated response during most of its decay consisted literally exclusively of a Cl current that was initially saturated. Its gentle decline during saturation could be due to a gradual channel inactivation or Cl depletion (see above). Focusing on the final, steeper response decay, we removed the complication due to the gentle decline by normalization (Fig. S4, same cell as in Fig. 6). After normalization, the final Cl current decline followed roughly a single exponential, with a time constant of 0.32 s (dashed red curves in Fig. S4B; replotted as solid gray curves in Fig. 6A after removing the normalization), presumably representing the loss of free Ca2+ from the cilium due to combined Ca2+ extrusion and passive diffusion into the ORN’s dendrite. From three ORNs particularly sensitive to (+)-limonene to allow saturation of their olfactory responses and far beyond, the final Cl current decline time constant was 0.32 ± 0.03 s (mean ± SD).
Fig. S4.
Relaxation kinetics of olfactory response after correcting for sag in saturated Cl current. (A) Same odorant response family as in Fig. 6A. Red dashed line is a single-exponential decline fit to the first, gentle phase of decay in the response to 10 mM (+)-Limonene, interpreted as a sag in the saturated Cl current (see text). Its exact mathematical expression is unimportant, as long as it roughly describes the response’s gentle decline; we used g(t) = −6.8 pA − 38.9 pA × exp(−t/1.54 s), where t is time. (B) Response family shown in A normalized by the single-exponential decline fit to the gentle decline, by dividing the response family at any time instant by the fit, giving a response plateau before the final decay. The final decays in the responses to 300 μM, 1 mM, 3 mM, and 10 mM (+)-limonene also fit a single-exponential decline function (red dash lines), with similar time constants of 0.29, 0.32, 0.33, and 0.34 s, respectively.
Cl Current in Olfactory Response Near Threshold.
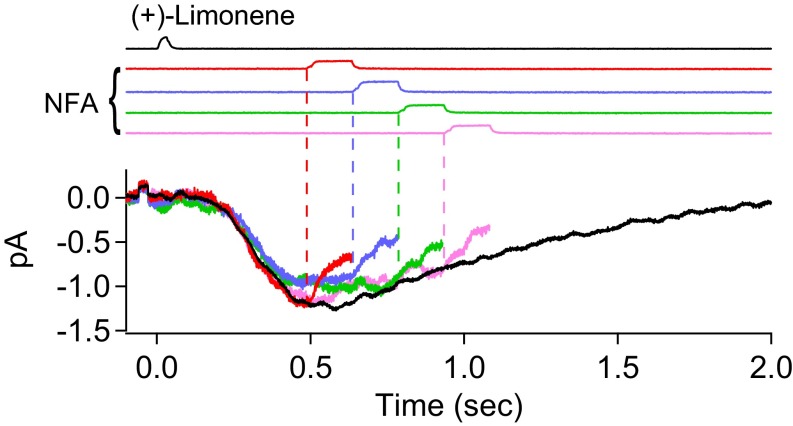
To push the dissection of the receptor current all of the way to near response threshold in frog ORNs for signaling to the brain [∼1.2 pA (53)], it is necessary to remove action potential firing, which interferes with the detection of small signals even after averaging over many stimulus trials (as for large depolarizing signals, action potential firing was typically confined to the onset of the response because of Na- and Ca-channel inactivations, and therefore not as much of an issue). For this purpose, we added 500 nM tetrodotoxin (TTX), 50 µM verapamil, and 1 µM mibefradil in the suction pipette solution and all bath solutions to block voltage-gated Na current and Ca currents (L and T types). Fig. 7A shows an ORN’s response of only ∼2 pA at transient peak elicited by 100 µM (+)-limonene. A 300 µM NFA pulse at different time delays still substantially reduced the overall response. Because the overall response was so small, we decided against a quantitative dissection of the currents, except noting that the Cl current was still substantial. Fig. 7B shows the same ORN, with its response of ∼1.5 pA near threshold being interrogated by the cation substitution experiment. As in Fig. 3, there was practically no difference in the response between Li+ and Chol+ substitutions (the fast, transient downward deflection in both cation substitution traces reflect imperfect removal of the junction currents; Methods), indicating that the CNG current was literally below resolution. Altogether, six NFA and two substitution experiments were carried out, with similar conclusions (Fig. S5).
Fig. 7.
Substantial Cl current still present in near-threshold olfactory response. To eliminate action potentials, 50 μM verapamil (L-type Ca-channel blocker), 1 μM mibefradil (T-type Ca-channel blocker) and 500 nM TTX are included in pipette and all bath solutions except for odorant solution. Signals are low-pass filtered at 20 Hz (eight-pole Bessel). (A) Near-threshold odorant response (black trace) elicited by a weak stimulus [30-ms, 100 μM (+)-limonene pulse] is subjected to successive 150-ms, 300 µM NFA pulses with increasing time delays (at 150-ms increments; color coded). Each trace is the average of >15 stimulus trials; duration between successive stimulus trials is 60 s. (B) Similar experiment as in Fig. 3 on near-threshold odorant response. At the time instant of replacement of external Na+ by Li+ or Chol+ (vertical dashed line), the currents recorded in Li+-, Chol+-, and Na+-Ringer’s are nearly the same, suggesting practically no CNG current at that instant. Junction currents caused by the cation substitutions have already been subtracted away, although the downward transients in both traces immediately after each solution change indicate that the subtractions are imperfect (note the high gain in the ordinate scale). Each trace is the average of >10 stimulus trials; duration between successive stimulus trials is 30 s. Timings of (+)-limonene application and cation substitutions based on junction currents are indicated at Top.
Fig. S5.
Cl current at response threshold. Similar experiment as in Fig. 7 but in another ORN with even less receptor current. Near-threshold odorant response (∼1.2 pA; black trace) elicited by a weak odorant stimulus [30-ms, 100 μM (+)-limonene pulse] is subjected to successive 150-ms, 300 µM NFA pulses with increasing time delays (at 150-ms increments; color coded), showing an obvious suppression, confirming the existence of Cl current in threshold response. Each trace is the average of >15 stimulus trials; duration between successive stimulus trials is 60 s. The 50 μM verapamil, 1 μM mibefradil, and 500 nM TTX were included in the pipette and all bath solutions to eliminate the action potentials. Signals are low-pass filtered at 20 Hz (eight-pole Bessel) to minimize the noise.
Low Extracellular NaCl Concentration.
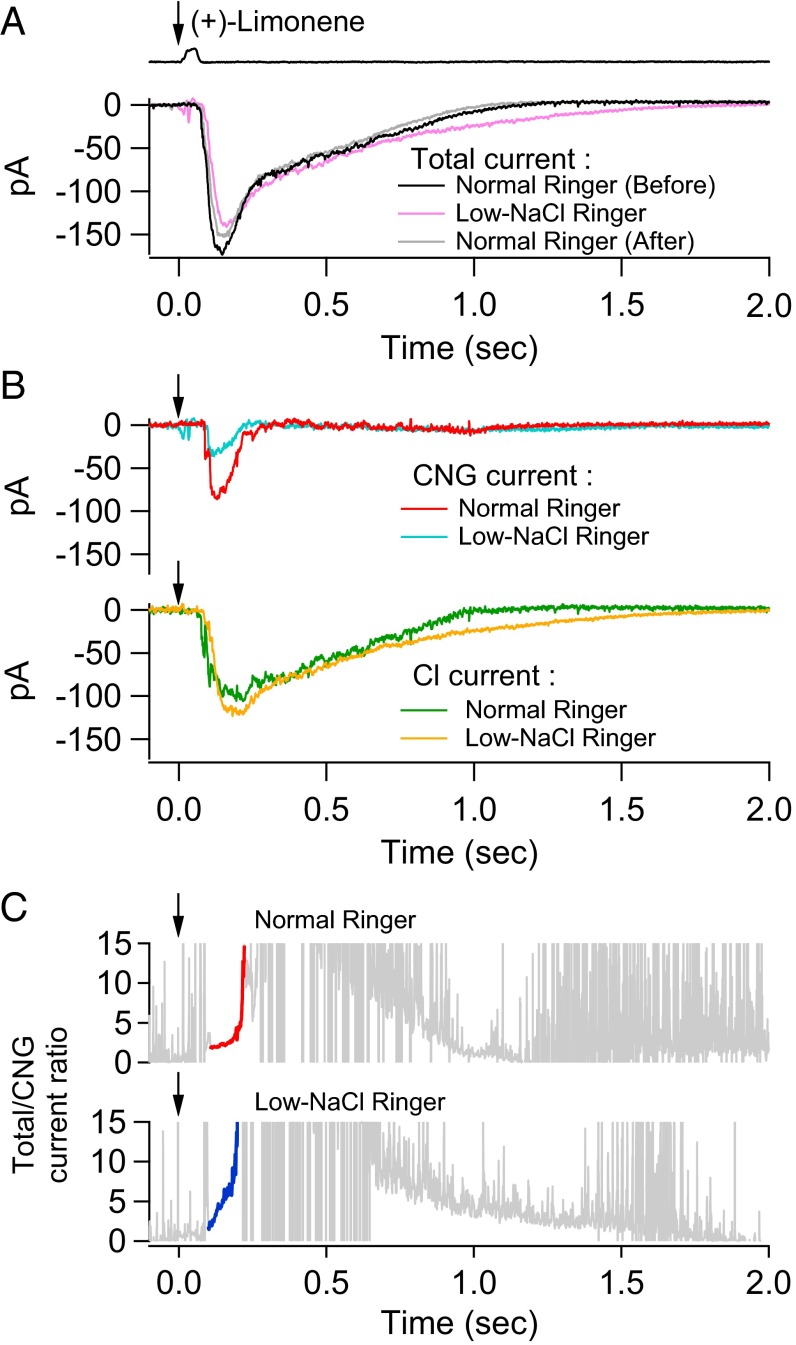
In the nasal cavity, the olfactory cilia are bathed in only a thin layer of overlying mucus with ion concentrations possibly quite different from plasma, with reported [Na+] ∼ 53–85 mM, [Cl−] ∼ 93 mM, and [Ca2+] ∼ 0.3–5 mM for toad and frog (54, 55). Interestingly, early work by others has shown that the EOG persists even in the complete absence of extracellular NaCl (56), attributed subsequently to the compensation of a decreased CNG current [with Ca2+ as the dominant residual current carrier (57)] by an increased inward Ca2+-activated Cl current owing to the larger outward Cl− electrochemical gradient (15). Given the ability to separate the CNG and Cl currents, we wanted to verify this behavior. As a test case, we examined an ORN’s olfactory response in a somewhat arbitrary low-NaCl Ringer’s by reducing NaCl to one-half that in normal Ringer’s (namely, replacing 110 mM NaCl with 55.5 mM Na methanesulfonate and 55.5 mM CholCl) (Fig. 8). Upon switching to low-NaCl solution (and staying in it for no more than about 10 s), the cell’s overall response to (+)-limonene was reduced by ∼15–20%, with the change being almost completely reversible (Fig. 8A). As expected, in low-NaCl Ringer’s solution, the separated CNG current was considerably smaller than in normal Ringer’s, whereas the Cl current was a bit larger (Fig. 8B). The Cl current in low-NaCl solution was also somewhat prolonged, due to the 4Na+/Ca2+, K+ exchanger being slowed by lower external Na+. Additionally, in Fig. 8A, the rising phase of the overall response in low-NaCl Ringer’s was slightly delayed due to the much smaller CNG current and a consequently slightly delayed follower Cl current. Not surprisingly, as shown in Fig. 8C, the amplification factor (instantaneous total/CNG current ratio) in low-NaCl Ringer’s rose even more steeply with time than in normal Ringer’s. Thus, if NaCl is indeed low in nasal mucus, the Cl current should be even more prominent in the overall olfactory response. Four experiments gave largely similar results, in two of which the total receptor current in low-NaCl Ringer’s was actually larger than that in normal Ringer’s, reflecting the smaller CNG current being more than compensated by a larger Cl current. We have also done experiments (four cells; Fig. S6) in which the recorded ORN’s cilia were bathed in low-NaCl Ringer’s for up to several minutes to allow the intraciliary ion concentrations to reach equilibrium, and found the overall response to behave similarly to that described here (although the time-consuming separation of CNG and Cl currents was not carried out). For amphibians, the ion concentrations in the nasal cavity may sporadically drop even more when exposed to freshwater in the animal’s natural habitat. Nonetheless, the Cl current’s presence ensures that the overall olfactory receptor current persists without decrement (15).
Fig. 8.
Odorant response in normal versus low-NaCl Ringer’s. (A) Comparison of an ORN’s response to a 30-ms, 3 mM (+)-limonene pulse in normal Ringer’s (black), then in low-NaCl Ringer’s (NaCl concentration halved; pink), and then back in normal Ringer’s (gray). The cell stays in low-NaCl Ringer’s solution for altogether no more than 10 s. (B) Separated CNG current and Cl current in normal (“Before”) and low-NaCl Ringer’s solution, respectively. (C) Total/CNG current ratio in normal and low-NaCl Ringer’s, respectively (Fig. 4C, legend). Downward arrow indicates start of odorant pulse.
Fig. S6.
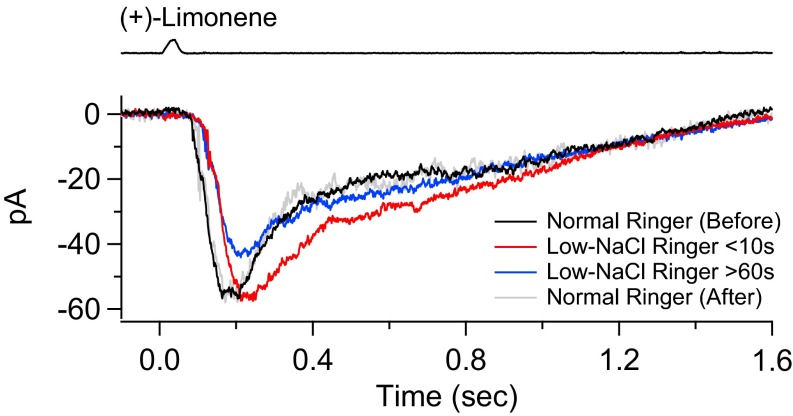
Odorant response in normal Ringer’s and in (longer-exposure) low-NaCl Ringer’s. Same experiment as in Fig. 8 but includes a longer exposure (several minutes) to low-NaCl Ringer’s to allow the intraciliary ion concentrations to reach equilibrium. The olfactory response is elicited by a 30-ms pulse of 3 mM (+)-limonene first in normal Ringer’s (black trace), then in low-NaCl Ringer’s (NaCl concentration halved) for less than 10 s (red trace), and once more for >60 s (blue trace), and then finally back to normal Ringer’s (gray trace). Each trace is the average of three stimulus trials except for gray trace (single trial). No separation of CNG and Cl currents is carried out because it is too involved and time consuming under the solution conditions.
Discussion
We have achieved a quantitative separation of the CNG and Cl currents composing the ORN’s response to odorants. The existence of a Cl current additional to the CNG current in the olfactory response has been known for 25 years (14–16), but up to now the exact profile of each component has remained unclear. Similar to what other workers in the field have done in the past, we made use of the Cl-channel blocker, NFA, but with two important advances. First, we showed that, in contrast to a recent report (36), NFA actually does not have the side effect of partially inhibiting the CNG current (13). NFA nonetheless appears to interfere with the interaction between odorant and OR, but we can sidestep this problem by applying NFA only after the odorant stimulus. Second, even though NFA fails to block the Cl current completely—an issue up to now undealt with in the field—we have managed to correct for this incomplete blockage and tease apart the CNG and Cl currents fairly accurately. Indeed, as described in Results, given that the Cl current blockage is unable to ever reach 100% at realistic NFA concentrations, we have actually turned this incomplete block into an advantage for the separation of currents.
Importantly, despite with extreme difficulty, we have also succeeded in correlating the separated CNG and Cl currents at different odorant strengths for a given ORN. From the dose–response relations between odorant strength and the separated currents, it is clear that, at low odorant strengths, the ratio between total current and CNG current at a given time instant—a parameter reflecting the amplification provided by the Cl current—rises from 1.0 at early times of the response (i.e., before the Cl current appears) to a much larger value at later times. At higher odorant strengths, the amplification does not ramp up as steeply because the Cl current typically reaches saturation fairly rapidly, whereas the CNG current tends to continue to increase. The Cl current substantially outlasts the CNG current so that, at longer times during the decay of the overall response, the amplification ratio increases essentially to infinity (although this parameter is no longer very meaningful by then). The act of smelling is complex, consisting of mixed passive breathing rhythm (58, 59) and active sniffing, depending on the animal species. In the present study, we have chosen to use brief odorant pulses (i.e., “impulse” stimuli analogous to light flashes for retinal photoreceptors; Methods; cf. refs. 50 and 52) for ease of data analysis and interpretation. In the natural setting, however, odorant stimuli rarely arrive as single pulses, especially given the motor physiology of smelling as mentioned. Furthermore, in live animal, airborne odorants have to penetrate the mucus layer before accessing the olfactory cilia, a step likely to slow down the on- and off-kinetics of odorant stimulation. As such, an odorant stimulus will be prolonged, bringing temporal summation of signals even more to the fore, and making the relatively long-lasting Cl current, which enhances ORN sensitivity, increasingly important.
The high amplification at low odorant strengths reflects the high sensitivity of the Cl current to intracellular Ca2+ concentration, which is roughly described by the Hill equation with a nH (Hill coefficient) of 2–3 and a half-saturating Ca2+ concentration of 2–5 µM (14, 19). For a frog ORN with nominally 10 cilia of ∼0.2 µm in diameter and ∼40 µm in average length (60–62), the total intraciliary volume is ∼12 µm3. Based on this volume, and assuming for simplicity spatial homogeneity along the cilium, a 1-pC Ca2+ influx would increase the internal Ca2+ concentration by ∼400 µM if there were no intracellular Ca2+ buffer. Thus, for argument’s sake, an overall CNG current of 1 pA decaying exponentially with a 0.2-s time constant—barely detectable and with a time course broadly comparable to that observed by us (Figs. 4–6 and Figs. S2–S4)—would give a Ca2+ influx of ∼0.2 pC × 0.3 = 0.06 pC, assuming a Ca2+ component in the CNG current of ∼30% for 1 mM extracellular Ca2+ as in our normal Ringer’s (57). This amount of Ca2+ influx would elevate total intraciliary Ca2+ by ∼24 µM. Even with a free/total Ca2+ concentration ratio of, say, 1/10 effected by intraciliary Ca2+ buffering, the tiny Ca2+ influx would still increase the internal free Ca2+ concentration by ∼2.4 µM, enough to activate a substantial Cl current. The bottom line is that it really does not take much CNG current at all to elicit a substantial Cl current. In the absence of information about intraciliary Ca2+ buffering, on top of which there is presently no quantitative information about the capacity and speed of Ca2+ extrusion from the cilia, we shall not venture into further quantification here. Besides, the cilia of frog ORNs are motile and just barely visible under the light microscope, so visual observation can only crudely estimate the number and length of cilia on an ORN under recording. Some of the cilia could also have sustained injury during mechanical dissociation of the olfactory epithelium (Methods), possibly contributing to the varied maximum receptor current elicited by odorant across cells (although this current variation also depended at least partly on the exact position of the ORN cell body inside the suction pipette; Methods).
Considering the amplification provided by the Cl current, especially in the situation of low ion concentrations in the nasal mucus (Results), it is rather surprising that the genetic removal of this current was reported not to change the behavioral olfactory sensitivity or detection threshold in mice (36). Signals from ORNs to the olfactory bulb in the brain require action potential firing, which in frog ORNs has a modulation threshold (at least for excitatory odorants) of ∼1.2 pA in odorant-elicited receptor current (53). As shown in Results, there is indeed still a substantial Cl-current component at this threshold, which should thus be expected to dictate the signaling threshold of the ORN. The reason why Billig et al. (36) failed to find a significance of the Cl current is presently unclear. One simple reason would be a species difference between mouse and frog, but this is perhaps unlikely because the Cl current is such a robust phenomenon. Furthermore, some human patients with type-3 von Willebrand disease happened to have a simultaneously disrupted Ano2 gene and these individuals did show some behavioral olfactory defects, although it is still uncertain now whether this genotype–phenotype correlation is authentic, that is, causal (20, 36, 63). In any case, our experiments on mouse ORNs (64) are in progress and will provide the answer upon completion. In the meantime, however, because the mouse line used by Billig et al. (36) was a constitutive Ano2−/− line created by crossing an Ano2fl/fl line to a deleter line (65), it remains quite possible that compensatory or other changes have occurred during animal development and confounded the behavioral measurements. Alternatively, even if the mouse’s olfactory sensitivity truly turns out not to depend on the ORN’s Cl current, this surprise may come from some dynamic signaling in the olfactory neuronal circuitry—a would-be interesting question in its own right. For example, a monoclonal-nose mouse with >90% of ORNs in the primary olfactory epithelium expressing only the M71-OR is surprisingly incapable of detecting behaviorally this specific OR’s cognate ligand, acetophenone (66). The bottom line is that the behavior/performance of neuronal circuitry is not necessarily readily predictable. On the other hand, before one can make progress in this understanding, it is first and foremost important to know correctly and exactly the properties of each neuronal element, in this case, the ORN.
Methods
Tissue Preparation.
Frogs (Rana pipiens) were killed by pithing. The main olfactory epithelium was dissected out from the nose and kept in normal Ringer’s on ice for up to 4 h before use. When needed, a small piece of epithelium was laid flat with cilia side facing up on a Sylgard dish. ORNs were released from the epithelium by gently touching the surface with a small piece of razor blade, followed by trituration to enhance the yield (29, 37). The suspension solution containing dissociated ORNs was put in the recording chamber on a Zeiss Axiovert microscope, and the cells were allowed to settle at the bottom for 25–30 min. The chamber was then perfused with normal Ringer’s at ∼1 mL/min throughout the experiments. Live ORNs were identified by their motile cilia with differential interference contrast optics. All animal experiments were approved by the Institutional Animal Care and Use Committee at the Johns Hopkins University School of Medicine.
Chemicals.
(+)-Limonene solutions were prepared fresh daily by diluting pure (+)-limonene (Sigma-Aldrich) into Ringer’s. NFA (Sigma-Aldrich) was directly dissolved in Ringer’s with concentrations of 30, 100, and 300 µM by heating the solution to 37 °C for 1–1.5 h. NFA even at 300 µM did not change the pH of the buffered Ringer’s. TTX was prepared as a 1 mM stock solution and diluted to 500 nM for experiments. Verapamil was prepared as a 50 mM stock solution and diluted to 50 μM for experiments. Mibefradil was prepared as a 5 mM stock solution and diluted to 1 μM for experiments.
Solutions.
Normal Ringer’s contained the following (in mM): 111 NaCl, 2.5 KCl, 1.6 MgCl2, 1 CaCl2, 0.01 EDTA, 3 Hepes, 10 glucose, pH 7.7, adjusted with NaOH. The 0-Ca2+ Ringer’s had no added CaCl2 and EDTA, but 3.05 mM MgCl2 and 1 mM EGTA, to give the same total free divalent cation concentration as in normal Ringer’s. Calculations were made according to MaxChelator. Li- and Chol-Ringer’s had equimolar replacement of NaCl by LiCl and CholCl, respectively, with pH adjusted with tetramethylammonium hydroxide (TMAOH) instead of NaOH. Low-NaCl Ringer’s had same composition as normal Ringer’s except containing 55.5 mM Na-methanesulfonate and 55.5 mM CholCl instead of 111 mM NaCl, and TMAOH for adjusting pH.
Solution Changes.
A motor-stepper system (SF-77B; Warner Instrument) was used for solution changes. Three manifolds each receiving six solution inputs were connected to three parallel square capillaries (Warner Instruments; part number 3SG700-5: inner width of 0.6 mm each, with partition width of 0.1 mm) anchored as an array, producing up to three horizontal, parallel solution streams sharing sharp boundaries. The flow of each of the 18 solutions in total can be turned on and off by solenoid valves (LHDA0030300BA2; Lee Company) to give various combinations of up to three solutions. At the beginning of an experiment, the recorded cell was positioned near the center of a stream carrying normal Ringer’s. Odorant or NFA application was carried out by electronic actuation of the motor stepper, which swiftly displaced the capillary array such that the cell became situated near the center of an adjacent stream by transitioning across a boundary. A solution change was typically complete in 5–10 ms, as measured by the junction current recorded when transitioning from Ringer’s to diluted [90% (vol/vol)] Ringer’s. As such, a pulse of odorant, typically 30 ms in duration, could be delivered by translating a cell from Ringer’s to odorant-containing Ringer’s and then back. Between odorant pulses, the cell was kept in Ringer’s for at least 15 s for recovery. For experiments involving odorant as well as NFA applications, the cell was given a 1-min recovery in normal Ringer’s between trials to obtain consistent odorant-elicited responses. In 0-Ca2+ experiments, the cell was switched from normal Ringer’s to 0-Ca2+–Ringer’s for 1–3 s until a stable recording baseline in 0-Ca2+ was reached before a pulse of odorant or NFA in 0-Ca2+ was given. The cell was then returned to normal Ringer’s as soon as the procedure was complete, which typically took 3–5 s, to minimize the cell’s exposure time in 0-Ca2+ Ringer’s.
The time courses of solution changes (based on junction current measurements with 90% Ringer’s as described above) are indicated at the top of all figures. In figures showing experiments involving the replacement of Na+ in normal Ringer’s by Li+ or Chol+, the corresponding junction current caused by each cation substitution (measured by repeating the specific cation substitution in the absence of the odorant stimulus) has already been subtracted away.
Incidentally, a brief 30-ms pulse of odorant mentioned above can be legitimately considered to be an impulse stimulus in relation to the much slower olfactory response, where an impulse stimulus is defined as one that, when reduced in strength but prolonged in duration proportionately, will not change the response amplitude or waveform (50).
Electrophysiology.
Single, mechanically isolated ORNs were used for recording. The suction pipette recording method (37) was adopted, with an Axopatch 1C or 1D patch-clamp amplifier and head stage 100/1 (Molecular Devices). Unlike patch-clamp recording, this method was noninvasive, thus maintaining the native intracellular ion concentrations in the ORN. The membrane potential was not clamped, but free to change as in the ORN in situ. Because of the functional polarity of the ORN and the recording configuration we adopted (with cell body and dendrite, the latter typically already withdrawn into the cell body for isolated frog ORNs, inside the suction pipette, leaving the cilia exposed to the bath solution), the membrane current at the cell body recorded by the pipette was actually opposite in polarity to the transduction current at the cilia. For ease of understanding, in all figures we have plotted the responses such that negative current indicates inward transduction current at the cilia. Signals were low-pass filtered at 500 Hz (eight-pole Bessel), unless specified otherwise, and digitized at 2 kHz. Recording pipettes were pulled from standard borosilicate glass capillaries (WPI; TW100-4), with tip openings being fire-polished to 4–5 μm and resistances of 1.0–1.5 MΩ when filled with normal Ringer’s. The soma of an ORN was drawn by suction as much as possible into the recording pipette, leaving the dendrite (retracted most of the time) and cilia exposed to the bath solution. The series resistance with a cell in place was typically 8–12 MΩ.
Short-Pulse Application of NFA.
In nearly all experiments shown in Results, NFA was applied as a short pulse, typically 150-ms except for Fig. 1 B and C. A short pulse was used based on the following considerations.
First, upon removal of NFA, the receptor current reemerged, but this rebound receptor current typically overshot (i.e., exceeded) the control response without NFA (Fig. S7A, red trace), a feature also seen by Lowe and Gold (16) and cryptically interpreted as a CNG current induced possibly by NFA acting as an odorant. This explanation is untenable at least in our experiments because we only studied ORNs that were unresponsive to NFA alone (Results). We think the “rebound” current was actually a Cl current, which we confirmed with a second NFA pulse causing the rebound current to return roughly to the level expected from the time course of the residual current during NFA (Fig. S7B, green trace). Also, the rebound current overshoot diminished and eventually disappeared at high (+)-limonene concentration (Fig. S7C), presumably upon saturation of the Cl current. Most probably, NFA not only blocked the Cl current but also had the secondary effect of elevating intracellular Ca2+ (67), which when concomitant with the removal of NFA blockage would lead to a larger (i.e., overshot) Ca2+-activated Cl current, unless the latter was already saturated. Indeed, a larger overshoot was observed after a higher NFA concentration (Fig. S7D) or longer NFA exposure (Fig. S7E). By confining our attention to the blocking effect of a short NFA pulse and overlooking the rebound and the overshooting, the above complication did not affect us. Incidentally, the same secondary effect of NFA likely also explains the upswing in the residual/total current ratio described in Results in association with the experiment in Fig. 2.
Fig. S7.
Current rebound and overshoot after NFA removal. (A) After termination of a 150-ms, 300 µM NFA pulse (red), an ORN’s olfactory response reemerges (rebounds) and exceeds (overshoots) the control (black) response. Three millimolar (+)-limonene. (B) Similar experiment (red trace) as in A on another ORN, but a second 150-ms, 300 µM NFA pulse is applied during the rebound (green trace), consequently blocking the rebound current, indicating the latter is primarily if not exclusively a Cl current. Three millimolar (+)-limonene. (C) The overshoot of the rebound current (red) decreases and finally disappears when the overall response (control; black) progressively approaches saturation with increasing (+)-limonene concentrations. Same cell throughout, and same as cell in Fig. 6. (D) The magnitude of rebound/overshoot is larger with 300 µM NFA than with 100 µM NFA. (E) A longer, 500-ms NFA pulse (blue) elicits a larger current overshoot than a shorter, 150-ms NFA pulse (red). Three hundred micromolar NFA.
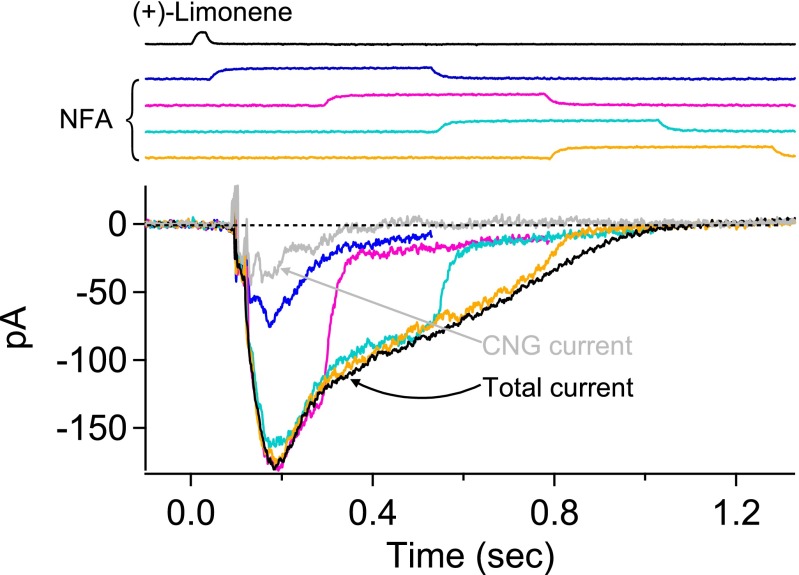
With an even longer NFA pulse (>>150 ms), the situation and interpretation can get even more complex. In the experiment of Fig. S8, where the NFA pulse lasted 500 ms, the residual current during the first two NFA pulses (color-coded in blue and pink, respectively) with a 250-ms time delay between them never overlapped. Instead, the tail residual current during the first NFA pulse reached a plateau lower than that during the second NFA pulse (a consistent observation from four cells). We speculate that the cumulative intracellular Ca2+ increase caused by a long NFA pulse also inhibited the CNG channel (68, 69), thus reducing Ca2+ influx through this channel and causing a net lower Ca2+ intracellular rise, consequently a smaller Cl current. This lack-of-overlap issue did not happen to the late long NFA pulses because by then the inhibitory effect on the CNG channel was no longer relevant because the CNG current had already largely disappeared (see gray trace in Fig. S8 derived from the current separation procedure of Fig. 4).
Fig. S8.
Longer NFA exposure. A series of 500-ms (longer than the typical 150 ms), 300 µM NFA is given in successive trials during an odorant response to 30-ms, 3 mM (+)-limonene, with incremental delays of increment equal to 250 ms instead of 60 ms typical of other experiments. Fast and slow phases of current reduction by NFA are still observed, but the final tail of the residual current in the earliest NFA pulse (blue) shows a trajectory below that in the next NFA pulse (red), unlike what is found with 150-ms NFA pulses. See text for details. For reference, the dissected CNG current (gray) derived from the current separation procedure is also shown.
Because of the above complexities, we have adhered to short NFA pulses in the current dissection.
Acknowledgments
We thank Haiqing Zhao, Randall Reed, Jeremy Nathans (all of Johns Hopkins University School of Medicine), Samuel M. S. Wu (Baylor College of Medicine), and members of the K.-W.Y. laboratory for discussions and comments on the manuscript. We also thank the two reviewers for their extremely helpful comments. This work was supported by NIH Grant R01 DC14941 (to K.-W.Y.).
Footnotes
The authors declare no conflict of interest.
See Commentary on page 11063.
This article contains supporting information online at www.pnas.org/lookup/suppl/doi:10.1073/pnas.1613891113/-/DCSupplemental.
References
- 1.Kleene SJ. The electrochemical basis of odor transduction in vertebrate olfactory cilia. Chem Senses. 2008;33(9):839–859. doi: 10.1093/chemse/bjn048. [DOI] [PubMed] [Google Scholar]
- 2.Munger SD, Leinders-Zufall T, Zufall F. Subsystem organization of the mammalian sense of smell. Annu Rev Physiol. 2009;71:115–140. doi: 10.1146/annurev.physiol.70.113006.100608. [DOI] [PubMed] [Google Scholar]
- 3.Reisert J, Zhao H. Perspectives on: Information and coding in mammalian sensory physiology: Response kinetics of olfactory receptor neurons and the implications in olfactory coding. J Gen Physiol. 2011;138(3):303–310. doi: 10.1085/jgp.201110645. [DOI] [PMC free article] [PubMed] [Google Scholar]
- 4.Schild D, Restrepo D. Transduction mechanisms in vertebrate olfactory receptor cells. Physiol Rev. 1998;78(2):429–466. doi: 10.1152/physrev.1998.78.2.429. [DOI] [PubMed] [Google Scholar]
- 5.Bradley J, Frings S, Yau KW, Reed R. Nomenclature for ion channel subunits. Science. 2001;294(5549):2095–2096. doi: 10.1126/science.294.5549.2095. [DOI] [PMC free article] [PubMed] [Google Scholar]
- 6.Bradley J, Li J, Davidson N, Lester HA, Zinn K. Heteromeric olfactory cyclic nucleotide-gated channels: A subunit that confers increased sensitivity to cAMP. Proc Natl Acad Sci USA. 1994;91(19):8890–8894. doi: 10.1073/pnas.91.19.8890. [DOI] [PMC free article] [PubMed] [Google Scholar]
- 7.Dhallan RS, Yau KW, Schrader KA, Reed RR. Primary structure and functional expression of a cyclic nucleotide-activated channel from olfactory neurons. Nature. 1990;347(6289):184–187. doi: 10.1038/347184a0. [DOI] [PubMed] [Google Scholar]
- 8.Liman ER, Buck LB. A second subunit of the olfactory cyclic nucleotide-gated channel confers high sensitivity to cAMP. Neuron. 1994;13(3):611–621. doi: 10.1016/0896-6273(94)90029-9. [DOI] [PubMed] [Google Scholar]
- 9.Sautter A, Zong X, Hofmann F, Biel M. An isoform of the rod photoreceptor cyclic nucleotide-gated channel beta subunit expressed in olfactory neurons. Proc Natl Acad Sci USA. 1998;95(8):4696–4701. doi: 10.1073/pnas.95.8.4696. [DOI] [PMC free article] [PubMed] [Google Scholar]
- 10.Zheng J, Zagotta WN. Stoichiometry and assembly of olfactory cyclic nucleotide-gated channels. Neuron. 2004;42(3):411–421. doi: 10.1016/s0896-6273(04)00253-3. [DOI] [PubMed] [Google Scholar]
- 11.Zufall F, Leinders-Zufall T. The cellular and molecular basis of odor adaptation. Chem Senses. 2000;25(4):473–481. doi: 10.1093/chemse/25.4.473. [DOI] [PubMed] [Google Scholar]
- 12.Dauner K, Lissmann J, Jeridi S, Frings S, Möhrlen F. Expression patterns of anoctamin 1 and anoctamin 2 chloride channels in the mammalian nose. Cell Tissue Res. 2012;347(2):327–341. doi: 10.1007/s00441-012-1324-9. [DOI] [PubMed] [Google Scholar]
- 13.Kleene SJ. Origin of the chloride current in olfactory transduction. Neuron. 1993;11(1):123–132. doi: 10.1016/0896-6273(93)90276-w. [DOI] [PubMed] [Google Scholar]
- 14.Kleene SJ, Gesteland RC. Calcium-activated chloride conductance in frog olfactory cilia. J Neurosci. 1991;11(11):3624–3629. doi: 10.1523/JNEUROSCI.11-11-03624.1991. [DOI] [PMC free article] [PubMed] [Google Scholar]
- 15.Kurahashi T, Yau KW. Co-existence of cationic and chloride components in odorant-induced current of vertebrate olfactory receptor cells. Nature. 1993;363(6424):71–74. doi: 10.1038/363071a0. [DOI] [PubMed] [Google Scholar]
- 16.Lowe G, Gold GH. Nonlinear amplification by calcium-dependent chloride channels in olfactory receptor cells. Nature. 1993;366(6452):283–286. doi: 10.1038/366283a0. [DOI] [PubMed] [Google Scholar]
- 17.Ponissery Saidu S, Stephan AB, Talaga AK, Zhao H, Reisert J. Channel properties of the splicing isoforms of the olfactory calcium-activated chloride channel Anoctamin 2. J Gen Physiol. 2013;141(6):691–703. doi: 10.1085/jgp.201210937. [DOI] [PMC free article] [PubMed] [Google Scholar]
- 18.Rasche S, et al. Tmem16b is specifically expressed in the cilia of olfactory sensory neurons. Chem Senses. 2010;35(3):239–245. doi: 10.1093/chemse/bjq007. [DOI] [PubMed] [Google Scholar]
- 19.Reisert J, Bauer PJ, Yau KW, Frings S. The Ca-activated Cl channel and its control in rat olfactory receptor neurons. J Gen Physiol. 2003;122(3):349–363. doi: 10.1085/jgp.200308888. [DOI] [PMC free article] [PubMed] [Google Scholar]
- 20.Stephan AB, et al. ANO2 is the cilial calcium-activated chloride channel that may mediate olfactory amplification. Proc Natl Acad Sci USA. 2009;106(28):11776–11781. doi: 10.1073/pnas.0903304106. [DOI] [PMC free article] [PubMed] [Google Scholar]
- 21.Zhainazarov AB, Ache BW. Odor-induced currents in Xenopus olfactory receptor cells measured with perforated-patch recording. J Neurophysiol. 1995;74(1):479–483. doi: 10.1152/jn.1995.74.1.479. [DOI] [PubMed] [Google Scholar]
- 22.Hengl T, et al. Molecular components of signal amplification in olfactory sensory cilia. Proc Natl Acad Sci USA. 2010;107(13):6052–6057. doi: 10.1073/pnas.0909032107. [DOI] [PMC free article] [PubMed] [Google Scholar]
- 23.Jaén C, Ozdener MH, Reisert J. Mechanisms of chloride uptake in frog olfactory receptor neurons. J Comp Physiol A Neuroethol Sens Neural Behav Physiol. 2011;197(4):339–349. doi: 10.1007/s00359-010-0618-1. [DOI] [PubMed] [Google Scholar]
- 24.Kaneko H, Putzier I, Frings S, Kaupp UB, Gensch T. Chloride accumulation in mammalian olfactory sensory neurons. J Neurosci. 2004;24(36):7931–7938. doi: 10.1523/JNEUROSCI.2115-04.2004. [DOI] [PMC free article] [PubMed] [Google Scholar]
- 25.Reisert J, Lai J, Yau KW, Bradley J. Mechanism of the excitatory Cl− response in mouse olfactory receptor neurons. Neuron. 2005;45(4):553–561. doi: 10.1016/j.neuron.2005.01.012. [DOI] [PMC free article] [PubMed] [Google Scholar]
- 26.Nickell WT, Kleene NK, Kleene SJ. Mechanisms of neuronal chloride accumulation in intact mouse olfactory epithelium. J Physiol. 2007;583(Pt 3):1005–1020. doi: 10.1113/jphysiol.2007.129601. [DOI] [PMC free article] [PubMed] [Google Scholar]
- 27.Smith DW, Thach S, Marshall EL, Mendoza MG, Kleene SJ. Mice lacking NKCC1 have normal olfactory sensitivity. Physiol Behav. 2008;93(1-2):44–49. doi: 10.1016/j.physbeh.2007.07.011. [DOI] [PMC free article] [PubMed] [Google Scholar]
- 28.Antolin S, Matthews HR. The effect of external sodium concentration on sodium-calcium exchange in frog olfactory receptor cells. J Physiol. 2007;581(Pt 2):495–503. doi: 10.1113/jphysiol.2007.131094. [DOI] [PMC free article] [PubMed] [Google Scholar]
- 29.Reisert J, Matthews HR. Na+-dependent Ca2+ extrusion governs response recovery in frog olfactory receptor cells. J Gen Physiol. 1998;112(5):529–535. doi: 10.1085/jgp.112.5.529. [DOI] [PMC free article] [PubMed] [Google Scholar]
- 30.Stephan AB, et al. The Na+/Ca2+ exchanger NCKX4 governs termination and adaptation of the mammalian olfactory response. Nat Neurosci. 2011;15(1):131–137. doi: 10.1038/nn.2943. [DOI] [PMC free article] [PubMed] [Google Scholar]
- 31.Antolin S, Reisert J, Matthews HR. Olfactory response termination involves Ca2+-ATPase in vertebrate olfactory receptor neuron cilia. J Gen Physiol. 2010;135(4):367–378. doi: 10.1085/jgp.200910337. [DOI] [PMC free article] [PubMed] [Google Scholar]
- 32.Castillo K, Delgado R, Bacigalupo J. Plasma membrane Ca2+-ATPase in the cilia of olfactory receptor neurons: Possible role in Ca2+ clearance. Eur J Neurosci. 2007;26(9):2524–2531. doi: 10.1111/j.1460-9568.2007.05863.x. [DOI] [PubMed] [Google Scholar]
- 33.Griff ER, Kleene NK, Kleene SJ. A selective PMCA inhibitor does not prolong the electroolfactogram in mouse. PLoS One. 2012;7(5):e37148. doi: 10.1371/journal.pone.0037148. [DOI] [PMC free article] [PubMed] [Google Scholar]
- 34.Kleene SJ. Limits of calcium clearance by plasma membrane calcium ATPase in olfactory cilia. PLoS One. 2009;4(4):e5266. doi: 10.1371/journal.pone.0005266. [DOI] [PMC free article] [PubMed] [Google Scholar]
- 35.Saidu SP, Weeraratne SD, Valentine M, Delay R, Van Houten JL. Role of plasma membrane calcium ATPases in calcium clearance from olfactory sensory neurons. Chem Senses. 2009;34(4):349–358. doi: 10.1093/chemse/bjp008. [DOI] [PMC free article] [PubMed] [Google Scholar]
- 36.Billig GM, Pál B, Fidzinski P, Jentsch TJ. Ca2+-activated Cl− currents are dispensable for olfaction. Nat Neurosci. 2011;14(6):763–769. doi: 10.1038/nn.2821. [DOI] [PubMed] [Google Scholar]
- 37.Bhandawat V, Reisert J, Yau KW. Elementary response of olfactory receptor neurons to odorants. Science. 2005;308(5730):1931–1934. doi: 10.1126/science.1109886. [DOI] [PMC free article] [PubMed] [Google Scholar]
- 38.Lowe G, Gold GH. The spatial distributions of odorant sensitivity and odorant-induced currents in salamander olfactory receptor cells. J Physiol. 1991;442:147–168. doi: 10.1113/jphysiol.1991.sp018787. [DOI] [PMC free article] [PubMed] [Google Scholar]
- 39.Chen TY, Takeuchi H, Kurahashi T. Odorant inhibition of the olfactory cyclic nucleotide-gated channel with a native molecular assembly. J Gen Physiol. 2006;128(3):365–371. doi: 10.1085/jgp.200609577. [DOI] [PMC free article] [PubMed] [Google Scholar]
- 40.Kurahashi T, Lowe G, Gold GH. Suppression of odorant responses by odorants in olfactory receptor cells. Science. 1994;265(5168):118–120. doi: 10.1126/science.8016645. [DOI] [PubMed] [Google Scholar]
- 41.Huang F, et al. Calcium-activated chloride channel TMEM16A modulates mucin secretion and airway smooth muscle contraction. Proc Natl Acad Sci USA. 2012;109(40):16354–16359. doi: 10.1073/pnas.1214596109. [DOI] [PMC free article] [PubMed] [Google Scholar]
- 42.Boccaccio A, Menini A. Temporal development of cyclic nucleotide-gated and Ca2+-activated Cl− currents in isolated mouse olfactory sensory neurons. J Neurophysiol. 2007;98(1):153–160. doi: 10.1152/jn.00270.2007. [DOI] [PubMed] [Google Scholar]
- 43.Sagheddu C, et al. Calcium concentration jumps reveal dynamic ion selectivity of calcium-activated chloride currents in mouse olfactory sensory neurons and TMEM16b-transfected HEK 293T cells. J Physiol. 2010;588(Pt 21):4189–4204. doi: 10.1113/jphysiol.2010.194407. [DOI] [PMC free article] [PubMed] [Google Scholar]
- 44.Balasubramanian S, Lynch JW, Barry PH. The permeation of organic cations through cAMP-gated channels in mammalian olfactory receptor neurons. J Membr Biol. 1995;146(2):177–191. doi: 10.1007/BF00238007. [DOI] [PubMed] [Google Scholar]
- 45.Nakatani K, Yau KW. Calcium and magnesium fluxes across the plasma membrane of the toad rod outer segment. J Physiol. 1988;395:695–729. doi: 10.1113/jphysiol.1988.sp016942. [DOI] [PMC free article] [PubMed] [Google Scholar]
- 46.Yau KW, Nakatani K. Cation selectivity of light-sensitive conductance in retinal rods. Nature. 1984;309(5966):352–354. doi: 10.1038/309352a0. [DOI] [PubMed] [Google Scholar]
- 47.Yau KW, Nakatani K. Electrogenic Na-Ca exchange in retinal rod outer segment. Nature. 1984;311(5987):661–663. doi: 10.1038/311661a0. [DOI] [PubMed] [Google Scholar]
- 48.Buck LB. The molecular architecture of odor and pheromone sensing in mammals. Cell. 2000;100(6):611–618. doi: 10.1016/s0092-8674(00)80698-4. [DOI] [PubMed] [Google Scholar]
- 49.Baylor DA, Lamb TD, Yau KW. The membrane current of single rod outer segments. J Physiol. 1979;288:589–611. [PMC free article] [PubMed] [Google Scholar]
- 50.Luo D-G, Kefalov V, Yau K-W. Phototransduction in retinal rods and cones. In: Masland RH, Albright TD, editors. The Senses: A Comprehensive Reference. Vol 1. Academic-Elsevier; New York: 2008. pp. 269–301. [Google Scholar]
- 51.Kleene SJ. High-gain, low-noise amplification in olfactory transduction. Biophys J. 1997;73(2):1110–1117. doi: 10.1016/S0006-3495(97)78143-8. [DOI] [PMC free article] [PubMed] [Google Scholar]
- 52.Baylor DA, Hodgkin AL, Lamb TD. The electrical response of turtle cones to flashes and steps of light. J Physiol. 1974;242(3):685–727. doi: 10.1113/jphysiol.1974.sp010731. [DOI] [PMC free article] [PubMed] [Google Scholar]
- 53.Bhandawat V, Reisert J, Yau KW. Signaling by olfactory receptor neurons near threshold. Proc Natl Acad Sci USA. 2010;107(43):18682–18687. doi: 10.1073/pnas.1004571107. [DOI] [PMC free article] [PubMed] [Google Scholar]
- 54.Chiu D, Nakamura T, Gold GH. Ionic composition of toad olfactory mucus measured with ion selective microelectrodes. Chem Senses. 1988;13(4):677–678. [Google Scholar]
- 55.Joshi H, Getchell ML, Zielinski B, Getchell TV. Spectrophotometric determination of cation concentrations in olfactory mucus. Neurosci Lett. 1987;82(3):321–326. doi: 10.1016/0304-3940(87)90276-x. [DOI] [PubMed] [Google Scholar]
- 56.Tucker D, Shibuya T. A physiologic and pharmacologic study of olfactory receptors. Cold Spring Harb Symp Quant Biol. 1965;30:207–215. doi: 10.1101/sqb.1965.030.01.023. [DOI] [PubMed] [Google Scholar]
- 57.Dzeja C, Hagen V, Kaupp UB, Frings S. Ca2+ permeation in cyclic nucleotide-gated channels. EMBO J. 1999;18(1):131–144. doi: 10.1093/emboj/18.1.131. [DOI] [PMC free article] [PubMed] [Google Scholar]
- 58.Ghatpande AS, Reisert J. Olfactory receptor neuron responses coding for rapid odour sampling. J Physiol. 2011;589(Pt 9):2261–2273. doi: 10.1113/jphysiol.2010.203687. [DOI] [PMC free article] [PubMed] [Google Scholar]
- 59.Mainland JD, Lundström JN, Reisert J, Lowe G. From molecule to mind: An integrative perspective on odor intensity. Trends Neurosci. 2014;37(8):443–454. doi: 10.1016/j.tins.2014.05.005. [DOI] [PMC free article] [PubMed] [Google Scholar]
- 60.Farbman AI. Cell Biology of Olfaction. Cambridge Univ Press; Cambridge, UK: 1992. [Google Scholar]
- 61.Kleene SJ, Gesteland RC, Bryant SH. An electrophysiological survey of frog olfactory cilia. J Exp Biol. 1994;195:307–328. doi: 10.1242/jeb.195.1.307. [DOI] [PubMed] [Google Scholar]
- 62.Menco BP. Qualitative and quantitative freeze-fracture studies on olfactory and nasal respiratory structures of frog, ox, rat, and dog. I. A general survey. Cell Tissue Res. 1980;207(2):183–209. doi: 10.1007/BF00237805. [DOI] [PubMed] [Google Scholar]
- 63.Cenedese V, et al. Assessment of the olfactory function in Italian patients with type 3 von Willebrand disease caused by a homozygous 253 kb deletion involving VWF and TMEM16B/ANO2. PLoS One. 2015;10(1):e0116483. doi: 10.1371/journal.pone.0116483. [DOI] [PMC free article] [PubMed] [Google Scholar]
- 64.Ben-Chaim Y, Cheng MM, Yau KW. Unitary response of mouse olfactory receptor neurons. Proc Natl Acad Sci USA. 2011;108(2):822–827. doi: 10.1073/pnas.1017983108. [DOI] [PMC free article] [PubMed] [Google Scholar]
- 65.Schwenk F, Baron U, Rajewsky K. A cre-transgenic mouse strain for the ubiquitous deletion of loxP-flanked gene segments including deletion in germ cells. Nucleic Acids Res. 1995;23(24):5080–5081. doi: 10.1093/nar/23.24.5080. [DOI] [PMC free article] [PubMed] [Google Scholar]
- 66.Fleischmann A, et al. Mice with a “monoclonal nose”: Perturbations in an olfactory map impair odor discrimination. Neuron. 2008;60(6):1068–1081. doi: 10.1016/j.neuron.2008.10.046. [DOI] [PMC free article] [PubMed] [Google Scholar]
- 67.Cruickshank SF, Baxter LM, Drummond RM. The Cl− channel blocker niflumic acid releases Ca2+ from an intracellular store in rat pulmonary artery smooth muscle cells. Br J Pharmacol. 2003;140(8):1442–1450. doi: 10.1038/sj.bjp.0705571. [DOI] [PMC free article] [PubMed] [Google Scholar]
- 68.Chen TY, Yau KW. Direct modulation by Ca2+-calmodulin of cyclic nucleotide-activated channel of rat olfactory receptor neurons. Nature. 1994;368(6471):545–548. doi: 10.1038/368545a0. [DOI] [PubMed] [Google Scholar]
- 69.Kurahashi T, Menini A. Mechanism of odorant adaptation in the olfactory receptor cell. Nature. 1997;385(6618):725–729. doi: 10.1038/385725a0. [DOI] [PubMed] [Google Scholar]


